A New Thought:U Wave May Be the Electrical Activities of Ventricular Outflow Tract
2016-07-21GEFuguiLIJiandongZHAOLanpingWANGXuefangZHANGXiaoYunJIAOHong
GE Fu-gui,LI Jian-dong,ZHAO Lan-ping,WANG Xue-fang,ZHANG Xiao-Yun,JIAO Hong
(Department of Physiology,School of Medicine,Hebei North University,Zhangjiakou 075000,Hebei China)
A New Thought:U Wave May Be the Electrical Activities of Ventricular Outflow Tract
GE Fu-gui,LI Jian-dong,ZHAO Lan-ping,WANG Xue-fang,ZHANG Xiao-Yun,JIAO Hong
(Department of Physiology,School of Medicine,Hebei North University,Zhangjiakou 075000,Hebei China)
Abstract:To investigate whether the U wave might be generated by electrical activity of myocytes in ventricular outflow tract evolved from bulbus cordis.Using multi-electrodes,both left and right ventricular intramural monophasic action potentials(MAP)and ECGs from either ventricle outflow tract region or ventricular epicardial surface were recorded in 70 isolated perfused rabbit hearts suspended in an electrolytic tank.U waves were present in 67%(47/70)of the preparations.The analysis of timing of the occurrence of the U wave with respect to the fast phase of repolarization in MAPs revealed that the U waves appear after the end of MAPs and T wave,are independent waves,which is not related to transmural repolarization of the left or right ventricular muscle.Both the frequency of occurrence and the voltage of the U waves were significantly higher in outflow tract ECGs compared with transcardiac ECGs.Furthermore,the U wave was separated completely from the T wave and superimposed on the P,QRS or T wave in the individual ventricular outflow tract when heart rate was reduced to 42~25 beats/min.The results indicate that U waves may be generated by electrical activity in myocytes of ventricular outflow tract region with evolutionary origin from bulbus cordis rather than ventricular muscle.
Key words:ECG;U wave generation;bulbus cordis;ventricular outflow tract
Since the first description and the name‘U wave’given by Einthoven[1]over 100 years ago,there has not been a consensus about its genesis.Most of the previous researchers regarded that the U wave possesses characteristic of repolarization delay of certain parts or tissues of the left ventricle,and some hypotheses of repolarization or repolarization delay have also been put forward.In addition to the above depolarization delay hypotheses,another hypothesis for U wave generation has been introduced based on the potentials caused by mechanoelectrical coupling(see discussion).However,these previous works did not provide direct experimental evidence on U wave validity,also could not explain all special features of the U wave.Hence,these hypotheses have not yet been firmly established.Concerning the features of U wave,including those occurring after the second heart sound,there is an equipotential line between T and U,its quick ascend and slow descend,and the voltage increases slightly when serum potassium is low[2].But all of above U wave features are not coordinated with that of the repolarization wave whereas being similar to that of depolarization waves.Previous studies from our laboratory indicated that ventricular outflow tract with evolutionary origin from bulbus cordis might still retain some electrophysiological features of bulbus cordis,there exists slow response autorhythmic cells and spontaneous excitation ability[3].Thus it could be speculated that the excitation of certain tissues of ventricular outflow tract might still occur after the ordinary ventricular muscle.In the present study,we hypothesized that U wave might be the depolarization wave of ventricular outflow tract after the excitation of ordinary ventricular muscle.To test this hypothesis,monophasic action potentials(MAP)[4]of left and right ventricular muscle and the ECGs from either the ventricular outflow tract or the ventricle epicardial surface were recorded synchronously in isolated rabbit heart.U wave,ventricular repolarization and the electric activities of ventricular outflow tract were analyzed to establish the relationship between U wave and the electric activities of ventricular outflow tract.
1Methods
A total of 70 rabbits(Chinchilla species,weight 1.5~2.0 kg,provided by the Experiment Animal Center)were used in the experiments carried out in compliance with the Guide for the Care and Use of Laboratory Animals(National Research Council,1996).
1.1Isolatedheartpreparation
The rabbits were anaesthetized with 20% urethane(1.0 g·kg-1)through ear vein,the chests were cut open quickly and the hearts were taken out.By adopted Langedorff method,the separated hearts were perfused under constant temperature[(35±1)℃,in order to reduce heart rate]and constant pressure(90~95 cmH2O)with the oxygenated Krebs-Henseleit's solution(in mmol·L-1:NaCl 118,KCl 4.7,CaCl23.0,MgCl21.15,NaHCO325,KH2PO41.19,glucose 8.0)through coronal artery.The perfused hearts were hanged in a volume conductor bathtub full of Krebs-Henseleit's solution.The contacting spots of hearts surface and electrodes in the bathtub wall were arranged by moving the hearts in three dimensions or rotating the bathtub.MAPs and ECGs were synchronously recorded when heart rate was spontaneous.
1.2Potentialrecording
Special recording electrodes(Ag-AgCl electrode,200 μm in diameter)covered by insulation layer except for the tip were inserted in intramural midwall positions of the left and right ventricles,and coupling it with reference electrodes placed in the bathtub solution[5].The left and right ventricular MAPs were recorded synchronously.ECGs were recorded at least after 10 minutes until the MAP recordings stabilized.The transcardiac left-to-right ECG was recorded by a pair of electrodes fixed on the bathtub wall,and the ECGs of ventricular outflow tract were recorded synchronously with other recordings by a movable exploring electrode(+).The fixed electrodes were placed on epicardial surface of the left(+)and right(-)ventricles,which were recorded transcardiac ECGs.The ECGs of the ventricular wall containing the most obvious U wave were recorded by moving the contacting spots of heart surface and electrode.The exploring electrode was placed on different parts of the ventricular outflow tract(aortic root,pulmonary artery root and the surroundings of ventricular outflow tract).The negative electrodes(-)were the same as the negative electrodes of the fixed electrode(the side wall of right ventricles).So the ECGs containing the U wave were found and recorded from the ventricular outflow tract.Furthermore,electrodes were inserted in the aortic root through the bypath of heart perfusion tube to record the ECGs intra-aortic and on aortic valve.
1.3AnalysisoftherelationshipbetweenUwaveandventricularrepolarization
Four groups' waves were synchronously recorded by RM6240C Multiple-Channel Physiological-Signal Collecting and Processing System(MPCP).Among the four groups,MAPs from two groups were recorded from the left and right ventricular muscle and ECGs from the other two groups were recorded from the ventricular wall and ventricular outflow tract.The waves were reviewed and analyzed by MPCP.The relationships between MAPs of ventricular muscle(starting points,ending points and APD100)and ECGs recorded from different parts were analyzed,focusing on temporal relationships between the repolarization phase of MAP and the U wave.
1.4ComparisonoffrequencyofoccurrenceandthevoltageoftheUwaveintranscardiacandventricularoutflowtractECGs
The occurring probability and voltage of U wave on ventricular wall were compared with those of ventricular outflow tract by the above-mentioned signal collecting and processing system,in order that the exact tissue producing the U wave could be determined.
1.5Statisticalmethods

2Results
2.1TemporalrelationshipbetweenventricularMAPandQRS-TofECG
The voltages of the intramural left and right ventricular MAPs(normally between 2~5 mV)differed in all cardiac preparations between left and right ventricles,but the durations(APD100)were nearly equal in 61 specimens of 70(87%)specimens recorded, and the starting ending points almost coincided.The APD100of the right ventricular wall were slightly longer than those of the left ventricular wall in 9 of 70(13%)of the specimens,with onsets nearly coinciding but the ending points delayed by 10 to 40 ms.The duration of QRS for every specimen was closely equal to the duration of the upstroke of MAP;similarly,the T wave duration was substantively identical to that of MAP's descending branch(repolarization duration).The ending point of T wave coincided with the endpoint of the MAP,i.e.the Q-T interval was equal to APD100of the MAP.When the endpoints of left and right ventricular MAPs differed slightly,the T wave end of both transcardiac left-to-right and outflow tract ECGs coincided with the prolonged ending point of MAP(Fig.1).All these results suggested that the MAPs and ECGs,synchronously recorded in the experiments,could objectively reflect the features of depolarization and repolarization for every ECG wave.

Fig.1 Simultaneously records of the left and right ventricular MAP and ECG on rabbit heart.(A)Right ventricular intramural MAP.(B)Left ventricular intramural MAP.(C)Left-right transcardiac ECG.(D)ECG recording from the zone near the ventricular outflow tract.(E)Superimposed recordings A-D.(80 ms/5 mm).

Fig.2 A U wave appears temporally after the end of MAP and T wave.(A)Right ventricular MAP.(B)Left ventricular MAP.(C)Aortic root ECG(U wave appears after the endof MAP and T wave,T-U segment 30 ms,width of the U wave 290 ms,rising phase 130 ms,falling phase 160 ms,voltage 220 μV).(D)Superimposed recordings A-C.(200 ms/5 mm).
2.2Non-RelationshipbetweenUwaveandrepolarizationofventricularmuscle
A separate wave could be recorded after the end of MAP and T wave in 47(67%)out of 70 rabbit hearts(Fig.2).Most of these separate waves had the same(positive)polarity as the T wave,while a few of them were inverted(negative)waves.The features of these separate waves showed quick rising and slow falling phase,and an equipotential line also existed between the separate wave and T wave(Table 1).In addition,if the potassium concentration of the perfusion was lowered(K+was lowered from 5.9 to 2.3 and 1.2 mmol/l.n=10),the voltage of this wave was increased as well.All these features of the separate wave resemble those of the U wave.Furthermore, when the heart rate(HR)ranged from 50 to 130 beats/min(n=43),the intervals between the starting point of the separate wave and the ending points of MAPs and T wave(T-U segment)became shorter with increasing HR(average interval 27 ms,range 29 ms to 17 ms),again resembling the characteristics of the U wave(Table 1).According to the features and the timing of this wave,it was inferred that this independent wave was undoubtedly a U wave,and it has no relationship with the repolarization of ventricular muscle.

Table 1 Average values of U wave parameters when heart rate was 50 to 130/min.±s)

Table 2 Average voltages of U waves from left to right transcardiac and ventricular outflow tract ECGs (n=47)
Note:*P<0.01 vs left-right ventricular wall(C)**P<0.05 vs left-right ventricular wall(A+C)#P<0.01 vs left-right ventricular wall(A+C)
2.3OccurringprobabilityandvoltageofUwaverecordedinventricularoutflowtractwerehigherthanthoseinventricularwall
U wave could only be observed on the left to right transcardiac recordings in 5 specimens out of 47,and the mean voltage was(44±16)μV.However,U wave could only be recorded on ventricular outflow tract(including aortic root,pulmonary artery root and intra-aortic)in 20 out of 47 specimens,with the mean voltage(198±134)μV.U wave could be synchronously recorded in transcardiac and ventricular outflow tract in 22 specimens.The mean voltage was(138 ±91)μV on the transcardiac and(242 ±135)μV on the ventricular outflow tract(Table 2),which was significantly higher than that of the transcardiac left to right ventricular side wall (P<0.01).
The results in Table 2 also shows that the U wave was present in transcardiac ECGs in 27(57%)of the 47 specimens,while U wave could be recorded on the ventricular outflow tract in 42(89 %)of the 47 specimens.These results indicated that U wave appeared in ventricular outflow tract recordings more frequently than in the transcardiac ECGs(P<0.01).Furthermore, the mean voltage of U wave in transcardiac ECGs in 27 specimens was(130 ±93)μV;it was(221 ±135)μV in ventricular outflow tract ECGs in 42 specimens(P<0.05).The voltage of the U wave on the ventricular outflow tract,especially near the aortic valve,was particularly high(Fig.3).Such high-amplitude U waves were not recorded on the transcardiac ECGs.

Fig.3 Comparison of the voltage of the U wave on left-right transcardiac ECG to that within the aortic valve zone.(A)Right ventricular MAP. (B)Left ventricular MAP. (C)Left-right transcardiac ECG( U wave voltage 68 μV).(D)Aortic valve zone ECG(U wave voltage 418 μV). (E)Superimposed recordings A-D. (200 ms/5 mm).
2.4TemporalseparationoftheUandTwavesbyslowingheartrate
In all experimental specimens where U wave could be recorded, the U wave regularly appeared after the T wave and a stable T-U segment was constantly observed.However,when the perfusate temperature was lowered to 32~30 ℃ and the HR was slowed down to 42~25 beats·min-1,the separation between the U and T waves was observed on ventricular outflow tract ECG in two specimens.In one specimen,the separation appeared when the T-U segment lengthening was similar to the Wenckebach phenomenon,and the voltage of U wave increased significantly when the long T-U segment appeared.For example,when HR was 40/min,the T-U segment increased from 0(TU fusion)to 240 ms and voltage of the U wave increased to 400 μV.When HR was reduced to 25/min,the T-U segment from 0 extended to 330 ms and voltage of U wave increased to 1500 μV.In the second specimen,when HR was 26/min,the T-U segment lengthened gradually;subsequently,the U wave separated completely from the T wave and superimposed on the P,QRS or T wave.So U and QRS-T wave appeared to depend on their own rhythms.This phenomenon never appeared on left to right transcardiac ECGs (Fig.4).
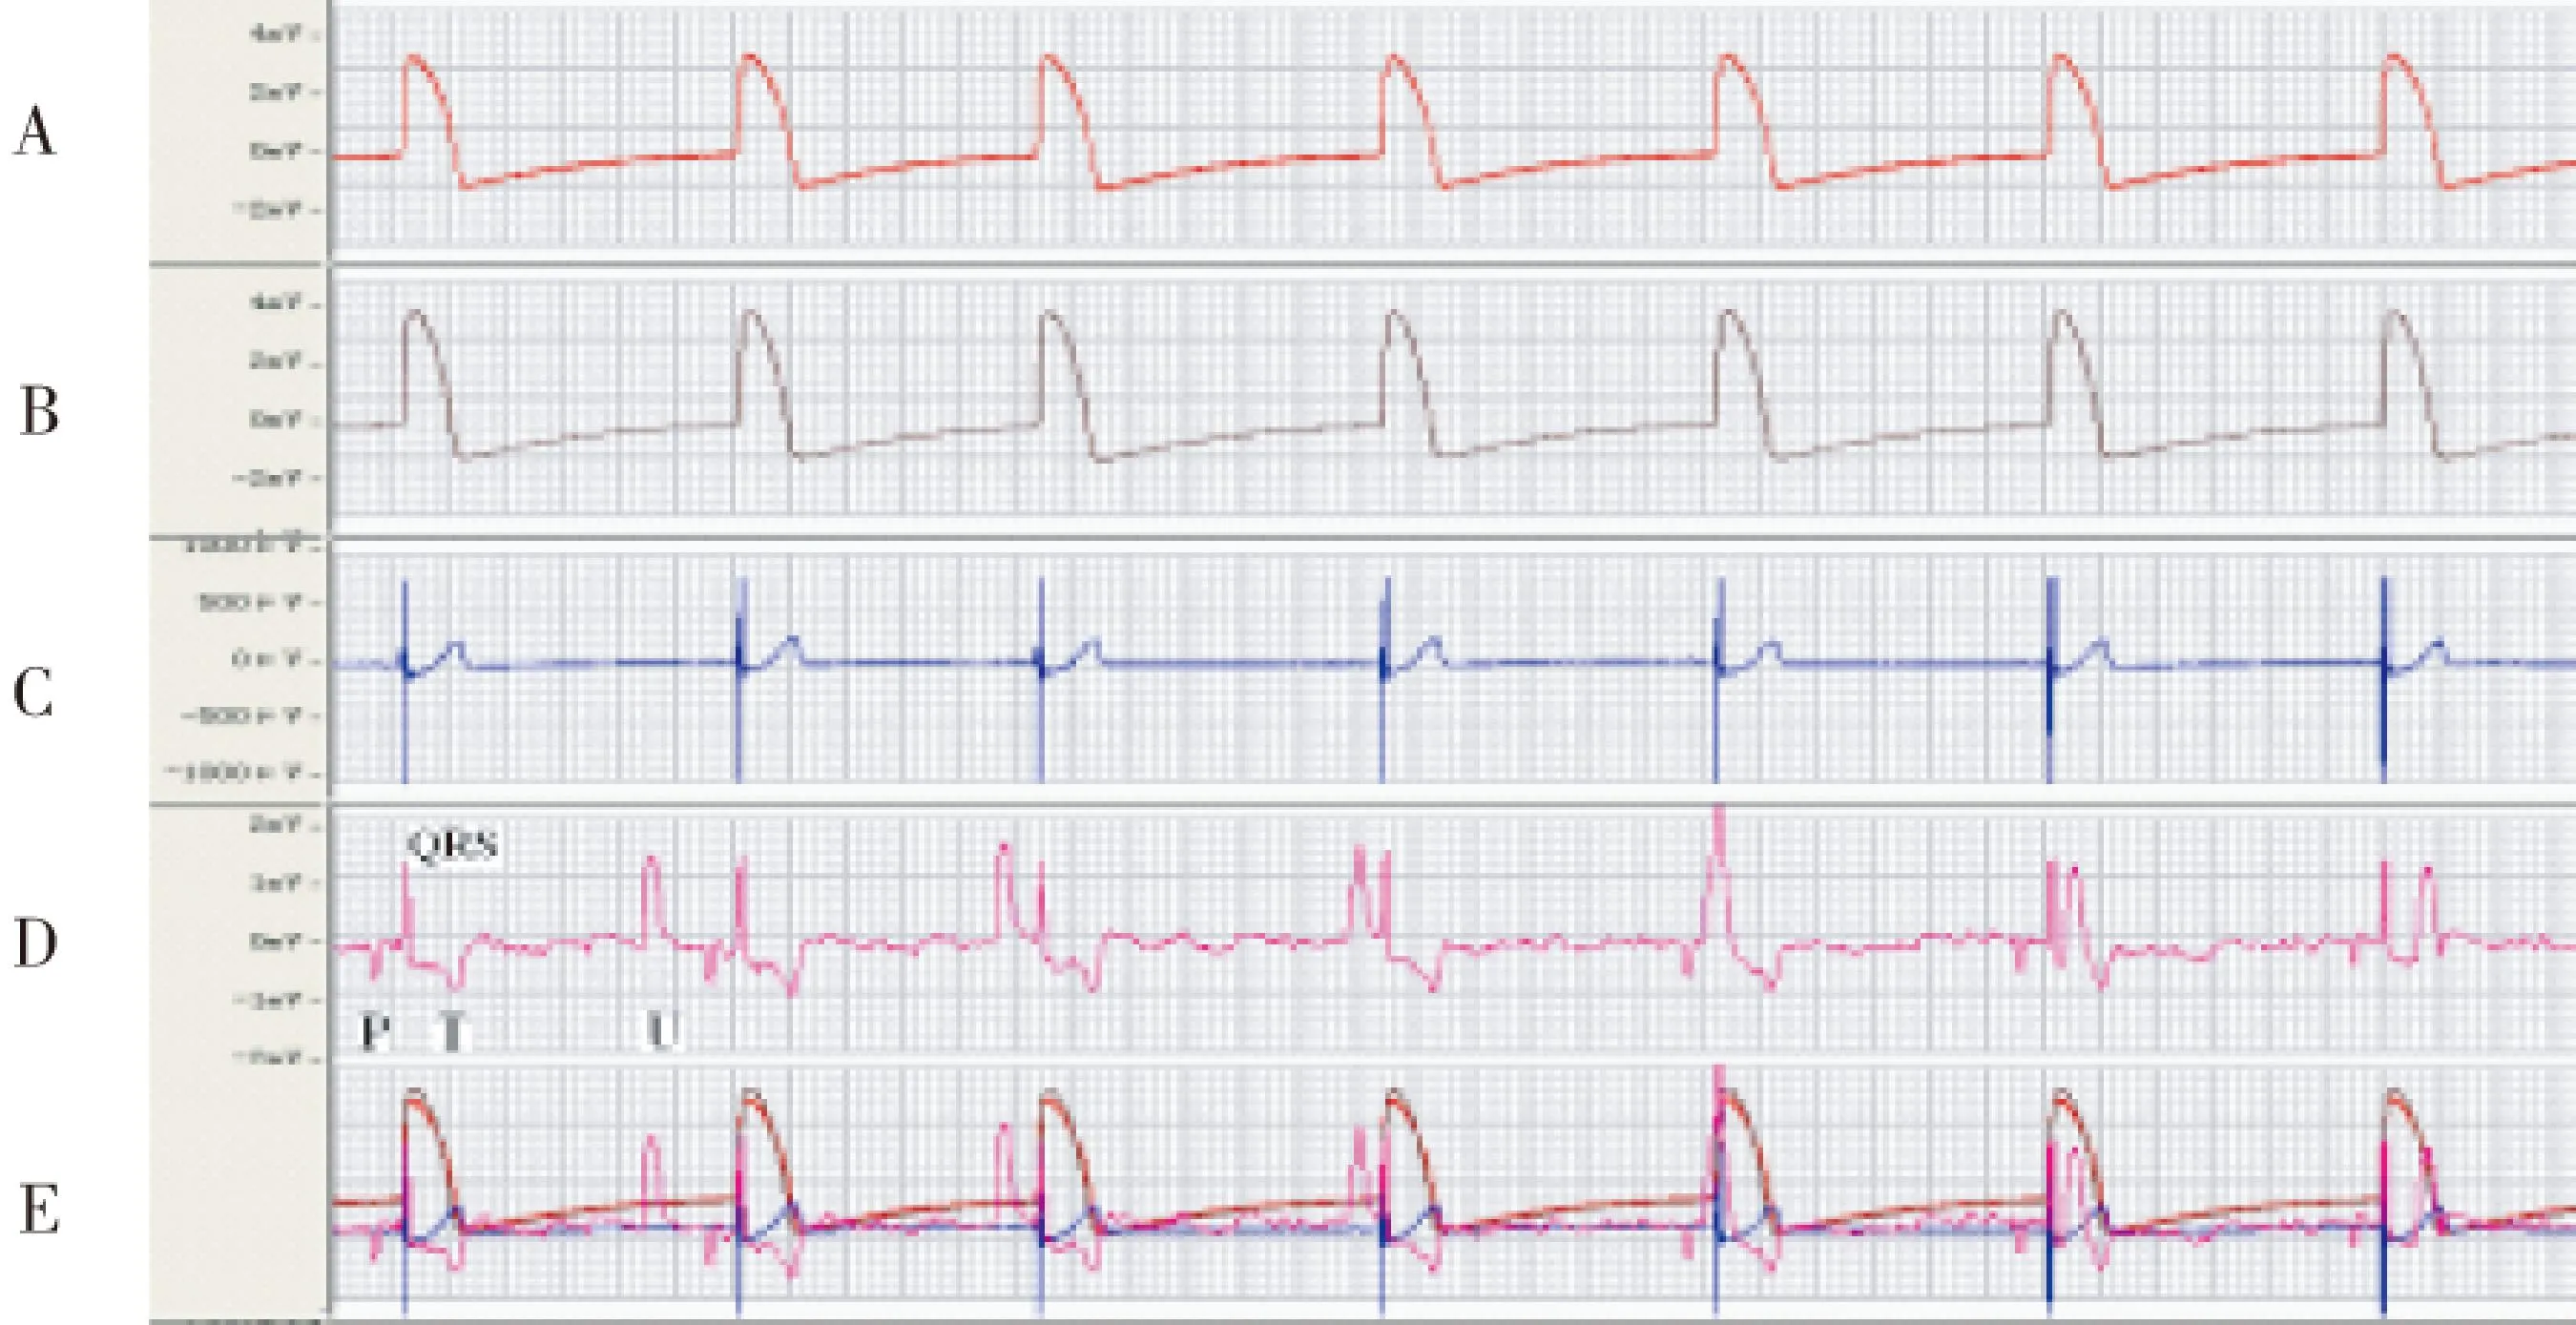
Fig.4 Separating U wave temporally from QRS-T by slowing heart rate to 26 beats/min.(A)Right ventricular MAP. (B)Left ventricular MAP. (C)Left to right transcardiac ECG. (D)ECG fromaortic root region (U wave rate 24/min, voltage 1756 μV). (E)Superimposed recordings A-D. (200 ms/5 mm).
3Discussion
There have been lots of debates on the genesis of U wave.Specifically,the following repolarization or repolarization delay hypotheses have been put forward:(1)Negative afterpotentials in ventricular myocardium[6-7];(2)Repolarization delay of some portions of ventricular myocardium[2,8];(3)Repolarization of the Purkinje system[9-10];and (4)Prolonged repolarization of special myocyte populations with long action potential durations(APD)in deep subendocardium or at midwall of the left ventricle('M cells')[11-13].However,all the above hypotheses lack direct experimental evidence to test their validity and also can not account for all special features of the U wave.Hence,these hypotheses have not yet been firmly established.In addition to the above repolarization delay hypotheses,another hypothesis for U wave generation has been introduced based on the potentials caused by mechanoelectrical coupling or mechanoelectrical feedback during diastolic relaxation[14,15].However,this hypothesis has not received general acceptance.Hence,controversies persist regarding whether the U wave is a repolarization electrical or mechanoelectrical phenomenon.Recently,Schimpf,et al[16].used echocardiographic measurements to discriminate between the hypotheses for the origin of the U wave,showing that the U wave in the short QT syndrome(SQTS)patients coincided with aortic valve closure and isovolumetric relaxation,thus supporting the mechanoelectrical hypothesis.However,Postema,et al[17].have shown that the U wave is associated with IK1-regulated membrane potential differences in the late phase 3 or phase 4 of the cardiac cycle,and,in the IKr↑-patients revealed that the U wave started well before aortic valve closure.The author concludes that this strongly supports the long-lived notion that the U wave is caused by intrinsic potential differences in the terminal part of the action potential,and not with diastolic relaxation.Furthermore,Morita,et al.using an experimental Andersen-Tawil syndrome,reported that the U wave was associated with a delay in the late phase 3 of the action potential[18].Ritsema van Eck,et al[19-20].recently concluded on the basis of their model study that the U wave and the T wave form essentially a continuum of the same repolarization process.However,doubts have been expressed about the validity of this conclusion[21].
There is reason to believe that the characteristics of U wave are not compatible with the ventricular muscle repolarization hypotheses,they still can not account for all special features of the U wave.The U wave seems to appear as an independent wave in the early diastolic period after the second heart sound.There is an equipotential line between T and U.The U wave has a quick rising phase and a slow falling phase[2, 15].The voltage of U wave increases slightly when serum potassium is low.But all of the above U wave features are not coordinated with that of the repolarization wave.For example,T wave has a slow rising phase and a quick falling phase;the voltage of T and Ta wave[22]will decrease under low blood potassium whereas the U wave response is similar to a depolarization wave(such as P wave).
Previous studies did not take into consideration the relationship between U wave and ventricular outflow tract.One part of ventricular outflow tract evolves from some tissues of bulbus cordis,and the stage of bulbus cordis still exists in human embryo.Bulbus cordis is an independent functional unit of excitation and contraction,located at the back of the ventricle in fish and amphibians.There is a delay of excitation conduction from the ventricle to the bulbus cordis in these hearts, and this delay of conduction mainly occurs at the bulbo-ventricular junction.For instance,in the frog's heart the remarkable low conduction velocity(from 1 to 5 mm·sec-1)is found in the narrow junctional area,and some physiological phenomena in this junctional tissue can also be seen in the A-V nodal tissue[23].The phenomenon is similar to atrioventricular delay,so that bulbus cordis has an independent function of excitation and contraction.The excitation of bulbus cordis expresses and forms an independent wave after QRS-T on ECG,which is called the QRSb and Tb(bulbar complex)[24].
Our previous studies have shown that left ventricular outflow tract(aortic vestibule)of guinea-pig and rabbit still contained slow response autorhythmic cells and features of spontaneous excitations[3].The features and ion flows of the autorhythmic cells in ventricular outflow tract were similar to those of sinoatrial pacemaker cells[25-26],and the activities of ventricular outflow tract could also be regulated by automatic nervous system[27].These phenomena indicate that certain tissues of ventricular outflow tract in mammal heart still have electrophysiological features similar to bulbus cordis.These tissues could be excited after ordinary ventricular muscle.Moreover,it has been demonstrated in electrocardiological studies that the last part to be activated is the pulmonary conus and the posterobasal area of the left ventricle[28].The main vector of U wave originates from the last depolarized part of the ventricle,which may be the right ventricular base and the left ventricular base[29].Ventricular outflow tract is located exactly in the basis cordis and may be the last depolarization part of the ventricle.Based on its features,the U wave might be caused by excitation of ventricular outflow tract.In the present study,an independent wave could be recorded on ECG after the end of the left and right ventricular intramural MAP and the T wave(Fig.2).The features of this independent wave had a quick ascending branch and a slow descending branch,and there was also an equipotential line between this independent wave and T wave(Table.1).According to the features and the timing of this wave and its response to low blood potassium,it was inferred that this separate wave was undoubtedly a U wave and it has no relationship with the repolarization of ventricular muscle.The frequency of occurrence of U wave in ventricular outflow tract was higher than that in left-right ventricular wall,whereas the voltage of U wave in ventricular outflow tract was substantially higher than that in ventricular wall(Table.2).The highest voltage of U wave recorded from intra-aortic(near valve)was more than 400 μV(Fig.3),U waves with so high voltage never appeared on transcardiac ECG.Taken together,these results suggest that U wave might be formed by the electric activities of ventricular outflow tract.In addition, when the heart rate was reduced to extremely low values(26 beats/min.),the U wave was completely separated from the T wave as an independent wave and superimposed on the P,QRS or T wave.Moreover,this separate U wave was recorded only on the ECGs of ventricular outflow tract(Fig.4).A previous study demonstrated that slow response autorhythmic cells existed in ventricular outflow tract(aortic vestibule)[3],so it can be inferred that the autorhythmicity of ventricular outflow tract is driven by autorhythmic cells.This autorhythmic activity could break away from the overdrive suppression by sinoatrial node when the sinus rhythm was extremely slow.Although the separation phenomenon was seldomly recorded,the present results further demonstrated that the U wave was neither an intrinsic composition of repolarization,nor a diastolic relaxation.
The U wave coincided with aortic valve closure and isovolumetric relaxation[17].It has been shown that excitation and contraction of tissues in ventricular outflow tract could appeare on the period of isovolumic relaxation.Its function might be related to increased tension of aortic entrance and protected closure of valve.Thus,one may believe that the genesis of U wave has relationship with the electric activities of ventricular outflow tract.Further investigations should be carried out to determine whether the U wave is formed by depolarization(similar to QRSb in bulbus cordis)or by compound potentials of depolarization and repolarization of ventricular outflow tract.This is not based on supposition,in one of our previous study,we found that when the rabbit heart was perfused under low temperature(32 ℃)and the HR was slowed down to about 20 beats/min,an another separate wave after QRS-T could be recorded that was similar to QRSb-Tb of bulbus cordis.Moreover,this separate wave(similar to QRSb-Tb)was recorded only on the ECGs of ventricular outflow tract and its vicinity(Fig.5)[30].

Fig.5ECG of different parts in the rabbit heart (perfused under 32 ℃, HR was slowed down to about 20 beats/min).An another separate wave after P-QRS-T could be recorded that was similar to QRSb-Tb of bulbus cordis in ECG of A,B and C.
(A)Atrium sinistrum(near aortic vestibule ). (B)Aorta ascendens. (C)outflow tract of left ventricular(aortic vestibule). (D)Atrioventricular groove(below the aortic vestibule). (E)The surface of left ventricular. (F)The surface of right ventricular. (unipolar lead, 10 mm/mV, 25 mm/sec).
4Limitations
4.1The MAPs recordings of left and right ventricular muscle used in the preparation were shaped according to literature data[4-5].The difference was that only midmyocardium was recorded and did not take the regional variation of epicardium and endocardium into account.Because it has been demonstrated that there exists the longest repolarization in the cells of midmyocardium(‘M cells’),this might be due to the genesis of U wave[12-14].
4.2It is generally believed that the conditions accentuating the U wave include hypothermia, and bradycardia[11,16].To reduce heart rate and accentuate the U wave,in the present study,we selected a low temperature perfusion,and all results were produced at lowering bath temperature to 35~32 ℃.
4.3Ideally,to prove the electrical activities of ventricular outflow tract theory in the genesis of the U wave,for instance,it should be showed that normal and damage of myocardium in ventricular outflow tract always result in the appearance and disappearance,respectively,of the U wave in the electrocardiogram.Unfortunately,such direct evidence has not submitted in the present study.Further studies should need to be addressed on these points,so as to find evidence either for or against the U wave having electric activities of ventricular outflow tract.
4.4In this study,we used an animal model of the isolated rabbit hearts to study U wave generation,however,the results and conclusion used in human may have some limitations.
5Conclusion
The major findings of the present study were that 1)the U wave appeared after the end of MAPs,and was not related to transmural repolarization of the left or right ventricular muscle,2)both the frequency of occurrence and the voltage of the U waves were significantly higher in outflow tract ECGs compared with transcardiac ECGs,3)the U wave was separated completely from the T wave and superimposed on the P,QRS or T wave in the individual ventricular outflow tract when HR was reduced to 42~25 beats/min.Taken together,these data indicate that U waves may be generated by electrical activity in myocytes of ventricular outflow tract region with evolutionary origin from bulbus cordis rather than ventricular muscle.
References:
[1]Einthoven W.üeber die Deutung des Elektrokardiogramms[J].Arch Ges Physiol,1912,149:65.
[2]Lepeschkin E.Physiologic Basis of the U wave[M].Schlant RC,Hurst J W,eds.Advances in Electrocardiography.New York:Grune and Stratton,1972:431-447.
[3]Chen Y J,Ge F G.A study of automatic activity and morphology of guinea-pig aortic vestibule[J].Acta Physiol Sin (Chinese,English abstract),1994,46(5):458-464.
[4]Franz M R.Method and theory of monophasic action potential recording[J].Prog Cardiovascul Dis,1991,33:347-368.
[5]Franz M R.Current status of monophasic action potential recording:Theories,measurements and interpretations[J].Cardiovascul Res,1999,41:25-40.
[6]Nahum L H,Hoff H E.The interpretation of the U wave of the electrocardiogram[J].Am Heart J,1939,17:585-598.
[7]Lepeschkin E.Genesis of the U wave[J].Circulation,1957,15:77.
[8]Furbetta D,Bufalari A,Santucci F,et al.Abnormality of the U wave and of the T-U segment of the electrocardiogram:The syndrome of papillary muscles[J].Circulation,1956,14:1129-1137.
[9]Hoffman B F,Cranefield P.Electrophysiology of the Heart[M].New York:McGraw- Hill,1960:201-202.
[10]Watanabe Y.Purkinje repolarization as a possible cause of the U wave in electrocardiogram[J].Circulation,1975,51:1031-1037.
[11]Sicouri S,Antzelevitch C.A subpopulation of cells with unique electrophysiological properties in the deep subepicardium of the canine ventricle.The M cell[J].Circ Res,1991,68:1729-1741.
[12]Antzelevitch C,Sicouri S.Clinical relevance of cardiac arrhythmias generated by afterdepolarizations:Role of M cells in the generation of U waves,triggered activity and torsade de pointes[J].J Am Coll Cardiol,1994,23:259-277.
[13]Lazzara R.The U wave and the M cell[J].JACC,1995,26:193-194.
[14]Surawicz B.U wave:Facts,hypotheses,misconceptions and misnomers[J].J Cardiovasc Electrophysiol,1998,9:1117-1128.
[15]Riera A R P,Celso Ferreira C,Filho C F,et al.The enigmatic sixth wave of the electrocardiogram:The U wave[J].Cardiol J,2008,15(5):408-421.
[16]Schimpf R,Antzelevitch C,Haghi D,et al.Electromechanical coupling in patients with the short QT syndrome:Further insights into the mechanoelectrical hypothesis of the U wave[J].Heart Rhythm,2008,5(2):241-245.
[17]Postema P G,Ritsema van Eck H J,Opthof T,et al.IK1 modulates the U-wave Insights in a 100-year-old enigma[J].Heart Rhythm,2009,6:393-400.
[18]Morita H,Zipes D P,Morita S T,et al.Mechanism of U wave and polymorphic ventricular tachycardia in a canine tissue model of Andersen-Tawil syndrome[J].Cardiovasc Res,2007,75:510-518.
[19]Ritsema van Eck H J,Kors J A,van Herpen G.The U wave in the electrocardiogram:A solution for a 100-year-old riddle[J].Cardiovasc Res,2005,67:256-262.
[20]Ritsema van Eck H J,Kors J A,van Herpen G.Dispersion of repolarization,myocardial iso-source maps,and the electrocardiographic T and U waves[J].J Electrocardiol,2006,39:S96-100.
[21]Conrath C E,Opthof T.The patient U wave[J].Cardiovasc Res,2005,67:184-186.
[22]Ge F G,Wang Q S.Effect of potassium ions on atrial T wave(Ta wave)[J].Acta Physiol Sin( Chinese,English abstract),1981,33(4):393-397.
[23]Irisawa H,Hama K,Hama K,et al.Mechanism of slow conduction at the Bulbo-ventricular junction[J].Cir Res,1965,17(1):1-10.
[24]Lepeschkin E.Modern Electrocardiography[M].Vo1.1.Baltimore:Williams and Wilkins,1951:123-125.
[25]Qiu L Y,Chen Y J,Ge F G,et al.An analysis of ionic flow of spontaneous slow action potential of guinea pig aortic vestibule[J].Acta Physiol Sin(Chinese,English abstract),2000,52(4):308-312.
[26]Zhang X Y,Chen Y J,Ge F G,et al.Comparison of the electrophysiological features between the rhythmic cells of the aortic vestibule and the sinoatrial node in the rabbit[J].Acta Physiol Sin(Chinese, English abstract),2003,55(4):405-410.
[27]Zhao L P,Zhang X Y,Chen Y J,et al.Electrophysiological effects of neurotransmitters on pacemaker cells in guinea pig left ventricular outflow tract[J].Acta Physiol Sin(Chinese,English abstract),2005,57(5):593-598.
[28]Durrer D,VanDam R T,Freud G E,et al.Total excitation of the isolated human heart[J].Circulation,1970,41:899-912.
[29]Sakamoto Y,Sano T,Suzuki F,et al.The U vector loop in normal and various abnormal states as studied by the Summation method[J].J Electrocardiol,1978,11(4):331-338.
[30]Ke F K(Ge F G),Feng H L.Comparative studies of the electrocardiogram with particular reference to the genesis of the U-wave[J].Acta Physiol Sin( Chinese,English abstract),1979,31(1):67-77.
[责任编辑:李蓟龙英文编辑:刘彦哲]
一种新思路:U波可能是心室流出道的电活动
葛赋贵,李建东,赵兰平,王雪芳,张晓云,焦宏
(河北北方学院基础医学院生理教研室,河北 张家口 075000)
摘要:心电图上的U波被确认和命名已逾百年,但其成因至今不明。以往的研究者曾提出过多种心肌复极或复极延迟的假说,近年又被认为可能是舒张期心肌松驰时机械电耦联引起的后电位,至今存在持续争议。本文作者在前期对心室流出道电生理特性研究的基础上,在70例离体兔心上通过采用多电极同步记录左、右心室肌的单相动作电位(MAP)和心室流出道与心室壁外表面心电图的方法,观察与分析了U波与心室复极化及流出道电活动之间的关系。结果发现:1)在时空关系上,U波发生在心室肌MAP结束之后,是一个独立的波形,表明其与普通心室肌的兴奋和复极过程并无关系;2)心室流出道部位心电图上出现U波的频率和U波电压均明显高于心室壁;3)当心率降低(26/分)时,个别标本的U波可与T波完全分离,并可叠加在P、QRS或T波上,而这一现象仅发生在心室流出道的心电图上。根据这些结果,并结合U波的波形特征是升支较快、降支缓慢,以及低血K+时波幅略有增高等符合去极波的特点,表明U波与左、右心室肌的复极化过程及心肌松驰并无关系,可能是由具有独立兴奋功能的动脉球演化而来的心室流出道的组织在接续心室肌兴奋时其去极化电位或去极化与复极化的复合电位形成。这是一项原创性研究,文中观点为作者首次提出。
关键词:ECG;U波;主动脉瓣;左心室流出道
基金项目:This work was funded by the National Natural Science Foundation of China(No.30770794)
作者简介:葛赋贵(1938-),河北北方学院基础医学院生理学教授,1962年毕业于南开大学生物系人体及动物生理学专业,多年从事心脏电生理研究,为国际心脏研究学会(ISHR)中国分会会员与中国生理学会终身会员。
中图分类号:R 540.4,R 331
文献标识码:A
DOI:10.3969/j.issn.1673-1492.2016.02.001
来稿日期:2015-12-12