基于动态血糖监测系统的2 型糖尿病患者低血糖发作的相关因素
2021-10-13张雅文张琼月陶珺珺曾芳芳周丽诺杨叶虹
张雅文 张琼月 陶珺珺 苗 青 曾芳芳 周丽诺 杨叶虹△
(1复旦大学附属华山医院内分泌科 上海 200040;2复旦大学附属华山医院北院内分泌科 上海 201900;3上海市代谢重塑与健康重点实验室-复旦大学代谢与整合生物学研究院 上海 200433)
As a common complication of diabetes medications,hypoglycemia was defined as a plasma blood glucose ≤70 mg/dL(3.9 mmol/L)by the American Diabetes Association (ADA) and has always been a key impediment for clinicians to achieve optimal glycemic control for patients[1]. Many studies indicated increased risk of cardiovascular complications and all-cause mortality in diabetic patients with hypoglycemic episodes[2-5].
It is worth noting that the elderly was particularly threatened by hypoglycemic episodes for defective self-care,decreased drug metabolism,reduced renal clearance,and multidrug combinations.In addition,there was a marked“hypoglycemic unawareness”in aged patients with type 2 diabetes mellitus(T2DM)[6-7].Therefore,for those who tend to develop asymptomatic hypoglycemia,detect and prevent hypoglycemic episodes in time is particularly important[8].Continuous glucose monitoring(CGM)can continuously follow interstitial glucose levels,which overcomes the limitations of many traditional metrics and has been demonstrated to be useful for detecting glycemic fluctuations and hypoglycemia,especially for the occurrence of asymptomatic hypoglycemia[9-10].
Hypoglycemic episodes in diabetic patients is commonly thought to be associated with the use of insulin or insulin secretagogues(mainly sulfonylureas and glinides).Other reported risk factors include long duration of diabetes,advanced age,cognitive or renal dysfunction,missed or irregular meals[2]. In this study,we collected general information,laboratory parameters and CGM parameters of the patients.General information included gender,age,body mass index(BMI),duration of diabetes,microvascular complications, comorbidities, diabetes therapy(including insulin treatment and hypoglycemic drugs) and antihypertensive drugs. Laboratory parameters included glucose metabolism parameters,liver and renal function parameters. By using CGM,we aimed to identify associated related factors for hypoglycemic episodes in patients with T2DM.
Materials and Methods
PatientsThe study was performed in the Department of Endocrinology and Metabolism,Huashan Hospital North,Fudan University. The clinical data of the 147 patients who had worn the CGM system(iPro™2;Medtronic,Inc.,Minneapolis,Minnesota,USA)for 5 days in the ward from Dec 2018 to Oct 2019 were collected. According to whether there was an episode of hypoglycemia during the monitoring period,the patients were divided into the non-hypoglycemia group and the hypoglycemic group(a single hypoglycemia episode was defined as a sensor monitoring blood glucose of less than 3.9 mmol/L and lasting for more than 15 minutes).Based on the 1999 WHO diagnostic criteria,T2DM was defined with fasting plasma glucose(FPG)≥7.0 mmol/L,and/or OGTT-2h postload plasma glucose (PPG) ≥11.1 mmol/L,and/or a selfreported previous diagnosis by physicians. The exclusion criteria for patients are as follows:(1)Patients with type 1 diabetes(T1D).(2) Patients with acute hypoglycemia, diabetic ketosis or nonketotic hyperosmolar coma on admission. (3)Patients with infectious diseases,acute coronary syndrome,anemia,or end-stage renal disease. The study protocol was approved by the Medical Ethics Committee,Huashan Hospital,Fudan University(No:2019-568),and all participants have signed the informed consent.
CGM systemThe iPro™2 CGM system used in this study was composed of five parts:glucose sensor,needle aid,digital recorder,data extractor and analysis software. The glucose sensor was mainly composed of a semi-permeable membrane,glucose oxidase and microelectrodes. It was implanted under the skin of the subject’s abdomen through a needle aid,and chemically reacts with glucose in the interstitial fluid of the subcutaneous tissue and generates corresponding electrical signals. The iPro™2 digital recorder (MMT-7741) received and recorded electrical signals through the cable every 10 seconds,and converted the average value of the electrical signals into blood glucose values for storage every 5 minutes. The CGM system used in this study required pre-meal and bedtime venous BG calibration,which were measured by the SMBG device (ACCU-CHEK performa;Roche,Basel,Switzerland). These data can be uploaded to the computer software(CareLink iPro ™ ,MMT-7340)through the iPro™ 2 data extractor(MMT-7742)for automatic calculation and generate dynamic blood glucose monitoring reports. The report was prepared in accordance with the“Guidelines for the Clinical Application of Continuous Glucose Monitoring in China(2017 Edition)”. The mean blood glucose(MBG),standard deviation (SD),coefficient of variation(CV),the differences between maximum and minimum BG levels(ΔBG),mean amplitude of glycemic excursions(MAGE)and the percentage of time in range(%TIR)of BG at <3.9 mmol/L,3.9-7.8 mmol/L,>7.8 mmol/L,3.9-10.0 mmol/L and >10.0 mmol/L were extracted from the reports.During the CGM period,all patients received optimal meals (25 kcal/kg of ideal body weight;60%carbohydrate,15%-20% protein,and 20%-25%fat),and an episode of hypoglycemia was defined as a sensor glucose <3.9 mmol/L for 15 minutes.
Biochemical evaluationHbA1c was determined by high-performance liquid chromatography(BIO-RAD D-10,USA)and expressed as the national glycohemoglobin standardization program (NGSP). The estimated glomerular filtration rate(eGFR)was calculated according to the Chronic Kidney Disease Epidemiology Collaboration (CKD-EPI) formulae[11]. For man:eGFR=141×(SC∕0.9)-0.411(-1.209)×0.993Age(if serum creatinine >0.9 mg/mL).For woman:eGFR=144×(SC∕0.7)-0.329(-1.209)×0.993Age(if serum creatinine >0.9 mg/mL).
Statistical analysisIn this study,the collected data was statistically analyzed by SPSS 25.0 software package. Continuous variables were presented asx±s,or medians[interquartile ranges(IQRs)]. Categorical variables were expressed as numbers /(proportions)[n(% )]. Differences in baseline characteristics and CGM parameters between non-hypoglycemia group and hypoglycemia group were separately analyzed by two-sample independentt-test and Mann-WhitneyUtest for continuous variables,by Pearson’sχ2test for categorical variables. The associations between variables and hypoglycemic episodes were analyzed by Spearman correlation analysis in all samples(including hypoglycemia group and nonhypoglycemia group,n=147). The associations between variables and duration of hypoglycemic episodes were analyzed by Pearson correlation analysis in hypoglycemia group (n=57). Binary Logistic regression analyses were conducted in all samples,univariate Logistic analyses were performed firstly, then followed by multivariate Logistic analyses to identify related factors for hypoglycemia.The signicance level wasP<0.05.
Results
Baseline characteristicsThe blood urea nitrogen(BUN)[6.13(5.05-7.02)mmol/Lvs.5.21(3.95-6.74) mmol/L,P=0.018)],fasting plasma glucose(FPG)[8.22(6.50-10.50)mmol/Lvs.6.41(4.69-8.95) mmol/L,P=0.000], postprandial plasma glucose(PPG)[12.71(9.87-15.34)mmol/Lvs.10.71(8.72-13.33)mmol/L,P=0.030],fasting plasma C peptide[2.21(1.40-3.00)μg/Lvs.1.56(0.90-2.45)μg/L,P=0.007]and the proportion of patients with hypertension(62.22%vs.42.11%,P=0.017)in the non-hypoglycemia group were higher than those in the hypoglycemia group.There was no significant difference in gender,age,body mass index(BMI) , duration of diabetes, microvascular complications,glycated hemoglobin(HbA1c)level,glucose metabolism indicators and lipid metabolism indicators between the two groups. In terms of medication,compared with the hypoglycemia group,the proportion in the use of insulin and insulin analogs was lower in the non-hypoglycemia group(51.11%vs.70.18%,P=0.022). There was no significant difference in the proportion of other hypoglycemic and antihypertensive drugs used in patients of the two groups(Tab 1).
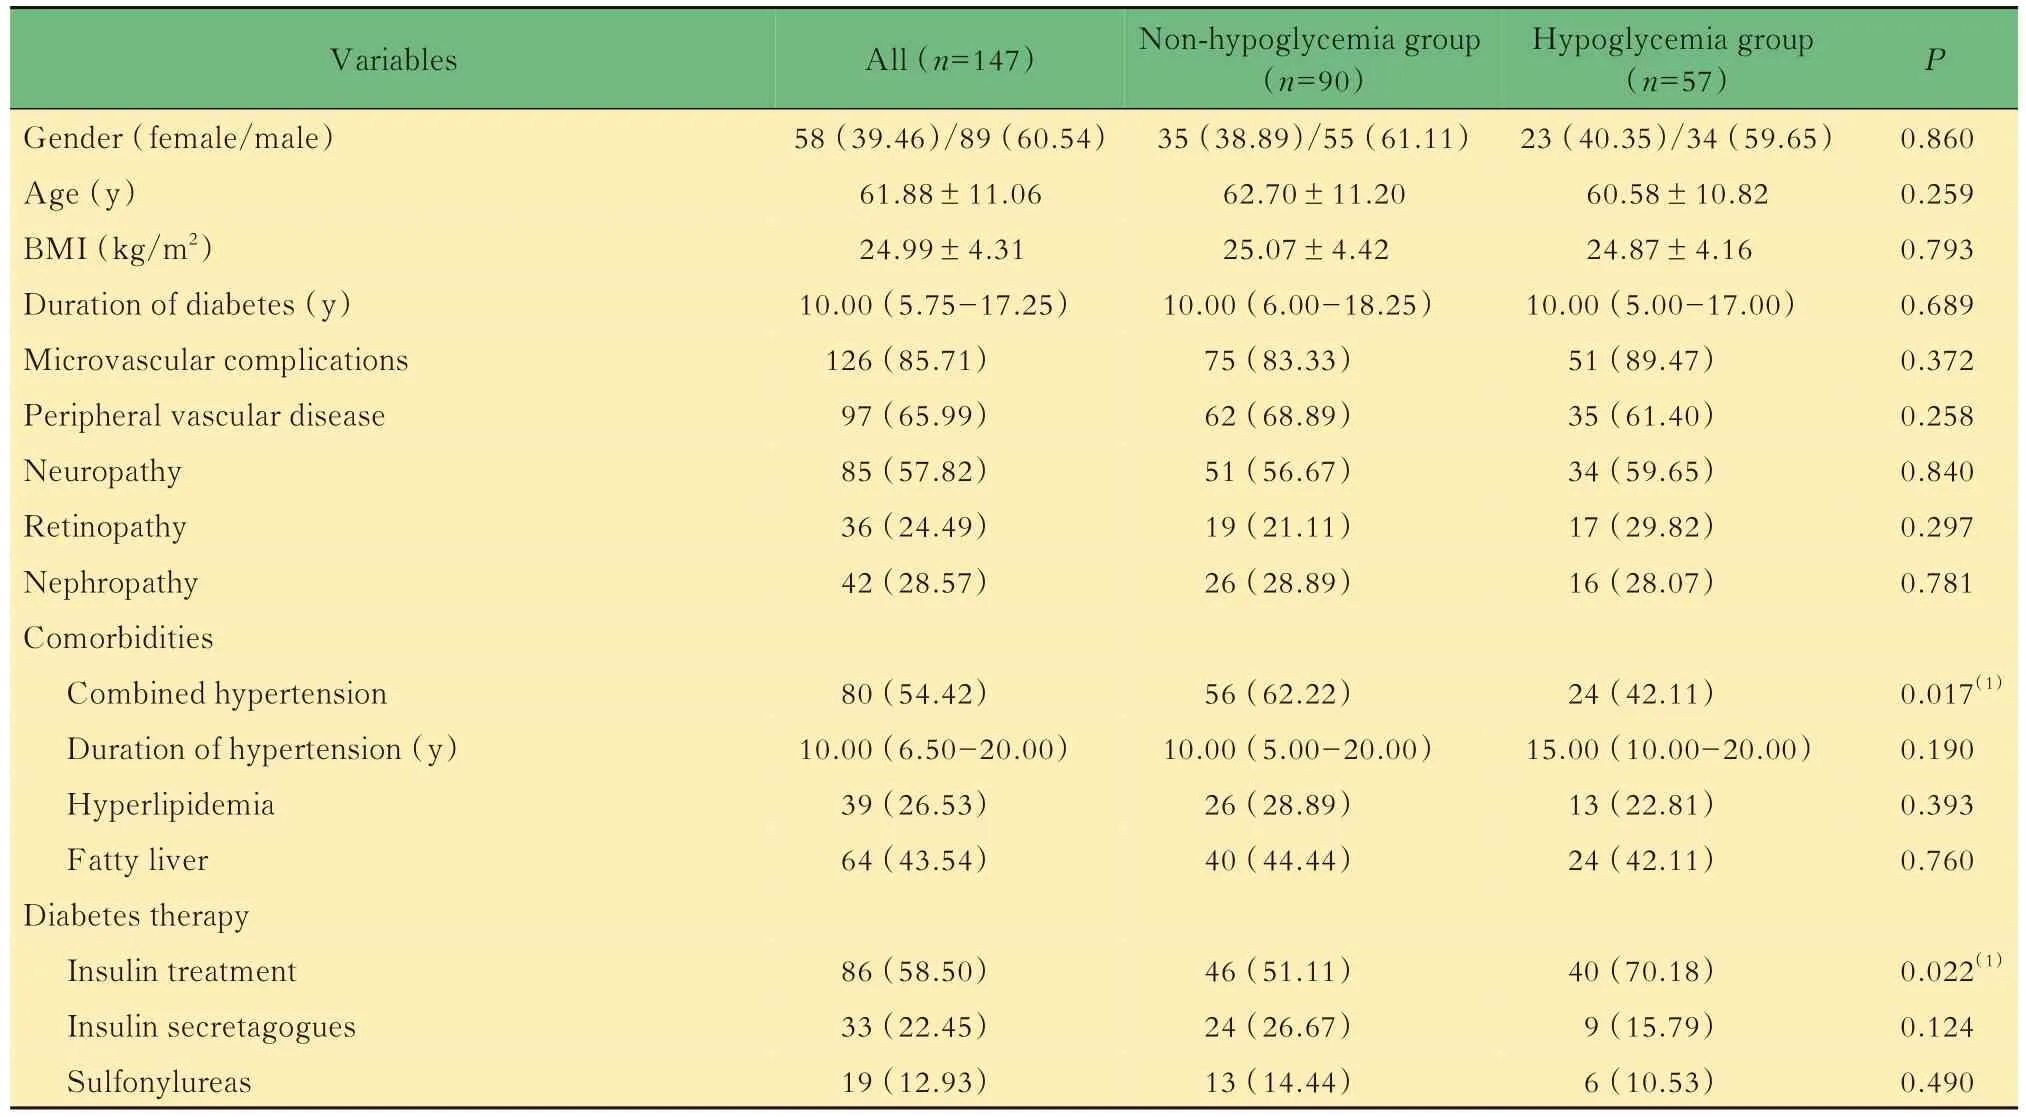
Tab 1 Baseline characteristics of patients
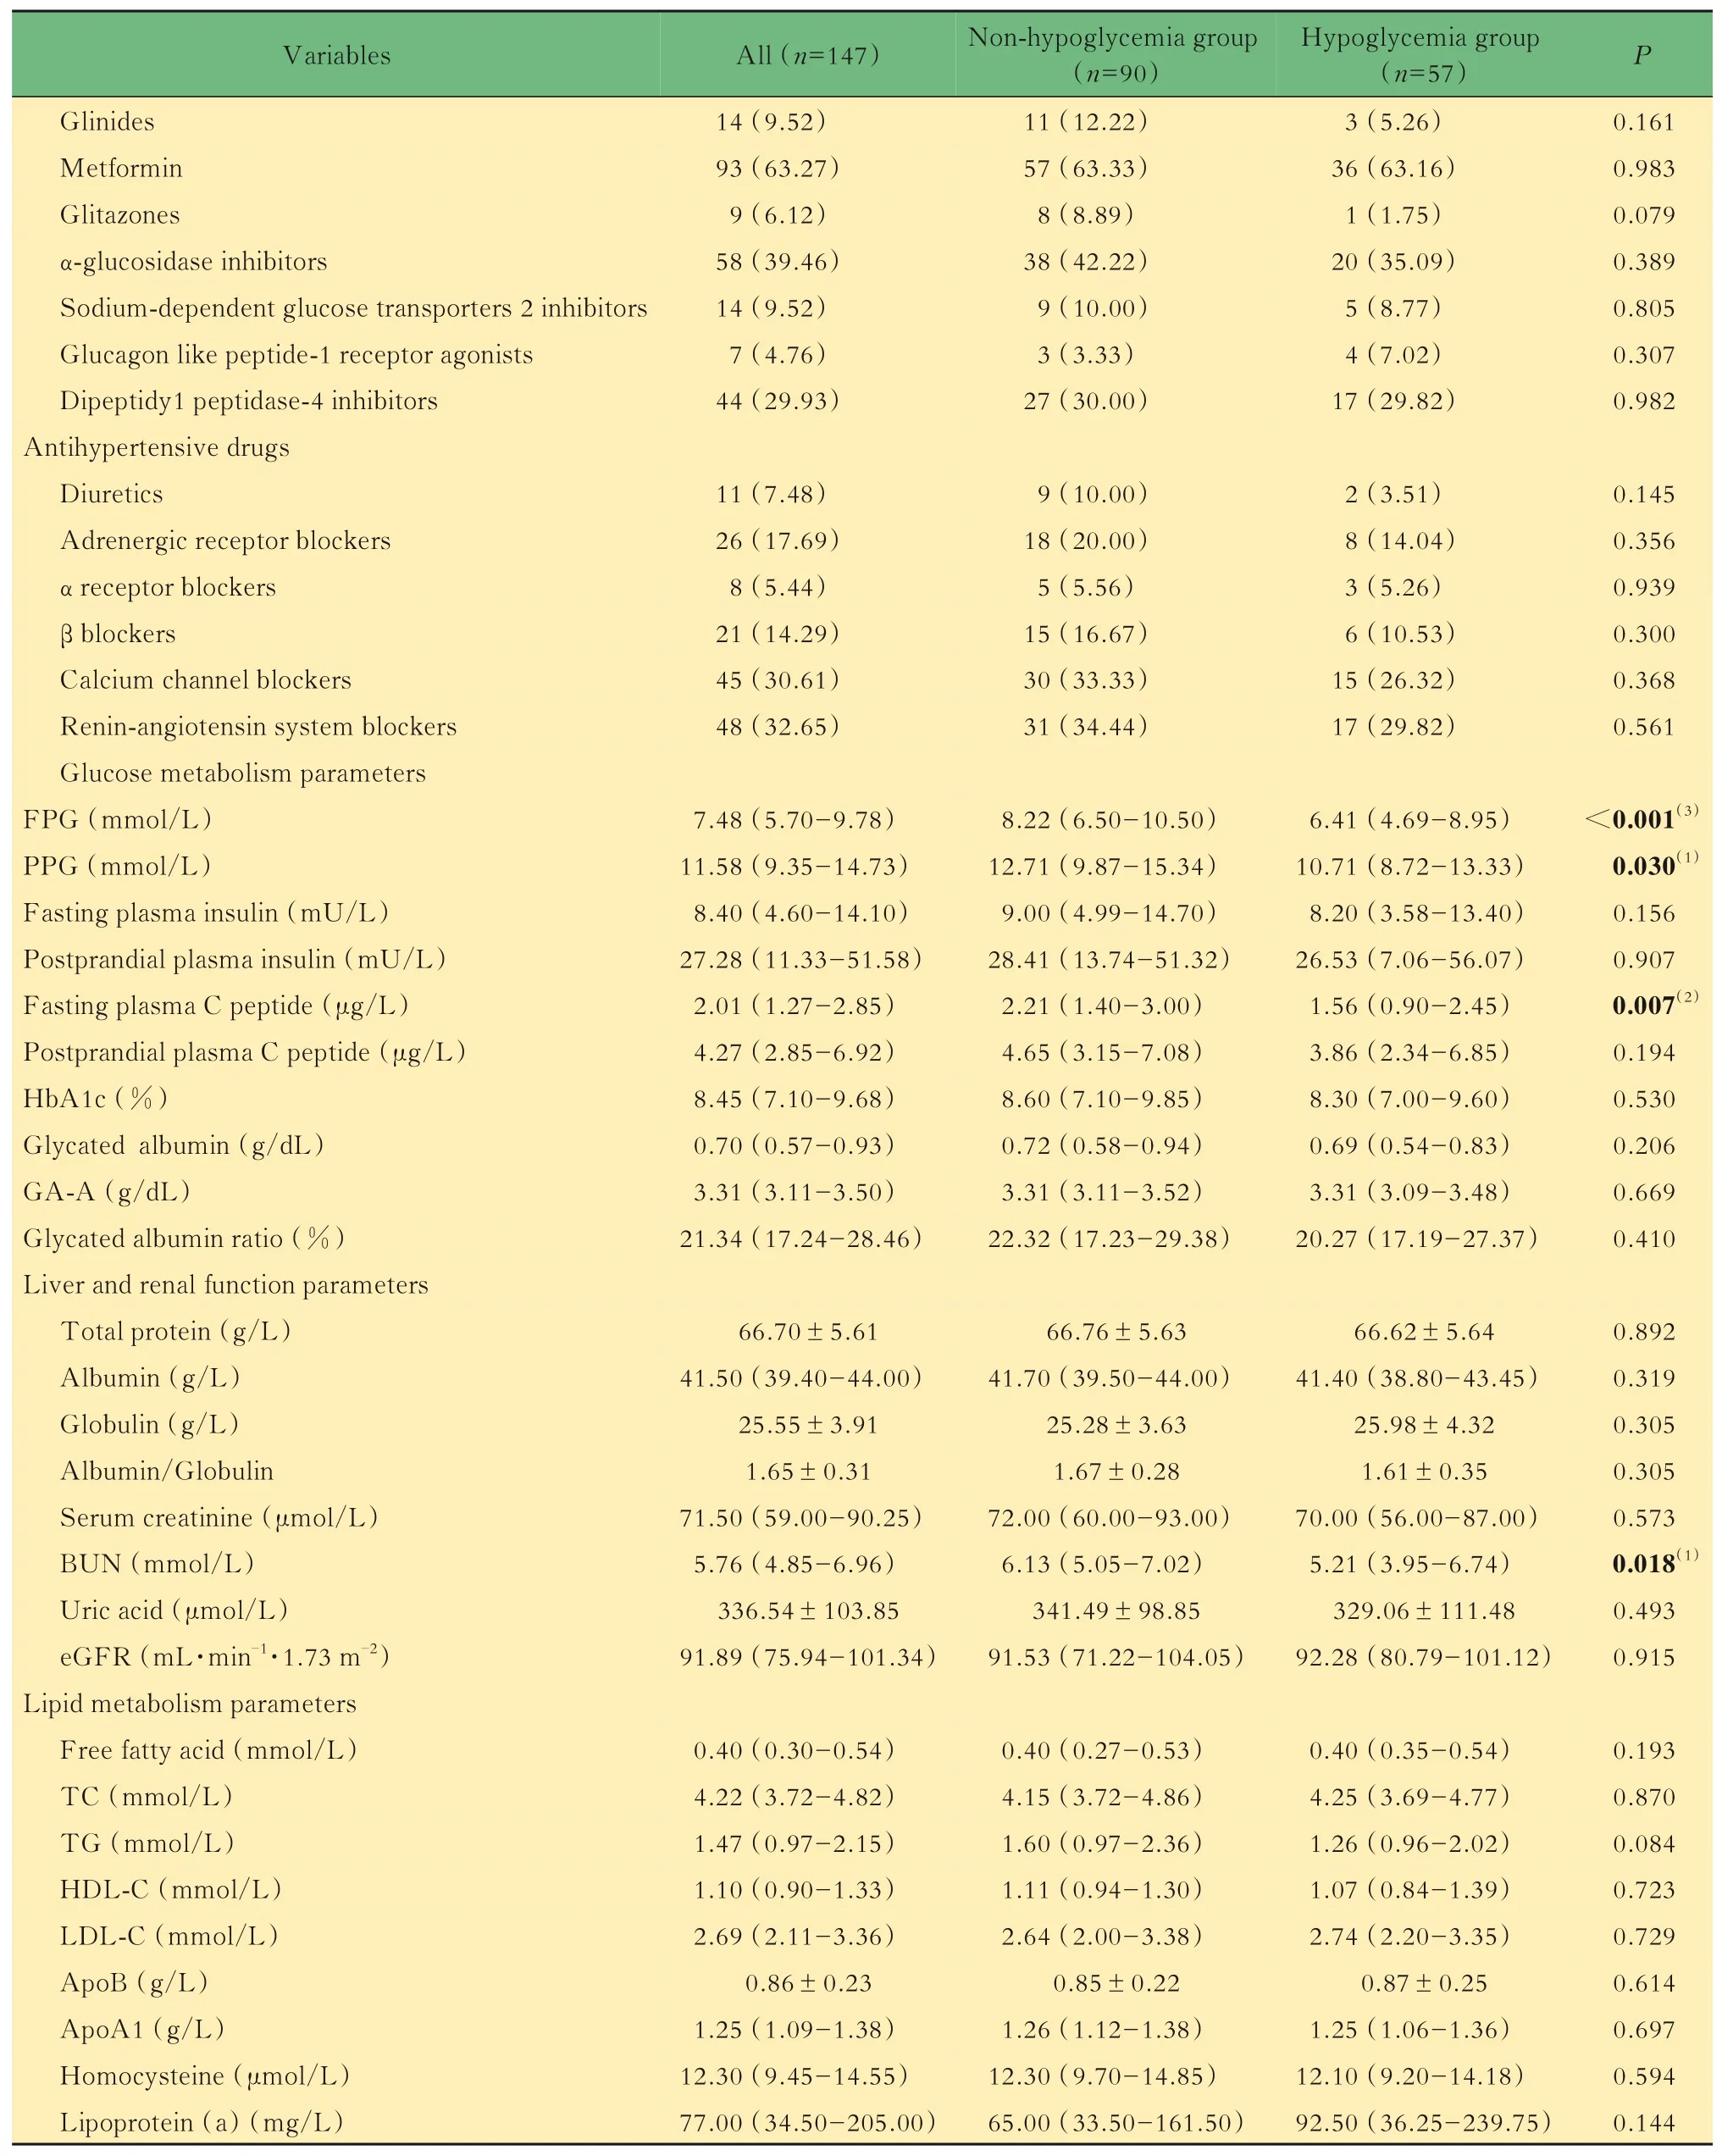
(Continued Tab 1)
Comparison of CGM parameters tween the two groupsCompared with the non-hypoglycemia group,the mean blood glucose(MBG) level,the percentage of time in range(%TIR)of BG at >7.8 mmol/L and >10.0 mmol/L in the hypoglycemia group were lower,while glycemic variability(GV)levels [SD,coefficient of variance (CV),the difference between highest and lowest blood glucose(ΔBG),mean amplitude of glycemic excursions(MAGE)]and %TIR of BG at 3.9-7.8 mmol/L were higher (P<0.05). There was no significant difference in the %TIR of BG at 3.9-10.0 mmol/L between the two groups(Tab 2).

Tab 2 Comparison of CGM parameters between the 2 groups of patients
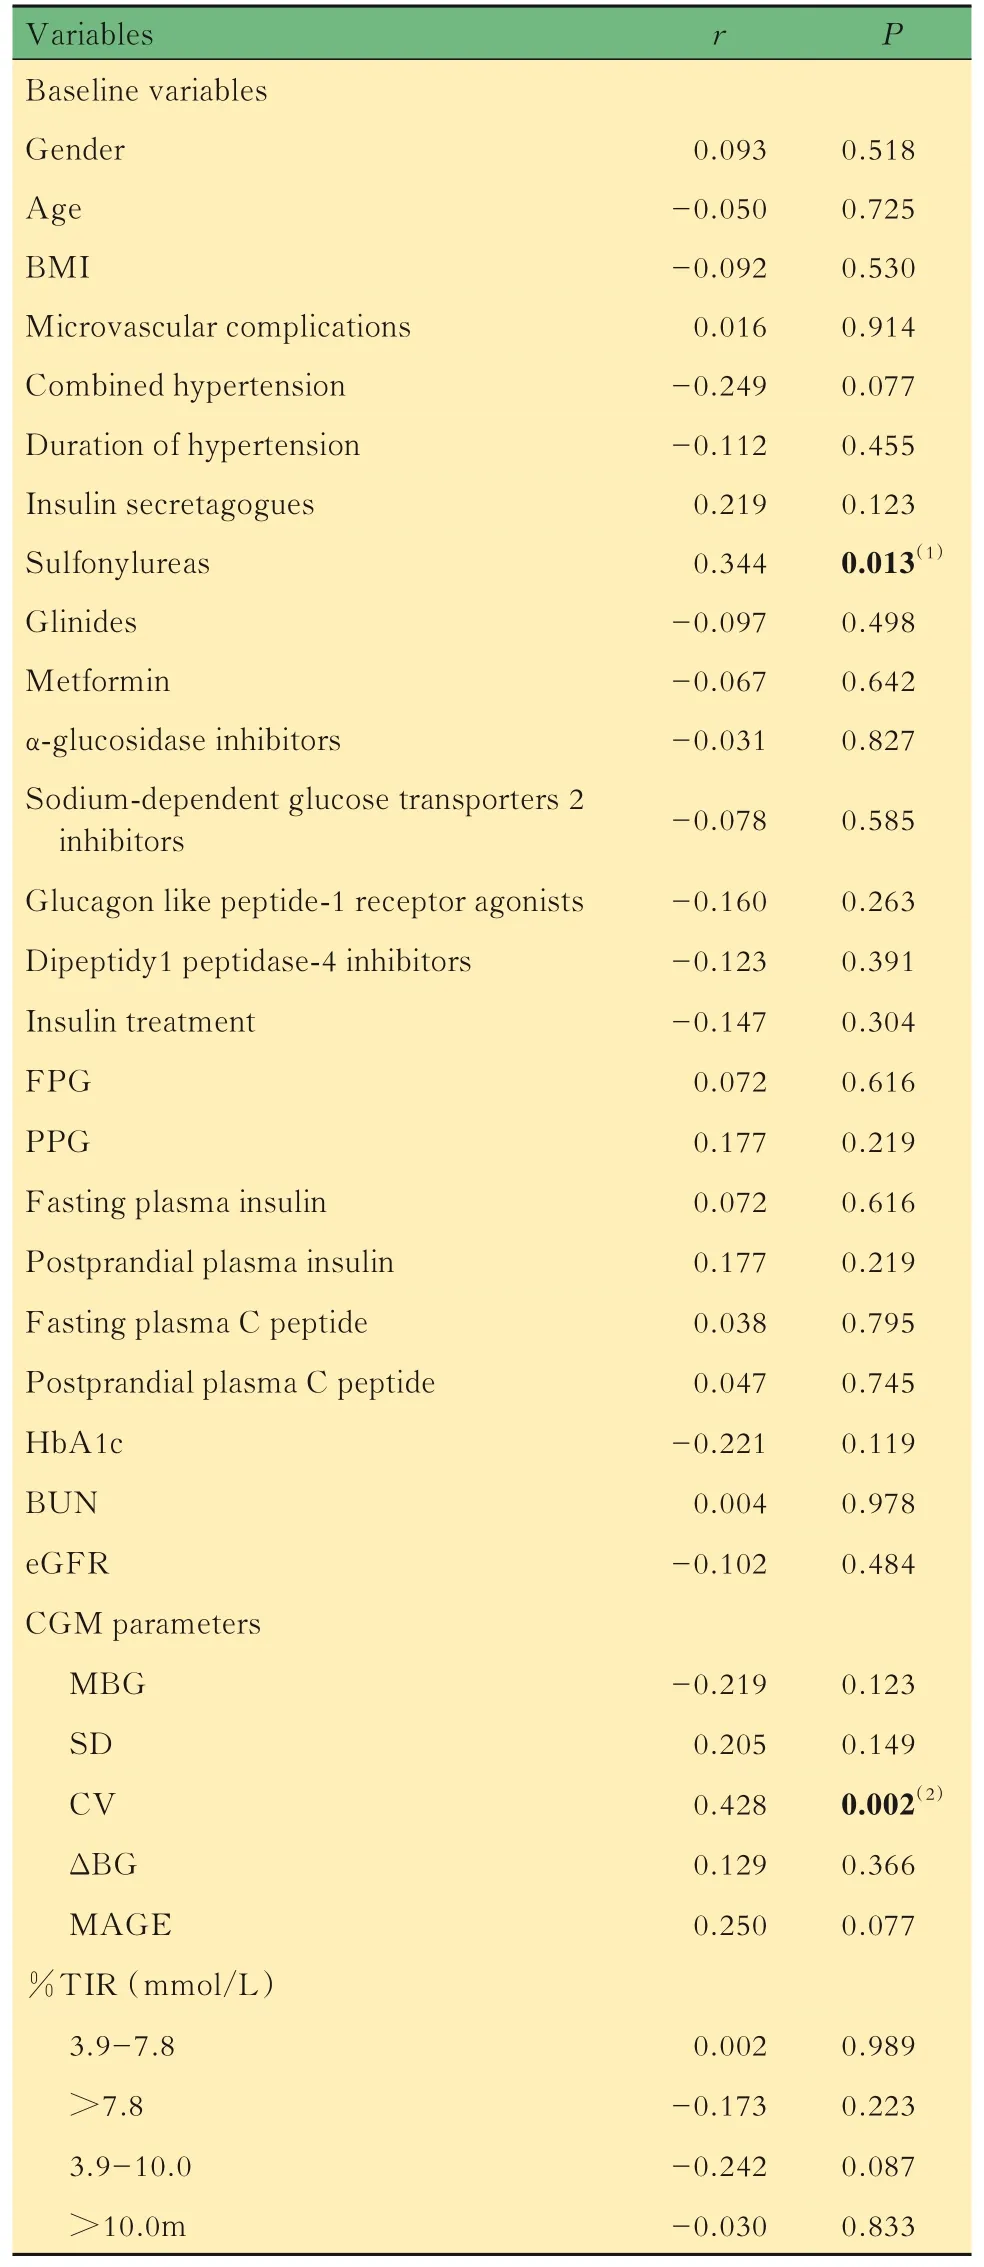
Related factors for hypoglycemiaResults of Spearman correlation analysis showed that for clinical parameters,the FPG,PPG,fasting plasma C peptide,BUN levels and combined hypertension were negatively while insulin treatment were positively correlated with hypoglycemic episodes;for CGM parameters,the MBG and %TIR of BG at >7.8 mmol/L and >10.0 mmol/L were negatively,while GV levels(SD,CV,ΔBG,MAGE)and %TIR of BG at 3.9-7.8 mmol/L were positively correlated with hypoglycemic episodes (Tab 3).Pearson correlation analysis showed that the duration of hypoglycemic episodes was positively correlated with the use of sulfonylureas and CV(%)levels(Tab 4). Univariate Logistic regression analyses showed that lower FPG level(OR=0.810,95%CI:0.709-0.926,P=0.002) , combined hypertension(OR=2.265,95%CI:1.151-4.456,P=0.018),insulin treatment (OR=2.251,95%CI:1.115-4.541,P=0.024)and lower MBG level(OR=0.564,95%CI:0.429-0.740,P<0.001) were related factors for hypoglycemia. After adjustment for FPG,PPG,fasting plasma C peptide,BUN,eGFR,combined hypertension, insulin treatment and MBG,multivariate Logistic regression analyses showed that lower BUN level(OR=0.744,95%CI:0.575-0.963,P=0.025),increased use of insulin treatment(OR=5.549,95%CI:2.047-15.041,P=0.001) and lower MBG level(OR=0.573,95%CI:0.411-0.798,P=0.001)were related factors for hypoglycemia.After adjustment for gender,age,BMI,FPG,PPG,fasting plasma C peptide, BUN, eGFR, combined hypertension,insulin treatment and MBG,the results showed that lower eGFR level(OR=0.973,95%CI:0.950-0.997,P=0.026),increased use of insulin and its analogs(OR=5.732,95%CI:2.017-16.295,P=0.001)and lower MBG level(OR=0.579,95%CI:0.413-0.811,P=0.002) were related factors for hypoglycemic episodes in patients with T2DM(Tab 5).

Tab 3 Associations between variables and hypoglycemic episodes (n=147)
Tab 4 Associations between variables and duration of hypoglycemic episodes (n=57)
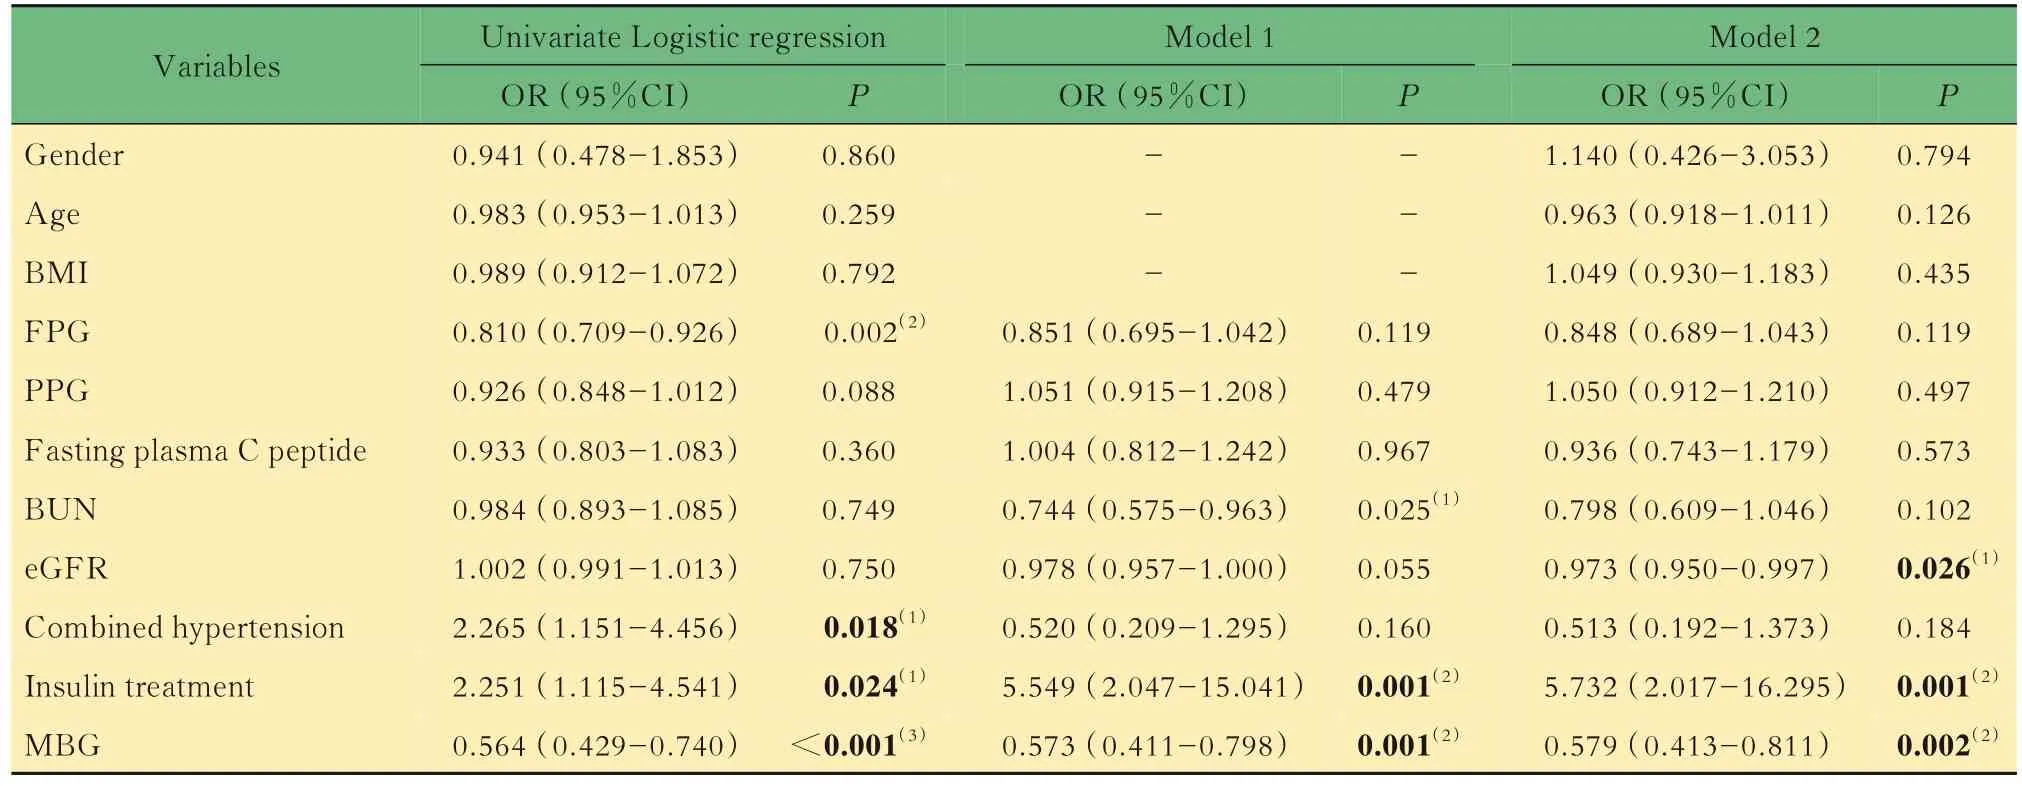
Tab 5 Results of Logistic regression analysis to related factors for hypoglycemic episodes (n=147)
Discussion
Our study demonstrated that lower eGFR levels,increased treatment with insulin and its analogs,lower MBG levels were related factors for hypoglycemic episodes in patients with T2DM.
Hypoglycemic episodes impede optimal glycemic control and create a heavier medical burden.Compared with Western populations who are more inclined to use basal insulin,premixed insulin was reported to be more popular in Asia,which may lead to higher rates of hypoglycemia[12-13].In our study,38.78%(57/147)of the participants with an average age of(61.88±11.06)years had at least 1 episode of hypoglycemia during 5 days of CGM,which was lower than 49.1% reported in another 5-day study using CGM with an average age of(50.2 ±8.2)years[14]. Some studies have validated the risk factors for hypoglycemia.The Outcome Reduction with an Initial Glargine Intervention (ORIGIN) trial reported that risk factors for mild hypoglycemia included the presence of diabetes,higher HbA1c level,younger age and lower BMI;While for severe hypoglycemia,the risk factors were the presence of hypertension,reduced cognitive function,advanced age and higher serum creatinine level[15]. In the PANORAMA cross-sectional study,hypoglycemia was reported to be significantly associated with longer duration of diabetes,treatment with insulin and insulin secretagogues,combined microvascular and macrovascular complications[16]. In another study, combined hypertension and neural complications, higher HbA1c level and rural residence were reported to be associated with the incidence of hypoglycemic coma[17].
Present pharmacological treatments include the insulin and insulin secretagogues, biguanides,incretins[glucagon-like peptide(GLP)-1 receptor agonists and dipeptidy1 peptidase (DPP) -4 inhibitors]and the sodium-dependent glucose transporters (SGLT) -2 inhibitors. Of these medications,insulin and insulin secretagogues were reported to significantly increase the risk of hypoglycemic events[14-15]. In our study,increased treatment with insulin and its analogs were related factors for hypoglycemic episodes in patients with T2DM,and the duration of hypoglycemic episodes was positively correlated with the use of sulfonylureas.
GLP-1 receptor agonists,DPP-4 inhibitors and SGLT2 inhibitors were reported to reduce hypoglycemic episodes substantially,moreover,they have been demonstrated to have antihypertensive effects,which makes them ideal choices for diabetic patients with hypertension[18-20]. It is worth noting that SGLT-2 inhibitors can improve blood glucose control by enhancing urinary glucose excretion,and are recommended to prevent the progression of chronic kidney disease(CKD),hospitalization for heart failure(hHF),major adverse cardiovascular events(MACE)and cardiovascular death in patients with T2DM with CKD[21].
In our study,lower eGFR levels were found to be the related factors for hypoglycemic episodes,which may be related to renal function. Patients with renal dysfunction were reported to at higher risk for hypoglycemia,even at higher risk of hypoglycemiaassociated mortality[22-23]. As an indicator of renal function, the reduced GFR was commonly considered to be associated with increased risk of hypoglycemia[24]. The underlying mechanisms may as follows:on the one hand,poor renal function may delay the clearance of insulin and other glucoselowering drugs,leading to an increased risk of druginduced hypoglycemia;on the other hand,CKD may promote hypoglycemia through decreased kidney gluconeogenesis and blunted counter-regulatory response[25]. Some evidence also suggested that higher BUN level was highly associated with kidney disease progression and increased risk of incident diabetes mellitus[26-27].
Numerous criteria have been proposed to evaluate the quality of overall glycemic control and the severity of hypoglycemia,among which GV is accepted to be a strong predictor of hypoglycemia[28-29].The most popular metrics for GV are CV and SD[30].In our study,CGM parameters of the patients showed that lower MBG and higher GV levels were related factors for hypoglycemia,and the CV levels were positively correlated with the duration of hypoglycemic episodes,which are consistent with Ishikawa,et al[31]who reported that lower average glucose level and higher glucose variability indicated a greater hypoglycemia risk. The %TIR is an emerging metric of glycemic control obtained from CGM,which was reported to be associated with mortality in critically ill patients[32]. %TIR of BG at 70-180 mg/dL was reported to be highly and negatively correlated with %hyperglycemia but weakly correlated with %hypoglycemia[33]. In our study,the %TIR of BG>7.8 mmol/L and >10.0 mmol/L were negatively,while glycemic variability(GV)levels(SD,CV,ΔBG,MAGE)and %TIR of BG at 3.9-7.8 mmol/L were positively associated with hypoglycemic episodes. Logistic regression analysis showed that lower MBG levels were associated with hypoglycemic episodes.
Our findings have some practical clinical significance,which may be supported by several clinical approaches proposed by the International Hypoglycemia Study Group[34]. Firstly,patients using insulin and sulfonylurea should be given comprehensive instruction on recognizing,anticipating and treating hypoglycemia. Secondly,for patients with T2DM,a regimen that does not include insulin or a sulfonylurea should be recommended to reduce hypoglycemia risk. Thirdly,for insulinrequiring patients,a long-acting basal insulin,such as degludec,is more recommended to achieve relatively stable glycemia to reduce rates of severe hypoglycemia. Lastly,for patients with liver and renal dysfunction, or those on insulin or sulfonylureas,glycemic targets should be shifted upwards.
There are a few limitations in our study.A major limitation of our work is that it was a retrospective study,so the causal relationship between the related factors and hypoglycemic episodes cannot be accurately determined. Secondly,it is a single-center study with small sample size,so we defined hypoglycemia according to the presence or absence of an episode of sensor glucose <3.9 mmol/L for 15 minutes and did not conduct further stratification studies based on the severity of hypoglycemia or make a strict division of symptomatic hypoglycemia and asymptomatic hypoglycemia. Thirdly,the effects of drug dosages and multi-drug combinations cannot be ruled out when investigating drug effects.
作者贡献声明张雅文 研究设计,论文撰写,数据收集和分析。张琼月 研究设计,文献调研,数据分析,论文修订。陶珺珺,苗青,曾芳芳数据收集、保存和整理。周丽诺,杨叶虹 获取资助,监督指导,论文修订。
利益冲突声明所有作者均声明不存在利益冲突。