Chemistry and environmental significance of aerosols collected in the eastern Tianshan
2017-11-17XiaoYuZhangShengJieWangXinZhangPingZhouShuangJinZhongQinLiNozomuTakeuchi
XiaoYu Zhang , ShengJie Wang , Xin Zhang , Ping Zhou , Shuang Jin ,ZhongQin Li ,, Nozomu Takeuchi
1. State Key Laboratory of Cryospheric Sciences, Northwest Institute of Eco-Environment and Resources, Chinese Academy of Sciences, Lanzhou, Gansu 730000, China
2. College of Geography and Environment Science, Northwest Normal University, Lanzhou, Gansu 730070, China
3. Department of Earth Sciences, Graduate School of Science, Chiba University, 1-33, Yayoicho, Inage-ku, Chiba-city,Chiba 263-8522, Japan
Chemistry and environmental significance of aerosols collected in the eastern Tianshan
XiaoYu Zhang1*, ShengJie Wang2, Xin Zhang2, Ping Zhou1, Shuang Jin1,ZhongQin Li1,2, Nozomu Takeuchi3
1. State Key Laboratory of Cryospheric Sciences, Northwest Institute of Eco-Environment and Resources, Chinese Academy of Sciences, Lanzhou, Gansu 730000, China
2. College of Geography and Environment Science, Northwest Normal University, Lanzhou, Gansu 730070, China
3. Department of Earth Sciences, Graduate School of Science, Chiba University, 1-33, Yayoicho, Inage-ku, Chiba-city,Chiba 263-8522, Japan
Aerosol samples were collected at altitudes from 584 m a.s.l. to 3,804 m a.s.l. at seven sites of the eastern Tianshan. The occurrence, distribution, and possible sources of 47 trace metals-including alkali metals and alkali earth metals, transition metals, lanthanoids, and heavy metals-were investigated. It was found that four sampling sites (Shuinichang,1,691 m a.s.l.; Urumqi City, 809 m a.s.l.; FuKang Station, 584 m a.s.l.; and Bogeda Glacier No. 4, 3,613 m a.s.l.) were contaminated mainly by heavy metals. Other three high-altitude sites (Urumqi Glacier No. 1, 3,804 m a.s.l.; WangFeng road-maintenance station, 3,039 m a.s.l.; and Tianshan Glaciology Station, 2,135 m a.s.l.) were not polluted. The aerosol particles were clustered into two dominant types: crust-originated particles and pollution-derived particles. Aerosols from UG1, WF, and TGS were characterized by crust-originated particles such as clay, plagioclase, dolomite, alkali feldspar,and biotite; while those from SNC, Urumqi, FK, and BG4 were characterized by high content of Cl-rich particles, S-rich particles, and soot. The backward-trajectories results indicated that air masses arriving at SNC, Urumqi, FK, and BG4 were identified as the more polluted source, when compared to the short-range air mass transport from the North to UGI and WF. Relatively lower altitude, as well as terrain blocking, might be another important reason for the gradient difference in pollution influence among these seven places in the Urumqi River Basin.
heavy-metal pollution; aerosols; central Asia
1 Introduction
Atmospheric pollution in China, especially in metropolises, has become significantly heavier during the past three decades, with the rapid economic development of industrialization and urbanization (Tan et al.,2013). A great deal of atmospheric pollution research has focused on the middle and eastern parts of China(Lu et al., 2008, 2013; Xiao et al., 2013; Huang et al.,2014; Jiang et al., 2014; Shen et al., 2014; Wei et al.,2014; Yin et al., 2014; Zhang et al., 2016), while the mountain regions in western China have received little attention because of their geographical remoteness (Sexton et al., 1984; Borbon et al., 2002; Guo et al., 2004; Li et al., 2014). However, studies have shown that long-range transport of surface emissions and dust storms originating from central Asia could be lifted up into the free troposphere and transported eastward on a hemispheric scale, impacting eastern China, North Korea and South Korea, Japan, and also the United States (Fang et al., 1999; Jaffe et al., 1999;Zhang et al., 2006; Han et al., 2008; Zhang et al.,2008; Liu et al., 2009). Regional air pollution study of mountains in western China, therefore, will be a necessary supplement to existing global atmosphere-quality research.
Aerosols collected from Tianshan regions provided an opportunity to study the influence of anthropogenic pollution on this remote area, a topic that has been debated over the past two decades. The Tianshan ranges, located at the center of the arid and semi-arid regions of central Asia, extend over Xinjiang in China, Kirghizstan, and Kazakhstan, for a total length of 2,500 km, and contain many of the world's inland glaciers. Terrestrial dust has been believed by Belikova et al. (1984), Wake et al. (1990), Williams et al. (1992), Sun et al. (1998), Kreutz et al. (2001),Lee et al. (2003), Olivier et al. (2003), and Zhao et al.(2011) to be the main source of the major ions in Tianshan mountain glaciers, suggesting that anthropogenic pollution from surrounding cities and industrial areas has seriously enhanced the concentration of chemical species in this area. Obviously, the diametrically opposed results were due to sampling sites that were upwind or downwind of anthropogenic pollution sources. However, no data has been reported so far based on multi-points gradient sampling including both upwind and downwind sites in this mountain region to reflect the air quality exhaustively; and using only some common chemical elements found in snow or aerosols to deduce the anthropogenic pollution extent is definitely insufficient.
In this research, aerosol field sampling at seven places in the Urumqi River and Sigong River basins was conducted for the first time along an altitude gradient over the eastern Tianshan, with elevations from 584 m to 3,804 m above sea level. In total, 47 trace elements were analyzed to gain comprehensive insight into the long-distance transport of aerosols in the free troposphere and the distribution, as well as the evolution, of anthropogenic pollutions along an altitude gradient in mountainous areas-pollution that has potentially significant impacts on regional and global climate.
2 Experimental
2.1 Sampling site characteristics
Seven sampling sites (Figure 1) were selected in the Urumqi River and the Sigong River basins, where the weather is controlled by the Mongolian high-pressure system all the year around, with the westerly jet stream prevailing across the mountainous areas. The sampling sites were Urumqi Glacier No. 1 (UG1), the WangFeng road-maintenance station (WF), the Tianshan Glaciology Station (TGS), Shuinichang (SNC),Urumqi City (Urumqi), the FuKang Station (FK), and Bogeda Glacier No. 4 (BG4). Five sites (UG1, WF,TGS, SNC, and BG4) are located in mountains and valleys, while Urumqi and FK are located in urban areas. Glacier BG4 was a typical site downwind of FK, according to the westerly jet stream. These seven sites could represent the different anthropogenic influences throughout the Urumqi River and Sigong River basins in the Tianshan. Details of the sampling sites are described below (Table 1).
Aerosol samples were recovered on Zefluor filters (2.0-μm pore size, 47 mm, Pall Life Sciences) using a 12-V diaphragm pump powered by solar cells,thereby avoiding any contamination from a power generator. Filters were loaded in the field and mounted face down about 2.5 m above the ground surface.The sampling period for each aerosol sample was 4 h.The air volume was converted into standard conditions according to the local ambient conditions. After the sampling period, the filters were removed from the filter holder and placed into clean, airtight plastic containers and stored at 4 °C until analysis. All samples were collected in the autumn of 2012, within a period of just a few days, meaning that possible seasonal influence can be ignored; therefore, we would like to consider the seven sampling sites' element concentration together in the discussion.
2.2 Chemical analysis
The collected aerosol filters were placed in a high-pressure Teflon vessel for digestion, using 2 mL of mixed solution (1.5 mL concentrated HNO3and 0.5 mL step). Subsequently, the samples were digested in an oven for 4 h at 190 °C. The solution was heated to 150 °C after cooling, another 0.5 mL HNO3was added to the residue, and the sample was further heated on a hot plate at 170 °C for 4 h. This procedure for digestion was repeated twice. In each digestion batch (27 samples), a reagent blank was also used to check the sample-handing processes. A total of 68 elements were measured by Inductively Coupled Plasma-Mass Spectrometry (ICP-SFMS, Element,Bremen, Germany) in a 1,000-class clean room at the State Key Laboratory of Cryospheric Sciences, Cold and Arid Regions Environmental and Engineering Research Institute (Northwest Institute of Eco-Environment and Resources), Chinese Academy of Sciences.
Elemental concentrations were quantified using external calibration standards (AccuTrace Reference Standard). A check standard was analyzed after the initial calibration and after every 10 samples. The method's detection limits were listed as follow in Table 2. For precision, the corresponding RSD values of all element concentrations measured in the reference material were less than 5%. The final concentrations were corrected with reagent and filter blanks.
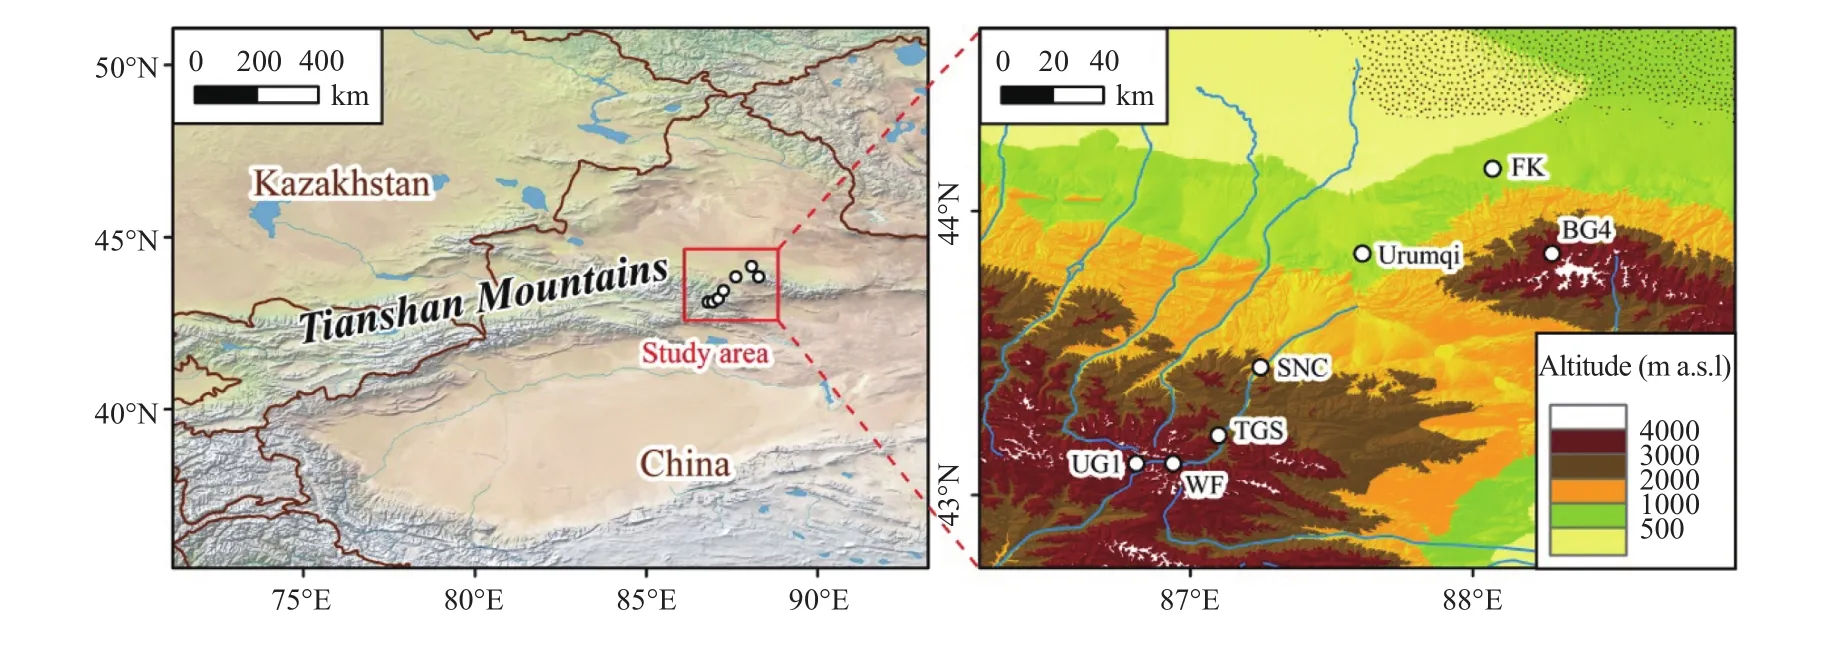
Figure 1 Map showing the location of the sampling sites and the surrounding geographic environment(The sampling sites' details are shown in Figure 6)

Table 1 Details of the sampling sites
Individual particles were analyzed using a Field Emission Scanning Electron Microscope(JSM-6701F) equipped with an energy-dispersive X-ray spectrometer (EDX/EDS). A section of each filter was cut and mounted onto the electron microprobe stub and coated with a thin gold film for a higher-quality, secondary electron image. Operating conditions were the following: accelerating voltage =5~10 kV; spectral acquisition times = 60 s.
3 Results
3.1 General characteristics of trace elements
Table 2 describes the average concentrations(μg/m3) of the 47 selected elements at the seven sampling sites during the observation period. The daily average concentrations of the 47 selected elements ranged widely, from 0.0003 to 24.447 μg/m3.
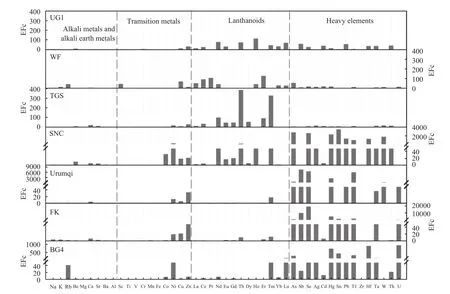
Based on the standard periodic table and relevant chemical properties, the elements analyzed can be grouped into four categories (Figure 2): (1) alkali metals and alkali earth metals: Na, K, Rb, Be, Mg,Ca, Sr, Ba, and Al; (2) transition metals: Sc, Ti, V, Cr,Mn, Fe, Co, Ni, Cu, and Zn; (3) lanthanoids: La, Ce,Pr, Nd, Sm, Eu, Gd, Tb, Dy, Ho, Er, Tm, Yb, and Lu;and (4) heavy elements: As, Sb, Se, Ag, Cd, Hg, Sn,Pb, Tl, Zr, Hf, Ta, W, Th, and U.
Alkali metals and alkali earth metals. The alkali metals and alkali earth metals showed higher concentrations than the other categories. This category showed up as 4 to 155 times higher in Urumqi and FK, as compared to UG1, WF, TGS, SNC, and BG4 (Figure 2).
Transition metals. The transition metals accounted for about 9.2% of the total concentration. Transition metals showed up as 15 to 443 times higher in Urumqi and FK, as compared to UG1, WF, TGS,SNC, and BG4 (Figure 2). Among the transition metals, the Fe content was found to be the highest at these seven sampling sites, with an average concentration of 3.577 μg/m3.
Lanthanoids. The lanthanoids were found to be the lowest in concentration in the air mass.Lanthanoids at TGS showed up as 3 to 13 times higher, as compared to UG1, WF, SNC, Urumqi, FK, and BG4 (Figure 2).
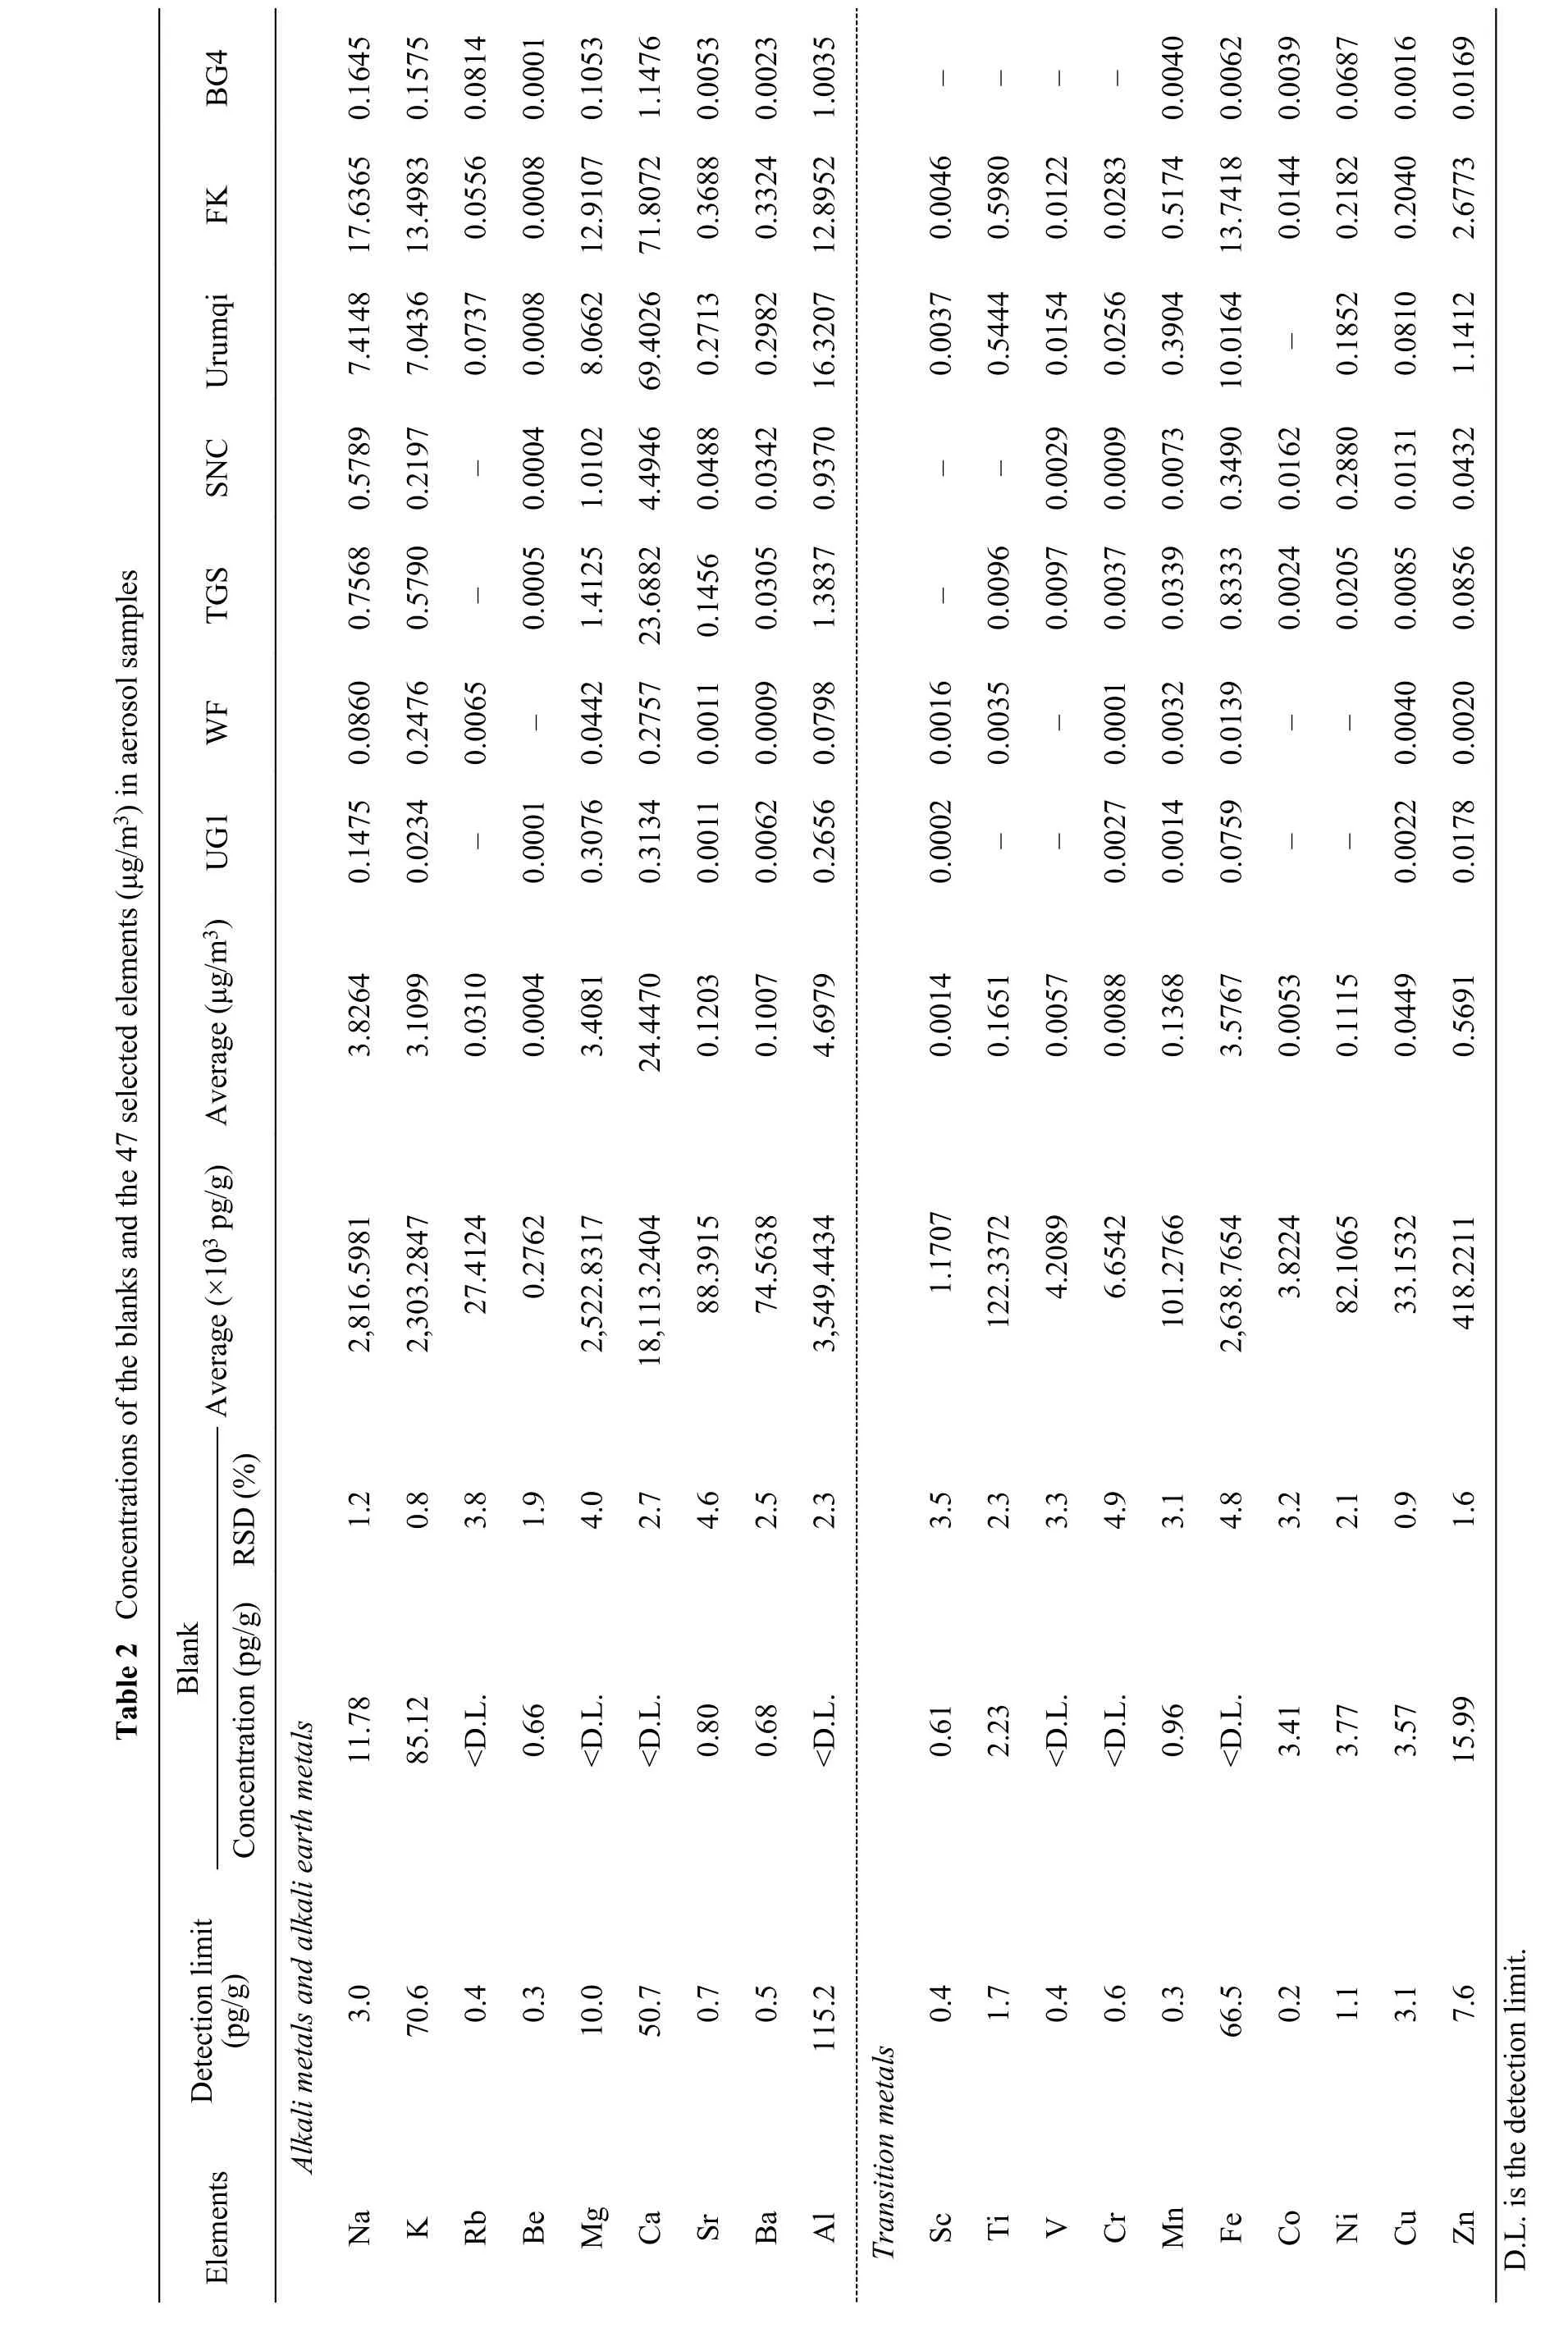
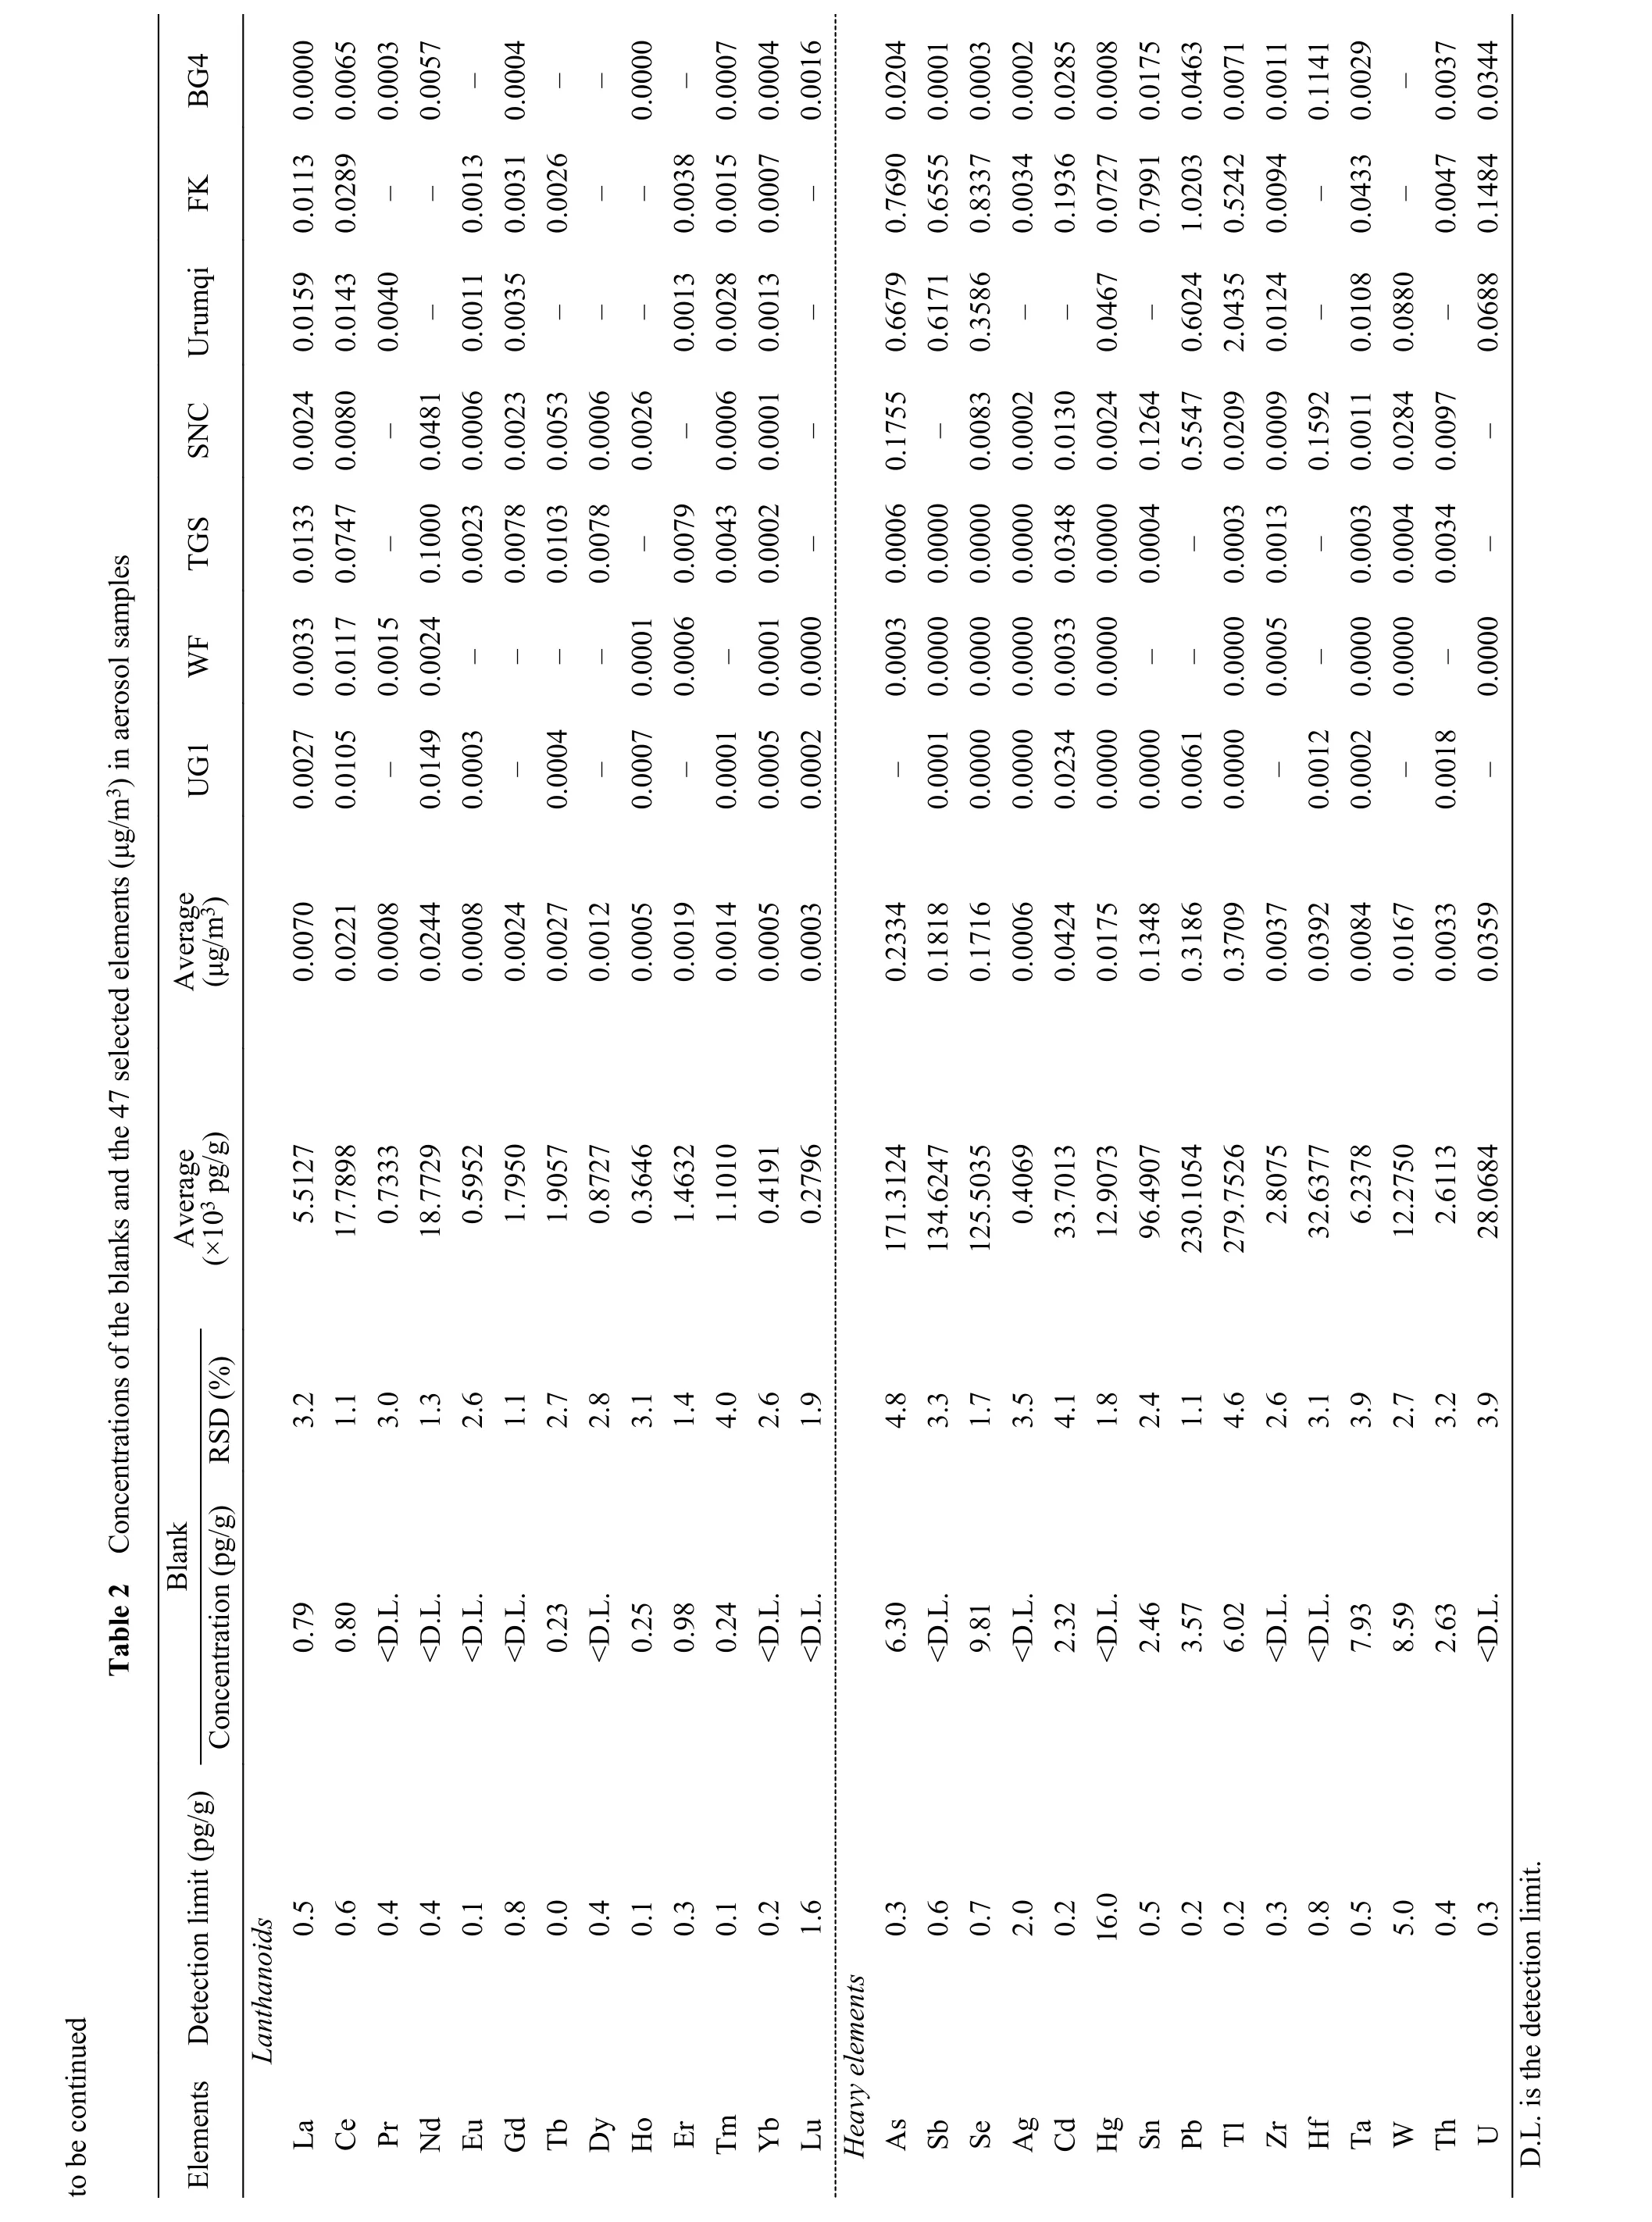
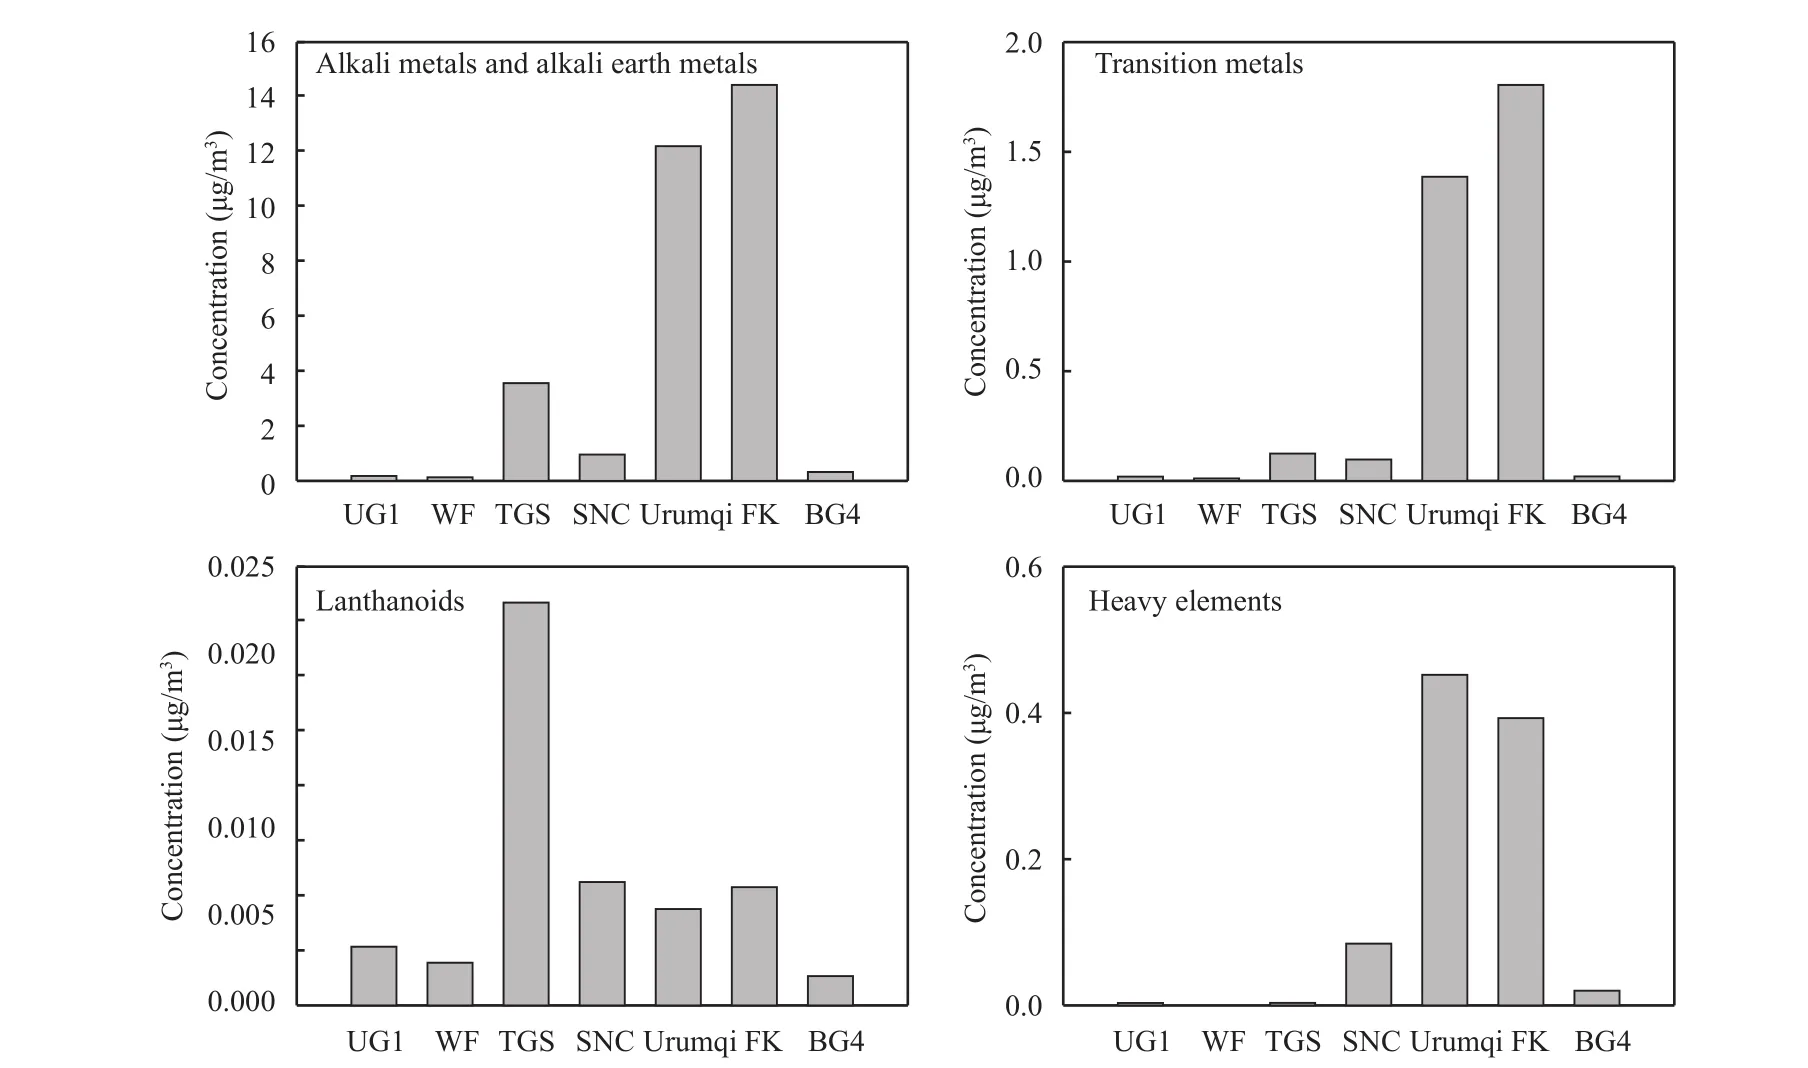
Figure 2 Four categories of the aerosol elements at seven sampling sites
Heavy elements. The heavy metals accounted for about 2.1% of the total concentration. When the seven different sites were compared, heavy metals showed up as 5 to 1,013 times higher in Urumqi and FK, as compared to UG1, WF, TGS, SNC, and BG4(Figure 2). Tl and Pb were found to be the high-concentration elements for the transition metals at these seven sampling sites, with average concentrations of 0.371 and 0.319 μg/m3, respectively.
Overall, the average concentrations of alkali metals, alkali earth metals, and geogenic elements(e.g., Fe) were two to three orders of magnitude higher than those for the transition metals, heavy elements, and lanthanoids.
3.2 Morphology results
The final dataset included around 2,000 particles analyzed on seven filters. The particles were grouped into five dominant types according to their morphology and EDX signal: clay particles(Al4[Si4O10], Al4SiO2, and Ba[Al2Si2O8]), plagioclase particles (Na[AlSi3O8] and Ca[Al2Si2O8]), dolomite (CaMg[CO3]2), alkali feldspar particles(KAlSi3O8- NaAlSi3O8), and soot.
4 Discussion
4.1 Enrichment-factor analysis
Trace elements in the atmosphere originate from natural sources such as rock and soil dust, sea-salt spray, volcanoes, wild forest fires, and marine biogenic sources (Lee et al., 2008). On a global scale,however, the emissions of trace elements into the atmosphere from various anthropogenic sources are known to exceed those from natural sources (Nriagu et al., 1989). Crustal enrichment factors (EFc) are often calculated to identify source regions and evaluate the degree of anthropogenic influence (Duce et al.,1975; Cong et al., 2007; Lee et al., 2008; Öztürk et al., 2012). EFc is defined as the concentration ratio of a given element to that of Al (Al, Si, Ti, or Fe were commonly used as approximations of rock and soil dust because they are abundant in crustal material and are not significantly affected by contamination), normalized to the same concentration ratio characteristic of the upper continental crust. For example, the EFc for Cr is thus

where Cr represents the element of interest; and Al is a reference element. Here, we have used the data given by Wedepohl (1995) for the upper continental crust. The aerosol and crust subscripts refer to elements in the aerosol samples and crustal material,respectively. An EFc value close to unity is considered as indicating a dominant input from rock and soil, while an EFc value greater than 10 suggests that the corresponding element originated mainly from other sources (Ferrari et al., 2001; Cong et al.,2007; Wu et al., 2009).
Figure 4 shows the mean values of crustal enrichment factors for the measured trace elements. The average EFc values are observed to be highly variable between elements, with the lowest value determined for Ti (0.17) and the highest for Se (4,075.49). This wide range of EFc values for the elements is an indicator of the differences in crustal contributions from one group to another.
Overall, the mean values of EFc are relatively lower for the 47 selected trace elements (including alkali metals, alkali earth metals, transition metals,lanthanoids, and heavy metals) in UG1, WF, and TGS, as compared to Urumqi, FK, and BG4 (Figure 2).The distinct differences are detailed below.
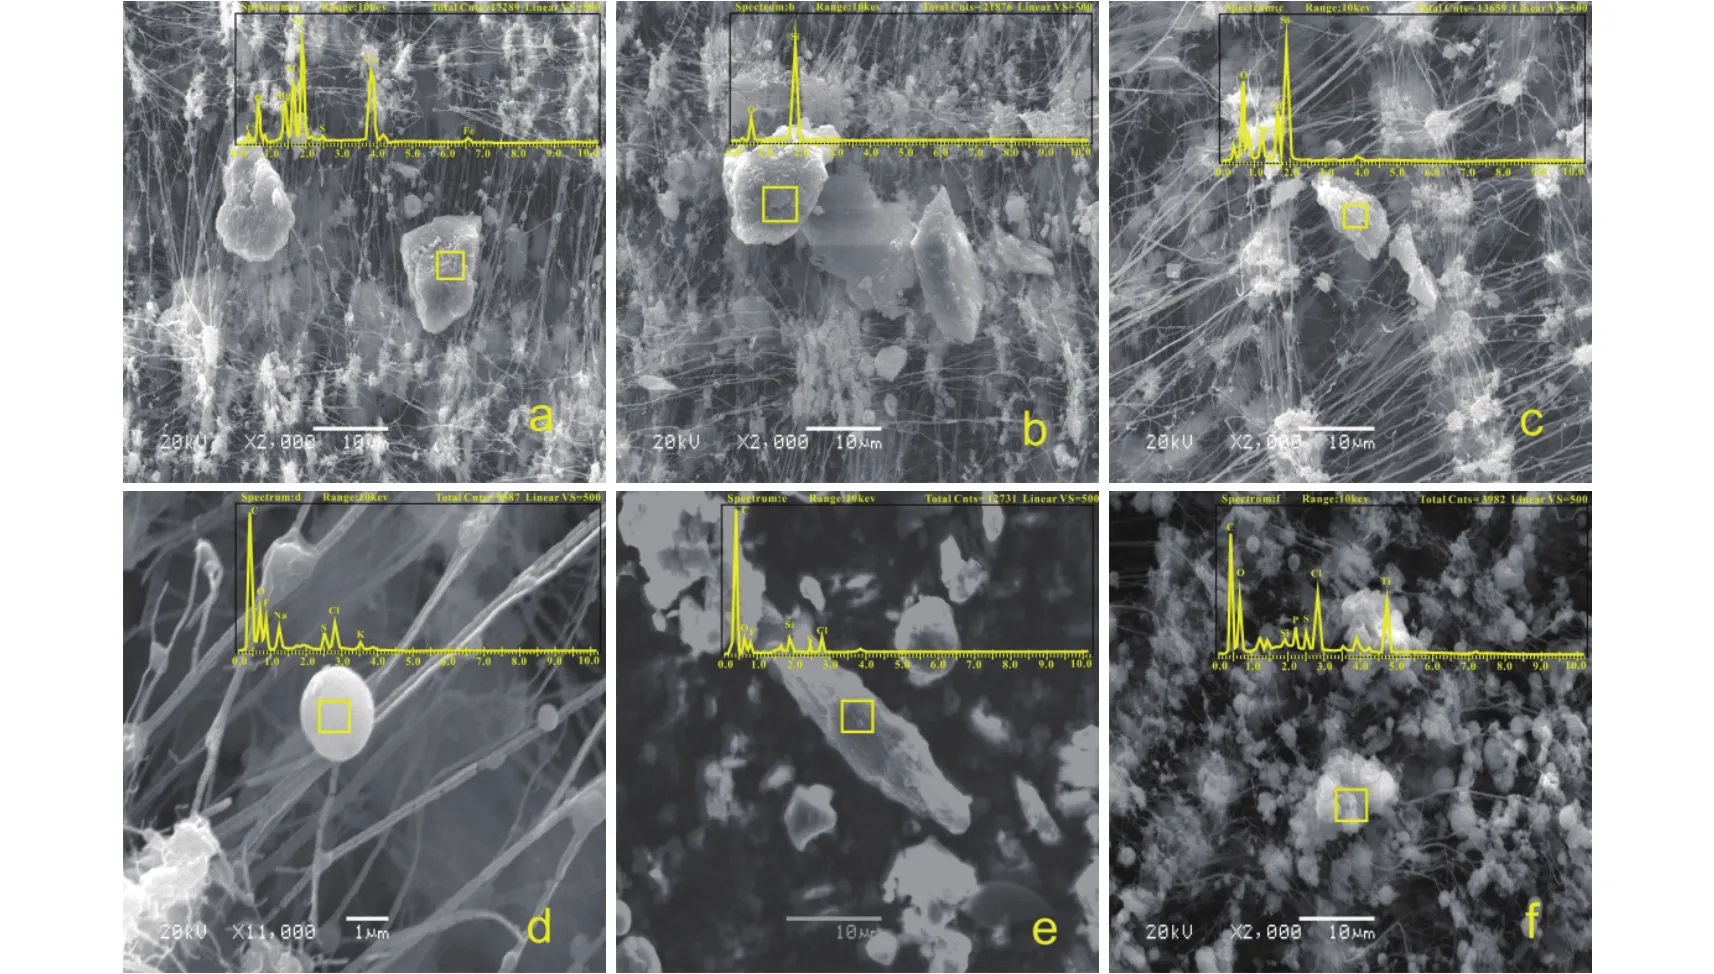
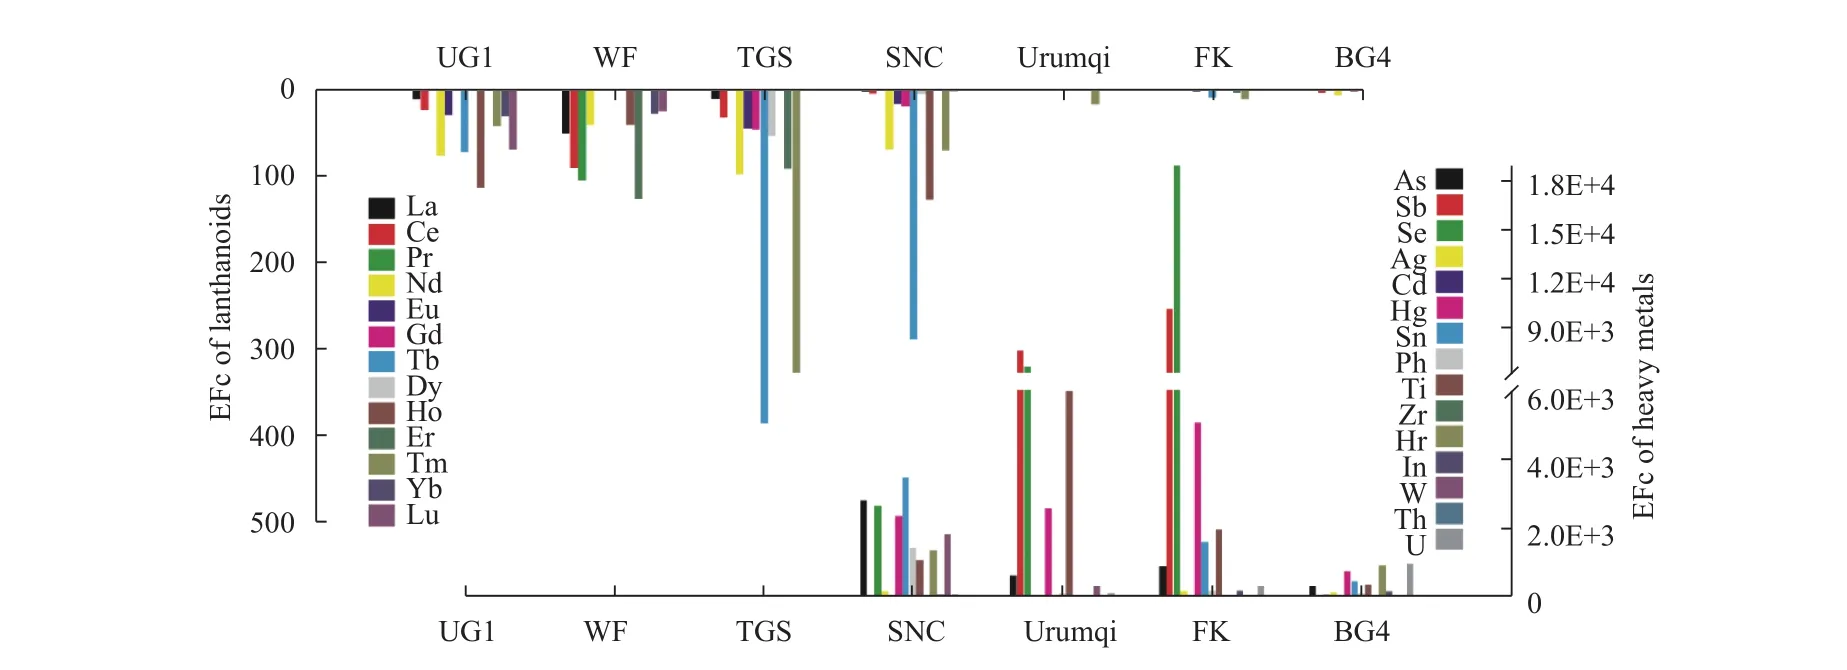
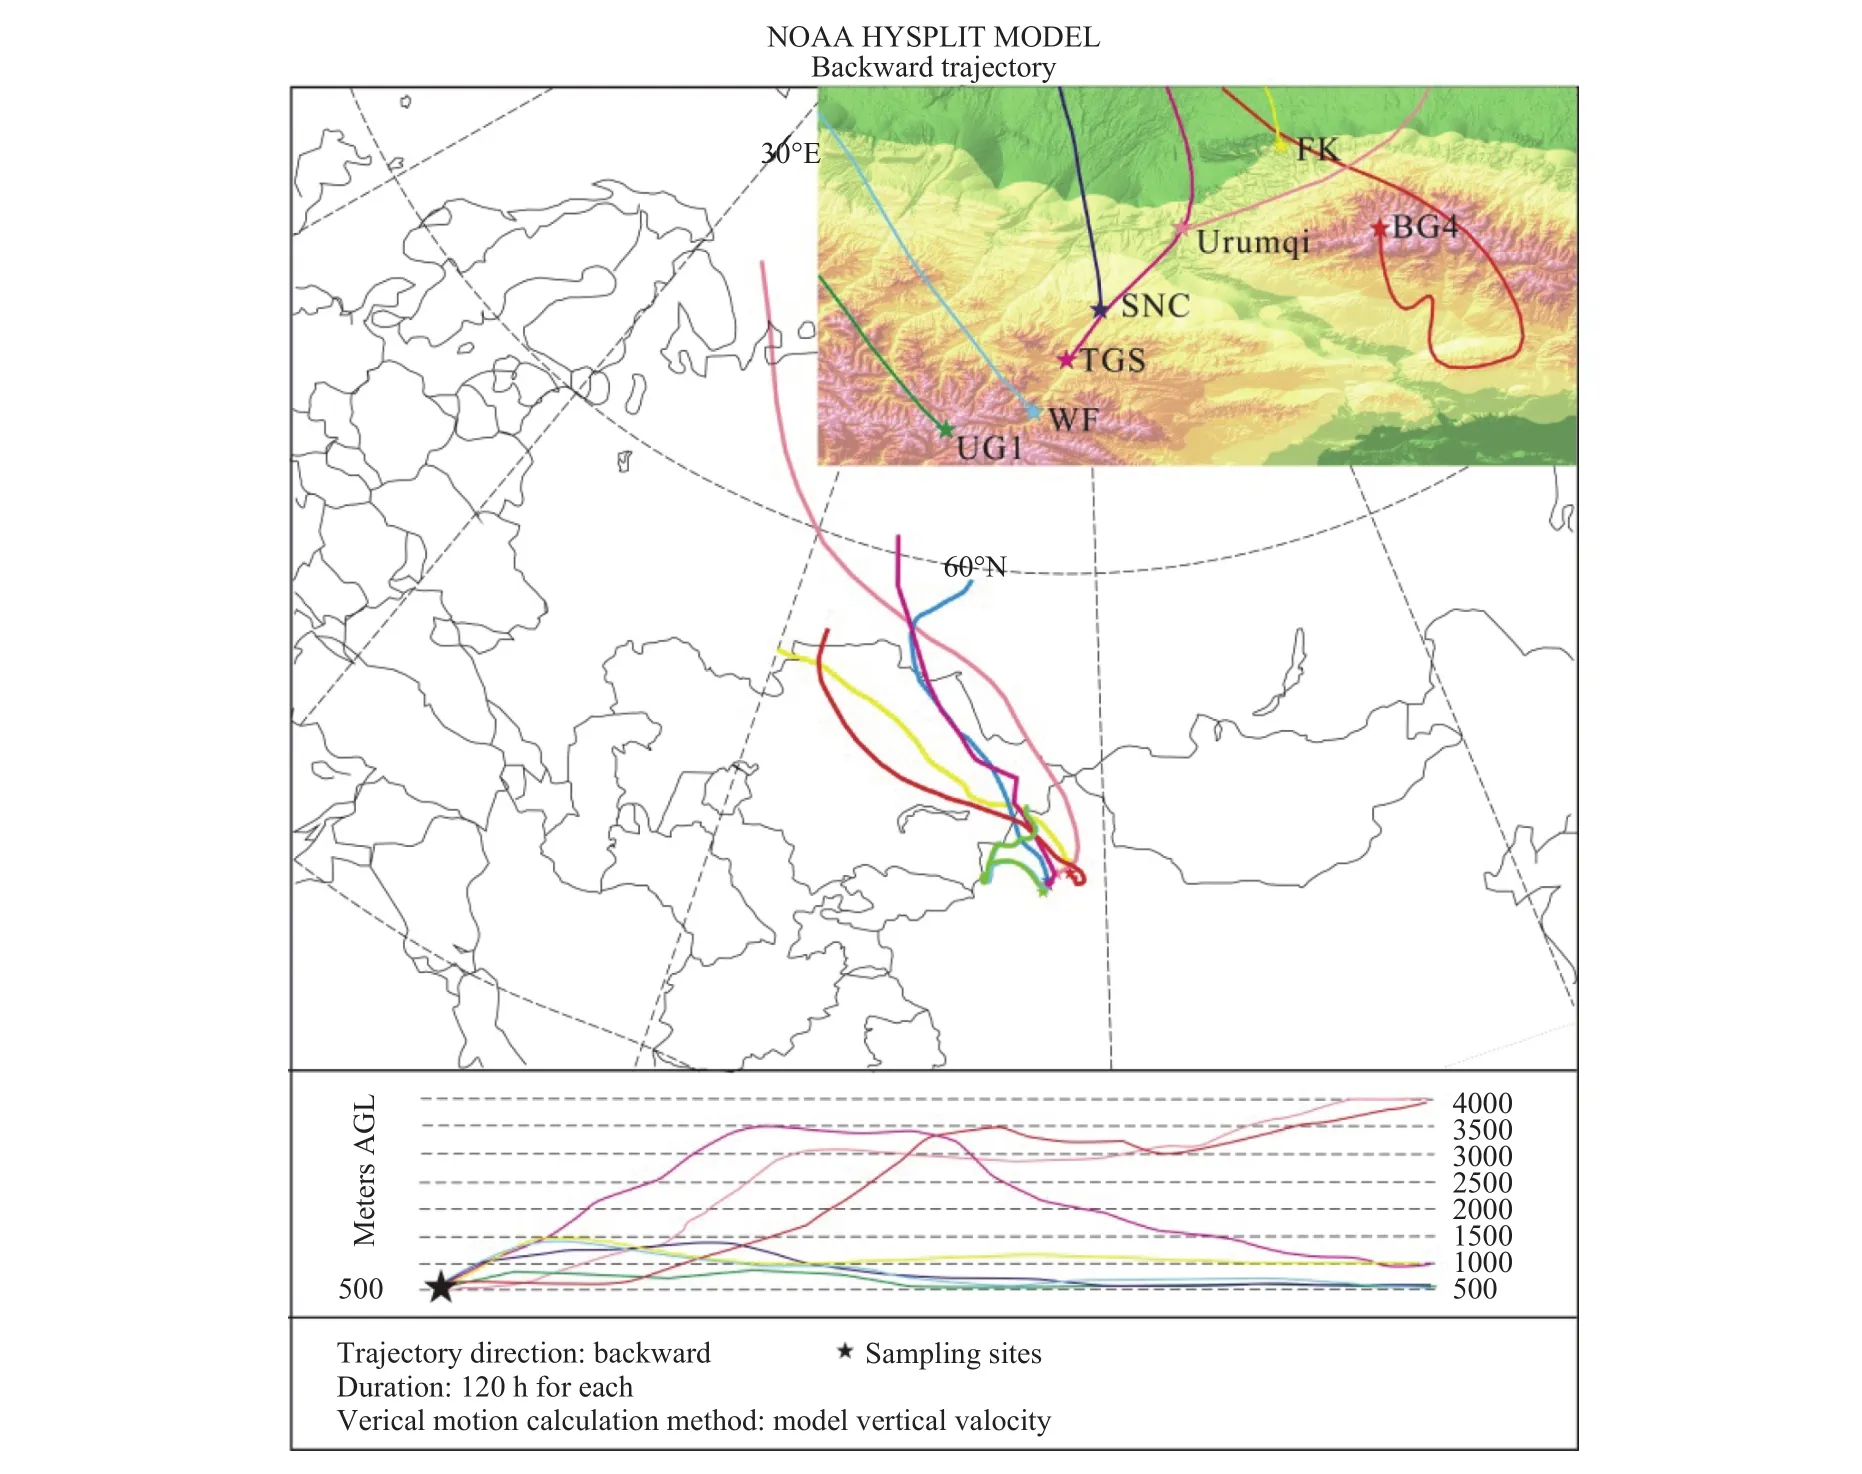
Alkali metals, alkali earth metals, and former transition metals showed low EFc values (all less than 10, except for Rb valued at 12.47) for all of the seven sites (Figure 2), indicating their crustal origins. The lanthanoids have average EFc values of 10 < EFc <100, and thus are considered moderately enriched,with the following order of occurrence: Yb (10.37) Previous studies showed that when enrichment factors of lanthanoids in atmospheric particles are between 3 and 10, it indicates the influence of anthropogenic pollution in the atmosphere on these elements, while values between 1 and 3 indicate their main source is dust from the ground (Wang et al.,2008). In our study, the lanthanoids showed high EFc values (all higher than 10) at all of the seven sites(Figure 2), indicating the possibility of anthropogenic influence. Heavy elements were found to be highly enriched,with EFc values greater than 100, ranging from 198 to 4,075 at all seven aerosol-sample sites. The order of occurrence was U (198.11) < Pb (264.29) < W(307.35) < Hf (326.43) < As (663.46) < Sn (781.94) When the seven different sites were compared,higher average EFc values of lanthanoids showed up at UG1, WF, and TGS, as compared to Urumqi, FK,and BG4 (Figure 5). Conversely, higher average EFc values of heavy metals showed up at Urumqi, FK, and BG4, as compared to UG1, WF, and TGS. The SNC sample was highly enriched with both lanthanoids and heavy metals (Figure 5). The altitude order is UG1(3,804 m a.s.l.), WF (3,039 m a.s.l.), TGS (2,135 m a.s.l.), SNC (1,691 m a.s.l.), Urumqi (809 m a.s.l.),FK (584 m a.s.l.), and BG4 (3,613 m a.s.l.) (Figure 1).According to this interesting characteristic of EFc values-combined with altitudes of the seven sites-local meteorology (such as wind stress and direction), as well as air mass trajectories, must be considered as an important contributor to the explanation, as discussed below. For example, although UG1 and BG4 are both high-altitude glaciers, the lanthanide enrichment is much higher at UG1 than at BG4. The local wind condition should be the main reason. The State Road No.216 is sited 2 km southeast of UG1. This road crossing the mountains and the glaciers in this area is made of sands and clay. The dust and vehicle emissions caused by passing cars had been very easily carried to UG1 by the southeasterly mountain valley wind,which is the frequent wind direction during the daytime. That is why the influence of the local wind cannot be ignored. Figure 2 shows at different magnifications typical individual particles from the Urumqi River Basin,loaded on the filters. According to the results of the enrichment-factors analysis above, two particle categories could be obtained, based on the morphology and chemical characteristics of the individual particles. The distinct characteristics and possible origins of each group are described in detail as follows. Crust-originated particles: clay; plagioclase;dolomite, CaMg(CO3)2; and alkali feldspar,KAlSi3O8- NaAlSi3O8. Clay particles were rich at WF. The clay particles are characterized by high content of Si and Al, with varying Mg/Ca. At UG1, plagioclase particles were rich, consisting of high content of Na[AlSi3O8] and Ca[Al2Si2O8]. From the point of view of mineralogy, clay particles usually include Al4[Si4O10], Al4SiO2, Ca[Al2Si2O8], and Ba[Al2Si2O8], which are typical terrigenous minerals.Feldspar (KAlSi3O8- NaAlSi3O8) turns into clay under the weathering process (Cong et al., 2010a).Therefore, a large fraction of the irregularly shaped particles (Figure 3a) identified as alumosilicates could be attributed to eolian dispersion of soil particles. Besides, few particles consisting predominantly of Si and Fe were detected in aerosol samples from UG1, WF, and TGS. The Si/Fe-rich particles are considered to be biotite (K(Mg, Fe)3[AlSi3O10(OH, F)2]),as biotite (generally associated with magnetite) is abundant in West China, especially in the Xinjiang Uygur Autonomous Region. Besides soil dispersion,Fe-rich particles could also be produced by coal-fired boilers and metal industry (Zhao et al., 2011). Fe-rich particles emanating from a high-temperature furnace usually show a spherical shape (Cong et al., 2010b).However, all of the Si/Fe-rich particles in this study have irregular (nonspherical) morphology (Figure 3b)and thus can be identified as of natural origin. Figure 3 SEM images of typical aerosol particles. (a, b) crust-originated particles; (c) pollution-derived particles;(d, e, f) particles containing soot, with varying heavy metals and crustal elements Figure 4 Enrichment factors (EFc) of aerosols, relative to the reference element Al Pollution-derived particles: Important sources of atmospheric lead include emissions from automobile exhaust, coal combustion, mining or smelting operations, and waste incineration. Aerosol samples collected at SNC, Urumqi, and FK were characterized by high content of Cl-rich particles, S-rich particles, and soot; and containing only a small amount of Na, Ti,and Pb (Figure 3c). It has been verified that airborne Pb can be carried globally through long-range transport, as it tends to concentrate on fine particles that have a long residence time in the atmosphere (Cong et al., 2010a). Furthermore, Rattigan et al. (2001) sug-gested that approximately 70% of aerosol Pb could be ascribed to leaded gasoline. As analyzed above, Pb showed high absolute EFc values of 1,409.06, 87.85,188.32, and 109.81 at SNC, Urumqi, FK, and BG4,respectively, indicating the serious impact of anthropogenic activities. Figure 5 Enrichment factors (EFc) variations of lanthanoids and heavy metals at the seven sampling sites Soot could be clearly distinguishable from other aerosol types due to its unique morphology, as shown in Figure 3d. The morphology of this kind of particle varies from short chains to complex clusters, depending on the type of fuel, burning conditions, and atmospheric processing (Chakrabarty et al., 2006; Yue et al., 2006). In our study, a considerable percentage of soot particles contained S, Cr, Zn, Pb, and Ni, with varying crustal elements (e.g., Al, K, and Ca), which were observed by EDX analysis, indicating a mixed source for these particles. Paoletti et al. (2003) suggested that the S content in soot aggregates was probably caused by a gas-to-particle conversion process during transport (Pósfai et al., 2003). Other unrecognized particles could contain organic particles with light elements (such as C, N, and O) or biological particles. To investigate potential source regions of pollution-derived heavy metals in aerosols from these seven sampling sites, 5-day backward trajectories were computed using the hybrid single-particle Lagrangian integrated trajectory (HYSPLIT-4) model developed by the National Oceanic and Atmospheric Administration (http://www.arl.noaa.gov/ready/hysplit4.html).The trajectories were calculated at 500 m above ground level for the seven sampling sites (Figure 6). In general, the larger part of the air mass arriving at UG1 and WF was from short-range aerosol transport from the north; and the air mass arriving at SNC,Urumqi, FK, and BG4 was from long-range aerosol transport from the west. (1) The trajectories arriving at UG1 and WF reflected short-range aerosol transport, originating from the south slope of the Altai Mountains at an altitude of 1,117 m a.s.l., down to 311 m a.s.l. along the western edge of the Jungger basin, subsequently climbing up along the north slope of the Tianshan from several hundreds to around one-thousand metres a.s.l., immediately across the valley straight to the south until blocked by high mountains with an altitude of 2,702 m a.s.l., then flowing into the low places and turning to the southeast, finally arriving at UG1 and WF. It is clear that samples from these air masses exhibited higher average EFc values of lanthanoids and lower values of heavy metals at UG1, WF, and TGS, as compared to Urumqi, FK, and BG4, indicating less pollutant was carried by their trajectories. (2) The trajectories arriving at SNC, Urumqi, FK,and BG4 reflected long-range aerosol transport, originating from the northwestem regions near Siberia and passing through east Kazakhstan, the Karamay oilfield, the Gurbantunggut Desert, and the south edge of the Jungger Basin. Samples from these four sites,where the northerly air mass arrived, exhibited high EFc values of pollution-derived heavy metals (U, Pb,W, Hf, As, Sn, Tl, Hg, Sb, and Se) (Figure 4). Especially, it is to be noted that these air masses traveled across the Semipalatinsk Test Site (Figures 1 and 6). The Semipalatinsk Nuclear Test Site (SNTS)(50°07′N, 78°43′E) was the primary testing venue for the Soviet Union's nuclear weapons for more than 40 years (Olivier et al., 2003; Semiochkina et al., 2004;Zhang et al., 2011). It is located in northeast Kazakhstan, in the south valley of the Irtysh River. The nuclear test site was located around 150 km west of the town of Semipalatinsk, near the border of the East Kazakhstan Province and Pavlodar Province, with most of the nuclear tests taking place at various sites farther to the west and the south, some as far away as Karagandy Province (Zhang et al., 2011). The current and future risk to people living in the contaminated area has been evaluated by Semiochkina et al. (2004)using Internal doses; results indicated that wholebody measurements calculated for adults are in the range of 13 to 500 μSv/y even nowadays (Semiochkina et al., 2004). Recent studies also pointed out pollution levels of heavy metals such as Pb, Cd still exceed the national limit in the Semipalatinsk Nuclear Test Site (SNTS) region of East Kazakhstan. Figure 6 Daily backward trajectories terminating at the sampling site According to data derived from backward air trajectories from the Tianshan, the typical transit time from possible major source regions is 0.5 to 1 day in the summer. Our sampling site is therefore assumed also to be affected by long-range transport of heavy metals (U, Pb, W, Hf, As, Sn, Tl, Hg, Sb, and Se) arriving at SNC, Urumqi, FK, and BG4 via emissions from the Karamay oilfield and nuclear test sites like Semipalatinsk. (3) Aerosol samples collected at FK showed that the site has been seriously polluted by heavy metals.The advantageous industries of FK City fall to coal production, coal chemical industry, nonferrous metal production, and subsequent deep processing of oil and gas (Wu et al., 2008). FK has roughly 28 coal-related factories, especially those for electrolytic nickel production. In addition, FK produced 3,256 t of electrolytic nickel in 2005, with 3.87 times of the nation's growth rate (Wu et al., 2008). All of these industrial factories cannot shirk responsibility for the heavy metal polluted aerosols at FK. This industrial activity could also be one of the important reasons for BG4 showing higher average heavy-metals EFc values than UG1 (Figure 4), because the trajectories arriving at BG4 pass through FK City. Besides the factors discussed above, BG4 is a high-altitude site; but it is more polluted (in terms of heavy-metals EFs) when compared with UG1, likely because BG4 is located downwind of the pollutionemission region, FK. Aerosol samples collected along an altitude gradient from 584 m a.s.l to 3,804 m a.s.l at seven sites showed that four of those sampling sites (SNC, Urumqi City, FK, and BG4) were contaminated mainly by heavy metals; and the heavy metals increased rapidly with the reduction in altitude in both the Urumqi River and Sigong River basins. Aerosols from SNC,Urumqi, FK, and BG4 were characterized by high contents of Cl-rich particles, S-rich particles, and soot. The backward-trajectories results indicated that air masses arriving at SNC, Urumqi, FK, and BG4 were identified as the more polluted source, when compared to UG1 and WF, sites of short-range air mass transport from the north. Low altitude, as well as terrain blocking, might be another important reason for the gradient difference in pollution influence among these seven places in the Urumqi River Basin.Samples from SNC, Urumqi, FK, and BG4 exhibited a high daily percentage of pollution-derived heavy metals, as well as high concentrations of all individual heavy metals, such as Sb, Ag, Se, As, Hg, Ta, Tl,Sn, and Pb. Acknowledgments: This research was jointly supported by the National Natural Science Foundation of China (41201065,41121001, 41261017, 41171057, 41161012); the Funds for Creative Research Groups of China(41121001); the foundation for Excellent Youth Scholars of CAREERI, CAS (51Y251B51); the SKLCS foundation (Grant No. SKLCSZZ-2012-01-01);the National Basic Research Program of China(2010CB951003, 2010CB951404); and the Knowledge Innovation Project of the Chinese Academy of Sciences (KZCX2-EW-311). We would like to thank Wang Wenbin, Xia Mingying, She Yuanyang, Li Xuliang, and Jin Shuang for the sampling; and Zhu Yuman, Bao Qiufang, and Liu Yaping for the chemical analysis. 通过建立安全生产管理体系,加强危险源辨识、评价的培训,切实落实危险源控制工作,以提升危险源控制与管理水平。利用安全工作例会机会检查危险源辨识工作开展情况,逐一点评,统一思路,相互借鉴,促进危险源辨识工作水平提升。 Belikova TV, Vasilenko VN, Nazarov IM, et al., 1984. Characteristics of background sulfate pollution of the snow cover on the territory of the USSR. Meteorologiya i Gidrologiya, 9: 47–55. Borbon A, Locoge N, Veillerot M, et al., 2002. Characterisation of NMHCs in a French urban atmosphere: overview of the main sources. Science of the Total Environment, 292(3): 177–191. DOI:10.1016/S0048-9697(01)01106-8. Chakrabarty RK, Moosmuller H, Garro MA, et al., 2006. Emissions from the laboratory combustion of wildland fuels: Particle morphology and size. Journal of Geophysical Research: Atmospheres,111(D7): D07204. DOI: 10.1029/2005JD006659. Cong ZY, Kang SC, Liu XD, et al., 2007. Elemental composition of aerosol in the Nam Co region, Tibetan Plateau, during summer monsoon season. Atmospheric Environment, 41(6): 1180–1187.DOI: 10.1016/j.atmosenv.2006.09.046. Cong ZY, Kang SC, Dong SP, et al., 2010a. Elemental and individual particle analysis of atmospheric aerosols from high Himalayas. Environmental Monitoring and Assessment, 160(1–4): 323–335. DOI:10.1007/s10661-008-0698-3. Cong ZY, Kang SC, Zhang YL, et al., 2010b. Atmospheric wet deposition of trace elements to central Tibetan Plateau. Applied Geochemistry, 25(9): 1415–1421. DOI: 10.1016/j.apgeochem.2010.06.011. Duce RA, Hoffman GL, Zoller WH, 1975. Atmospheric trace metals at remote northern and southern hemisphere sites: pollution or natural? Science, 187(4171): 59–61. DOI: 10.1126/science.187.4171.59. Fang M, Zheng M, Wang F, et al., 1999. The long-range transport of aerosols from northern China to Hong Kong–a multi-technique study. Atmospheric Environment, 33(11): 1803–1817. DOI:10.1016/S1352-2310(98)00318-5. Guo H, Wang T, Simpson IJ, et al., 2004. Source contributions to ambient VOCs and CO at a rural site in eastern China. Atmospheric Environment, 38(27): 4551–4560. DOI: 10.1016/j.atmosenv.2004.05.004. Han YX, Fang XM, Zhao TL, et al., 2008. Long range trans-Pacific transport and deposition of Asian dust aerosols. Journal of Environmental Sciences, 20(4): 424–428. DOI: 10.1016/S1001-0742(08)62074-4. Huang K, Fu JS, Gao Y, et al., 2014. Role of sectoral and multi-pollutant emission control strategies in improving atmospheric visibility in the Yangtze River Delta, China. Environmental Pollution, 184:426–434. DOI: 10.1016/j.envpol.2013.09.029. Jaffe D, Anderson T, Covert D, et al., 1999. Transport of Asian air pollution to North America. Geophysical Research Letters, 26(6):711–714. DOI: 10.1029/1999GL900100. Jiang YL, Zhuang GS, Wang QZ, et al., 2014. Aerosol oxalate and its implication to haze pollution in Shanghai, China. Chinese Science Bulletin, 59(2): 227–238. DOI: 10.1007/s11434-013-0009-4. Kreutz KJ, Aizen VB, Cecil LD, et al., 2001. Oxygen isotopic and soluble ionic composition of a shallow firn core, Inilchek glacier,central Tien Shan. Journal of Glaciology, 47(159): 548–554. DOI:10.3189/172756501781831819. Lee K, Hur SD, Hou SG, et al., 2008. Atmospheric pollution for trace elements in the remote high-altitude atmosphere in central Asia as recorded in snow from Mt. Qomolangma (Everest) of the Himalayas. Science of the Total Environment, 404(1): 171–181. DOI:10.1016/j.scitotenv.2008.06.022. Lee XQ, Qin DH, Jiang GB, et al., 2003. Atmospheric pollution of a remote area of Tianshan Mountain: ice core record. Journal of Geophysical Research, 108(D14): 4406. DOI: 10.1029/2002JD002181. Li Q, Song JP, Wang ER, et al., 2014. Economic growth and pollutant emissions in China: a spatial econometric analysis. Stochastic Environmental Research and Risk Assessment, 28(2): 429–442. DOI:10.1007/s00477-013-0762-6. Liu PF, Zhao CS, Zhang Q, et al., 2009. Aircraft study of aerosol vertical distributions over Beijing and their optical properties. Tellus B, 61(5): 756–767. DOI: 10.1111/j.1600-0889.2009.00440.x. Lu C, Deng QH, Ou CY, et al., 2013. Effects of ambient air pollution on allergic rhinitis among preschool children in Changsha, China.Chinese Science Bulletin, 58(34): 4252–4258. DOI:10.1007/s11434-013-5725-2. Lu H, Zhu LZ, Chen SG, 2008. Pollution level, phase distribution and health risk of polycyclic aromatic hydrocarbons in indoor air at public places of Hangzhou, China. Environmental Pollution,152(3): 569–575. DOI: 10.1016/j.envpol.2007.07.005. Nriagu JO, 1989. A global assessment of natural sources of atmospheric trace metals. Nature, 338(6210): 47–49. DOI: 10.1038/338047a0. Olivier S, Schwikowski M, Brütsch S, et al., 2003. Glaciochemical investigation of an ice core from Belukha glacier, Siberian Altai.Geophysical Research Letters, 30(19): 2019. DOI:10.1029/2003GL018290. Öztürk F, Zararsız A, Dutkiewicz VA, et al., 2012. Temporal variations and sources of Eastern Mediterranean aerosols based on a 9-year observation. Atmospheric Environment, 61: 463–475. DOI:10.1016/j.atmosenv.2012.07.051. Paoletti L, De Berardis B, Arrizza L, et al., 2003. Seasonal effects on the physico-chemical characteristics of PM2.1in Rome: a study by SEM and XPS. Atmospheric Environment, 37(35): 4869–4879.DOI: 10.1016/j.atmosenv.2003.08.031. Pósfai M, Simonics R, Li J, et al., 2003. Individual aerosol particles from biomass burning in southern Africa: 1. Compositions and size distributions of carbonaceous particles. Journal of Geophysical Research: Atmospheres, 108(D13): 8483. DOI: 10.1029/2002JD 002291. Rattigan OV, Mirza MI, Ghauri BM, et al., 2001. Aerosol sulfate and trace elements in urban fog at Lahore, Pakistan. Abstr Pap Am Chem S, 222: U475. Semiochkina N, Voigt G, Mukusheva M, et al., 2004. Assessment of the current internal dose due to137Cs and90Sr for people living within the Semipalatinsk Test Site, Kazakhstan. Health Physics,86(3): 187–192. Sexton K, Westberg H, 1984. Nonmethane hydrocarbon composition of urban and rural atmospheres. Atmospheric Environment, 18(6):1125–1132. DOI: 10.1016/0004-6981(84)90144-6. Shen GF, Yuan SY, Xie YN, et al., 2014. Ambient levels and temporal variations of PM2.5and PM10at a residential site in the megacity, Nanjing, in the western Yangtze River Delta, China. Journal of Environmental Science and Health, Part A, 49(2): 171–178.DOI: 10.1080/10934529.2013.838851. Sun JY, Qin DH, Mayewski PA, et al., 1998. Soluble species in aerosol and snow and their relationship at Glacier 1, Tien Shan, China.Journal of Geophysical Research: Atmospheres, 103(D21):28021–28028. DOI: 10.1029/98JD01802. Tan HB, Yin Y, Gu XS, et al., 2013. An observational study of the hygroscopic properties of aerosols over the Pearl River Delta region.Atmospheric Environment, 77: 817–826. DOI:10.1016/j.atmosenv.2013.05.049. Wake CP, Mayewski PA, Spencer M, 1990. A review of central Asian glaciochemical data. Annals of Glaciology, 14: 301–306. DOI:10.1017/S026030550000879X. Wang ZW, Zhang XS, Mu YJ, 2008. Effects of rare-earth fertilizers on the emission of nitrous oxide from agricultural soils in China. Atmospheric Environment, 42(16): 3882–3887. DOI: 10.1016/j.atmosenv.2008.01.018. Wedepohl KH, 1995. The composition of the continental crust.Geochimica et Cosmochimica Acta, 59(7): 1217–1232. DOI:10.1016/0016-7037(95)00038-2. Wei JC, Guo XM, Marinova D, et al., 2014. Industrial SO2pollution and agricultural losses in China: evidence from heavy air polluters.Journal of Cleaner Production, 64: 404–413. DOI:10.1016/j.jclepro.2013.10.027. Williams MA, Tonnessen KA, Melack JM, et al., 1992. Sources and spatial variation of the chemical composition of snow in the Tien Shan, China. Annals of Glaciology, 16: 25–32. DOI:10.1017/S0260305500004778. Wu DW, Yang DG, Mao HY, et al., 2008. Structuring recycle economy of advantageous industries: a case study of Fukang City,Xinjiang. Arid Land Geography, 31(5): 779–787. Wu GJ, Xu BQ, Yao TD, et al., 2009. Heavy metals in aerosol samples from the Eastern Pamirs collected 2004–2006. Atmospheric Research, 93(4): 784–792. DOI: 10.1016/j.atmosres.2009.03.011. Xiao R, Bai JH, Huang LB, et al., 2013. Distribution and pollution,toxicity and risk assessment of heavy metals in sediments from urban and rural rivers of the Pearl River delta in southern China. Ecotoxicology, 22(10): 1564–1575. DOI: 10.1007/s10646-013-1142-1. Yin WQ, Wang L, Li RR, et al., 2014. Personal exposure levels of PAHs in the general population in northern rural area of Jiangsu Province, China. Journal of Environmental Science and Health,Part A, 49(3): 281–286. DOI: 10.1080/10934529.2014.846604. Yue WS, Lia XL, Liu JF, et al., 2006. Characterization of PM2.5in the ambient air of Shanghai city by analyzing individual particles. Science of the Total Environment, 368(2–3): 916–925. DOI:10.1016/j.scitotenv.2006.03.043. Zhang L, Jacob DJ, Boersma KF, et al., 2008. Transpacific transport of ozone pollution and the effect of recent Asian emission increases on air quality in North America: an integrated analysis using satellite, aircraft, ozonesonde, and surface observations. Atmospheric Chemistry and Physics, 8(20): 6117–6136. DOI: 10.5194/acp-8-6117-2008. Zhang Q, Zhao CS, Tie XX, et al., 2006. Characterizations of aerosols over the Beijing region: a case study of aircraft measurements. Atmospheric Environment, 40(24): 4513–4527. DOI: 10.1016/j.atmosenv.2006.04.032. Zhang XY, Edwards R, 2011. Anthropogenic sulfate and nitrate signals in snow from bogda glacier, eastern tianshan. Journal of Earth Science, 22(4): 490–502. DOI: 10.1007/s12583-011-0196-3. Zhang XY, Li ZQ, Zhou P, et al., 2016. Characteristics and source of aerosols at Shiyi Glacier, Qilian Mountains, China. Sciences in Cold and Arid Regions, 8(2): 135–146. DOI: 10.3724/SP.J.1226.2016.00135. Zhao SH, Li ZQ, Zhou P, 2011. Ion chemistry and individual particle analysis of atmospheric aerosols over Mt. Bogda of eastern Tianshan Mountains, Central Asia. Environmental Monitoring and Assessment, 180(1–4): 409–426. DOI: 10.1007/s10661-010-1796-6. : Zhang XY, Wang SJ, Zhang X, et al., 2017. Chemistry and environmental significance of aerosols collected in the eastern Tianshan.Sciences in Cold and Arid Regions, 9(5): 0455–0466. 10.3724/SP.J.1226.2017.00455. *Correspondence to: XiaoYu Zhang, Ph.D., Northwest Institute of Eco-Environment and Resources, Chinese Academy of Sciences. No. 320, West Donggang Road, Lanzhou, Gansu 730000, China. Tel: 15193119018; +86-931-4967381. E-mail:zhangxiaoyu@lzb.ac.cn December 28, 2016 Accepted: May 9, 20174.2 Individual particle analysis
4.3 Possible source investigation
5 Conclusion
猜你喜欢
杂志排行
Sciences in Cold and Arid Regions的其它文章
- The temporal and spatial variation of positive degree-day factors on the Koxkar Glacier over the south slope of the Tianshan Mountains, China, from 2005 to 2010
- Changes of glacier area in the Xiying River Basin,East Qilian Mountain, China
- A mathematical approach to evaluate maximum frost heave of unsaturated silty clay
- Characteristics of thawed interlayer and its effect on settlement beneath embankment in permafrost regions-A case study for the Qinghai-Tibet Highway
- Contamination and risk assessment of heavy metals in farmland soils of Baghrash County, Xinjiang,Northwest China
- Complex network analysis of climate change in the Tarim River Basin, Northwest China