The temporal and spatial variation of positive degree-day factors on the Koxkar Glacier over the south slope of the Tianshan Mountains, China, from 2005 to 2010
2017-11-17MinXuHaiDongHanShiChangKang
Min Xu , HaiDong Han , ShiChang Kang ,2*
1. State Key Laboratory of Cryospheric Science, Cold and Arid Regions Environmental and Engineering Research Institute, Chinese Academy of Sciences, Lanzhou, Gansu 730000, China
2. CAS Center for Excellence in Tibetan Plateau Earth Sciences, Chinese Academy of Sciences, Beijing 100101, China
The temporal and spatial variation of positive degree-day factors on the Koxkar Glacier over the south slope of the Tianshan Mountains, China, from 2005 to 2010
Min Xu1, HaiDong Han1, ShiChang Kang1,2*
1. State Key Laboratory of Cryospheric Science, Cold and Arid Regions Environmental and Engineering Research Institute, Chinese Academy of Sciences, Lanzhou, Gansu 730000, China
2. CAS Center for Excellence in Tibetan Plateau Earth Sciences, Chinese Academy of Sciences, Beijing 100101, China
The degree-day model is one important method to estimate glacier melt, which is based on the specific relationship between glacial melting and the sum of daily mean temperatures above the melting point. According to the observation data on the Koxkar Glacier (KG) from 2005 to 2010, we analyzed the temporal and spatial variation of degree-day factors(DDF) and its influential factors. The results indicate that the average value of DDF was 7.2~10.4 mm/(°C.d) on the KG from 2005 to 2010. It showed a decreasing trend between 3,700 m and 4,200 m, and the deceasing trend was more obvious in the upper part of the KG. On a spatial scale, the DDF increased evidently with increasing altitude. The DDF ranged from 3.6 to 9.3 mm/(°C.d) at 3,700 m a.s.l., with the average value of 9.3 mm/(°C.d). It varied from 6.9 to 13.0 mm/(°C.d) at 4,000 m a.s.l., with the average value of 10.2 mm/(°C.d). During the period of ablation, the fluctuation of DDF was not significant at the lower altitude (3,700 m a.s.l.), but it decreased at the higher altitudes (4,000 m a.s.l. and 4,200 m a.s.l.).The debris changes the transmission of heat, which accelerates the melting of a glacier; and the DDF showed high value.This paper will provide the reference for temporal–spatial parameterization schemes of DDF on Tuomuer glaciers of the Tianshan Mountains.
degree-day factor; temporal and spatial variation; glacier ablation; Koxkar Glacier
1 Introduction
Climate warming is the k ey issue of climate change (Jing et al., 2015). Against the backdrop of global warming, most glaciers have thinned and retreated in Northwest China, which has had significant influences on regional water resources (Qin et al.,2005; Yao et al., 2012). Glacier mass balance is a key factor in linking fluctuations of glaciers and climate change (Liu et al., 1998). Climate change leads to changes of the energy balance of glaciers, which induce changes of movement and thermal characteristics of glaciers, and then lead to changes of tip location, area, and ice reserves in glaciers. Therefore, the glacier mass balance is one of the most sensitive indicators reflecting climate change (Liu et al., 1999).Its dynamic change is the material basis for glacier fluctuation and runoff changes. The estimation of glacier mass balance and ablation have been of wide concern (Laumann and Reeh, 1993; Liu et al., 1999;Braithwaite and Zhang, 2000; Han et al., 2012).
The degree-day model is the main method to evaluate the ablation of glaciers, which is based on the linear relationship between ice ablation and positive accumulated temperature. Positive degree-day factors(DDF) is the key parameter of the model, which simplifies description of the energy-conversion process on the surface of the glacier (Singh et al., 2000; Kayast et al., 2003; Sugiyama, 2003). The DDF depends on the energy balance at the surface of the glacier. In prior studies, DDF usually was a fixed value for a whole glacier in a model; the method to calculate the DDF is based on ablation, using stakes (Braithwaite and Olesen, 1989; Hock, 2003), which is influenced by temperature, altitude, slope aspect, thickness of debris, glacier movement, and other factors (Braithwaite et al., 2000, 2003; Singh et al., 2000; Scherler et al., 2011). Compared with bare ice of the Dokriani Glacier in the Himalayas, the DDF of debris-melting and snow-melting increased 9% and 2%, respectively.It is 30% higher in ice-melting than in snow-melting,the result indicating that the speed of ablation is slower in debris areas than in bare-ice areas (Singh et al., 2002; Nuimura et al., 2011, 2012). In addition, the DDF has spatial variability, ranges from 4.5 to 8.8 mm/(°C.d) (4,305~4,619 m a.s.l.) and 6.0 to 10.5 mm/(°C.d) (5,120~5,270 m a.s.l.) on Qiyi Glacier and Yala Glacier, respectively (Kayastha et al.,2003). The DDF of snow is about 3.1 mm/(°C.d) on Urumqi Glacier No. 1 of the Tianshan Mountains and 5.1~10.1 mm/(°C.d) for bare ice (Liu et al., 1996).The DDF of the Zhadang Glacier varies from 4.0 to 14.0 mm/(°C.d) (Wu et al., 2010). Comparison of DDF at several nearby observation points on Koxkar Glacier (KG) shows the difference is very large, varying from −21% to 14.2%. These studies show that DDF are significantly different, even on the same glacier. Therefore, the research focused on the spatiotemporal distribution of DDF is helpful for improving the precision of the degree-day model.
Previous studies have focused on the variation of DDF at different elevations, slopes, and slopes of the glacier cliff on the KG (Zhang et al., 2005; Han et al.,2009). However, the time scale is just based on days;and the study period is generally 1~2 months, while the long-term variation of DDF in relation to the temporal and spatial changes has not been reported yet.Based at the field station on the southern slope of the western Tianshan Mountains, we used the ablation data observed by use of stakes and meteorological data (from May to September) from 2005 to 2010 to calculate the DDF of the KG in this study. The temporal and spatial distribution of DDF and influence factors were systematically analyzed. The results will provide important parameters for estimation of mass balance and melt water in the Tuomuer glaciers of the western Tianshan Mountains.
2 Study area
The area of the KG is 89.6 km2; and the length of the KG is 25.1 km, with elevation ranging from 2,960 to 6,342 m a.s.l.. Ice volume is 15.79 km3(Zhang et al., 2005). The precipitation is supplied mainly by moisture from the Atlantic and Arctic. Annual precipitation is about 533 mm which occurs from June to August accounts for 50%; 70% occurs from May to September, and about 30% occurs during the cold season. Annual precipitation near the snow line is 750~850 mm (Xie et al., 2004; Zhang, 2005; Han,2012). There is one automatic weather station (AWS)at the basecamp (3,000 m a.s.l.) and another four AWSs located on the glacier, with elevations of 3,200, 3,400, 3,700, and 4200 m a.s.l., respectively(Figure 1).
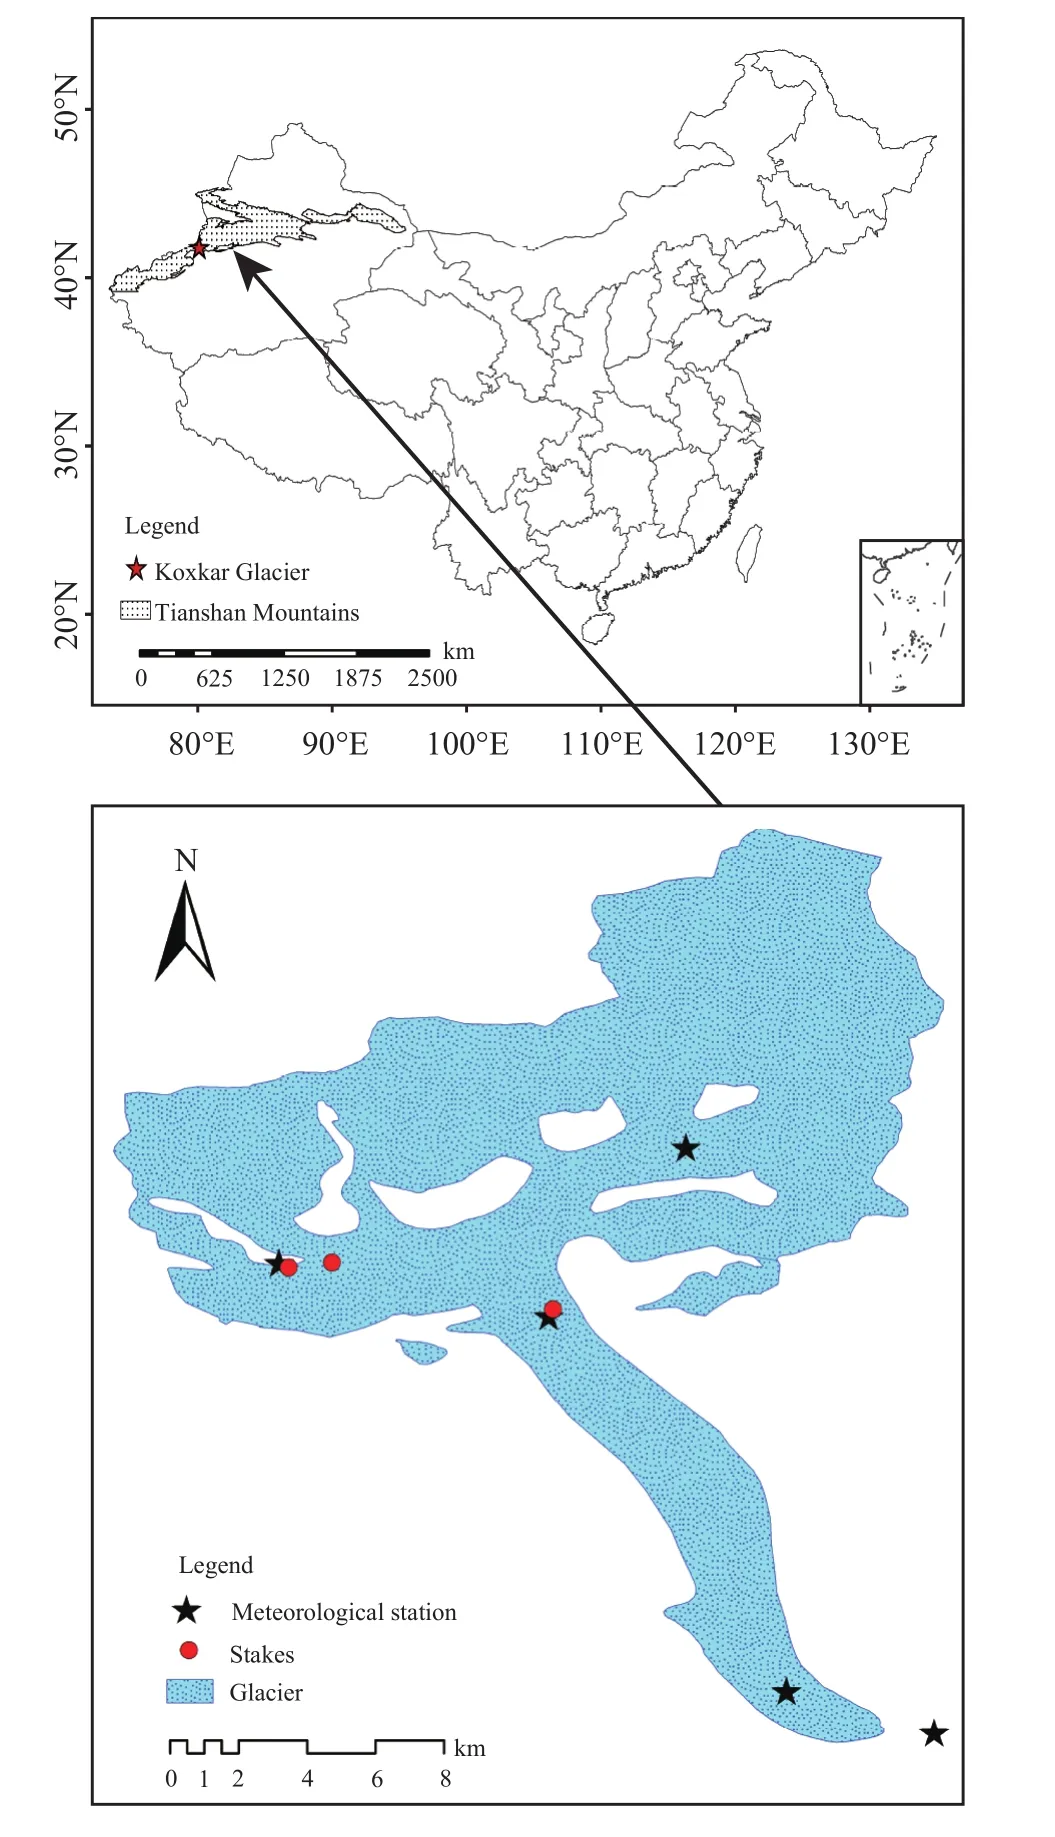
Figure 1 Location map of the Koxkar Glacier
3 Data and method
3.1 Data
At the KG, the observations of meteorology and ablation have been carried out since July 2003 on the KG. The air temperature used is 2 m above the ice;the interval of observation is 1 hour. The temperature at other altitudes on the glacier is derived from the rate of temperature decline (0.61 °C/100m). The positive accumulated temperature is calculated according to the method of Liu et al. (1999) and Braithwaite et al. (1998); approximation of air temperature is regarded as a normal distribution. We used stakes to observe the ablation of the glacier from 3,700 m a.s.l. to 4,200 m a.s.l. (Figure 2). The data of ablation were collected from 2005 to 2010; observation periods were from 25 days to 30 days. The ablation waterequivalent of the glacier was calculated according to the ablation thickness at each stake. The density of ice is supposed to be 0.91 g/cm3. Due to limitations of the observation conditions, the observed data are incomplete. In addition, as the area of the KG is very large,the DDF of different underlying (debirs, snow, bare ice) were calculated for different altitudes at 3,700 m a.s.l., 4,000 m a.s.l., and 4,200 m a.s.l., respectively.

Figure 2 Ablation observation on the KG, using stakes
3.2 Method of calculating DDF
DDF is the ratio of glacier ablation to positive accumulated temperature over a certain period. Based on the ablation data of observation using stakes and daily temperature data from May to September from 2005 to 2010, positive accumulated temperatures at different altitudes in the glacier area were calculated by using the gradient of temperature. The formula is as follows:

where DDF is degree-day factor (mm/(°C.d)), A is the ablation amount of glacier or snow during the period of ablation (mm), and PDD is positively accumulated temperature over the period of ablation (°C).
The method of calculated positive accumulated temperature at different altitudes is as follows:

where Ttis the daily mean temperature (Tt<0 °C), Htis the logical variable, when Tt≥0 °C, Ht=1.0, When Tt<0 °C, Ht= 0.0. Z is the altitude of the stake, Z0is the altitude of the meteorological station, and K is the gradient of temperature (°C).
4 Results and discussion
4.1 The relationship between PDD and amount of ablation at different altitudes of the KG
There is a close relationship between the ablation of glacier and the air temperature, especially the positive accumulated temperature over a certain period(Liu et al., 1996). Braithwaite and Olesen (1989) have found that the correlation coefficient between annual ablation of glacier and annual positive accumulated temperature in the Greenland ice sheet was 0.96.Zhang et al. (2005) calculated the correlation coefficient with the positive accumulated temperature and data of ablation of 0.7 in the period of ablation during 2005 on the KG. In this study, the correlation coefficient between ablation and positive accumulated temperature is 0.57 (p <0.05) from 2005 to 2010(Figure 3a). The correlation coefficient is different at different altitudes; the value varies from 0.45 to 0.78 (p <0.05) (Figure 3b). The highest correlation was at 3,700 m a.s.l., the lowest at 4,000 m a.s.l.. In general, the correlation between the ablation and the positive accumulated temperature on the KG is well-established.
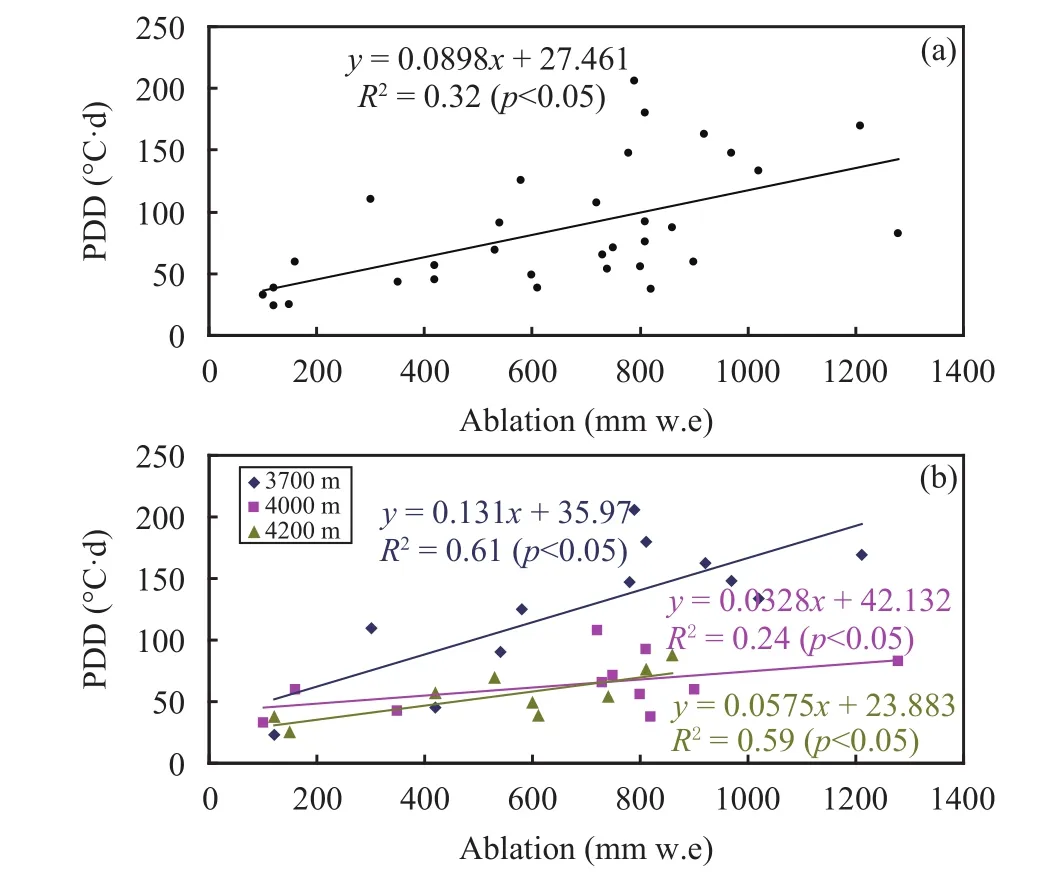
Figure 3 Ablation amount changes with positive cumulative temperature for different altitudes on the KG. (a) the correlation coefficient between ablation and positive accumulated temperature for the whole glacier; (b) the correlation coefficient is different at different altitudes
4.2 The temporal and spatial variation of DDF
Based on the ablation data of observation using stakes and daily temperature data from May to September from 2005 to 2010, the DDF was calculated by Equations (1) and (2) for different altitudes of the KG (Figure 4). Not only on the spatial scale but also on the temporal scale, the DDF is not constant.Due to the different characteristics of the surface, elevation, slope, aspect, and other conditions, there are differences in DDF. In addition, the trend of DDF did not change obviously; it showed a decreasing trend at 3,700 m a.s.l. and 4,200 m a.s.l. from 2005 to 2010 but an increased trend at 4,000 m a.s.l.. With the interannual changes, the DDF showed significant fluctuations on the KG. At 3,700 m a.s.l., the DDF showed the highest value in September 2005, dramatic changes in 2005 and 2006, and relative stability from 2008 to 2010. At 4,000 m a.s.l., the DDF showed the lowest value in August 2005, the high value in 2008 and 2009. The DDF fluctuated less from 2003 to 2005.
To analyze the monthly variation of DDF, the monthly average value of DDF at different altitudes were calculated from 2005 to 2010 (Figure 5). In addition to September, the DDF changed little during the ablation season at 3,700 m a.s.l.. The average value of DDF decreased from May to September from 2005 to 2010 at 4,000 and 4,200 m a.s.l.; the maximum value appeared in July, the minimum value in September. The fluctuation of DDF was not obvious from May to August during 2005 and 2010 at 3,700 m a.s.l.; but in September, it showed high value, the main reason being that the underlying (covered by debris) is sophisticated in this area. However, the DDF have obvious fluctuations at different altitudes on the KG. Thus, one needs to consider the temporal and spatial variation of the DDF in assessing the melting of such glaciers, which will improve the accuracy of simulation. The DDF varied from 3.6 to 9.3 mm/(°C.d) at 3,700 m a.s.l., with a mean value of 6.0 mm/(°C.d). It was from 3.0 to 11.7 mm/(°C.d) at 4,000 m a.s.l., with a mean value of 8.6 mm/(°C.d).The DDF showed the highest value at 4,200 m a.s.l.;the value varied from 6.9 to 13.0 mm/(°C.d), and the mean value was 10.2 mm/(°C.d). In the Karakoram Mountains, the DDF was 2.6~5.4 mm/(°C.d); it was 8.0~10.5 mm/(°C.d) (5,425 and 5,475 m a.s.l.) on the Dongkemadi Glacier (Kayastha et al., 2003). The temporal and spatial differences were due to changes of the characteristics of underlying of the glaciers, the characteristics of which changed in different months.At the lower part of glacier, the underlying of cover was debris, which resulted in little change in surface characteristics of the glacier. The mean value of DDF was 7.2 to 10.4 mm/(°C.d) from 2005 to 2010 on the KG (Table 1), lower than on the glaciers of Nyaqengtanglha (Wu et al., 2010). The DDF have obvious regional differences, which are mainly attributed to the difference in spatial climatic characteristics of different glaciers, especially their energy budgets.
In general, the DDF on the KG decreased with altitude, decreasing from 2005 to 2010 (Figure 6); the trend of change is consistent with Xiaodongkemadi Glacier of the Tanggula Mountains, Qiyi Glacier of the Qilian Mountains, Yala Glacier of the Himalayas Mountains, and AX010 Glacier (Kayastha et al.,2003). However, the trend is different than for Urumqi Glacier No. 1 of the Tianshan Mountains, and Unteraarglet scher Glacier and Lauteraargletscher Glacier in Switzerland (Liu et al., 1996; Sugiyama et al.,2003). The research indicated that solar radiation is more intense at the higher glacier areas; and the main source of energy for glacier melting is solar radiation,which results in increased glacier melting at higher altitudes. The daily mean temperature of the glacier areas with higher elevation is lower, which leads to smaller positive accumulated temperature (Zhang et al., 2004). By contrast, there are large area of debris on the KG; the thickness of debris gradually thins with increasing elevation, and the value of DDF also increased.
4.3 Factors influencing DDF
The changes of DDF are mainly due to the spatial and temporal variation of the energy exchange on the glacier. In different climatic backgrounds and different seasons, glaciers located in different terrains have different energy composition; and the DDF also changes accordingly. Under the same conditions,DDF increased with increasing altitude and solar radiation; it decreased with increasing temperature and reflectance (Braithwaite, 1995; Hock, 2003). For the same glacier, the DDF also changed at different points. The study indicated that even for the distance of only a few meters between two points, the value of DDF has ±10% deviation (Hock, 2003).
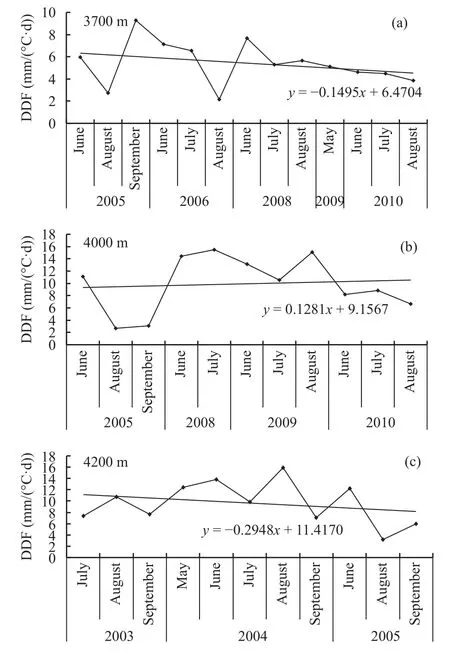
Figure 4 Variation of DDF from 2005 to 2010 on the KG.(a) 3,700 m, (b) 4,000 m, and (c) 4,200 m
The most prominent feature of the KG is that the zone of ablation is covered by different thicknesses of debris; the average thickness is about 115 cm at the terminal of glacier; the maximum is more than 2 m(Han et al., 2005). Compared with ice or snow, a surface covered by debris has a unique thermal process,low albedo, and other physical properties that prevent solar radiation heat and turbulence exchange heat from directly reaching the ice surface; it heats the surface of debris first, and then the heat is transferred to the ice surface. In addition, part of the heat in the surface layer also passes up to the air, reducing the heat that transfers to the surface of glacier; the process affects the melting of the glacier (Sugiyama et al., 2003;Zhang et al., 2005). The thickness of debris up to 10 cm and 20 cm reduces by 10% and 56%, respectively, ablation of the glacier; if the thickness of debris is less than 10 cm, it restrains the ablation (Sugiyama et al., 2003). The thickness of debris less than 5 cm increases the velocity of ablation on the Khumbu Glacier; when the thickness of debris was above 5 cm, the ablation of the glacier was refrained (Kayastha et al.,2000). The debris has great influence on ablation on the KG. The thickness of debris decreases as altitude increases; the heat used for ablation of the glacier increases, which leads to accelerating the velocity of ablation; so DDF is larger at high altitudes. We need more field experiments to clarify the influences of debris on ablation of the KG in the future.
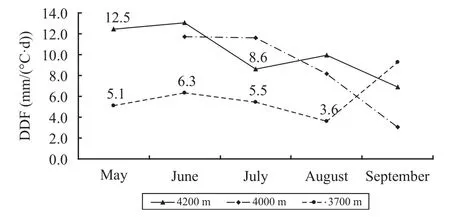
Figure 5 Monthly variation of DDF at different elevations from 2005 to 2010
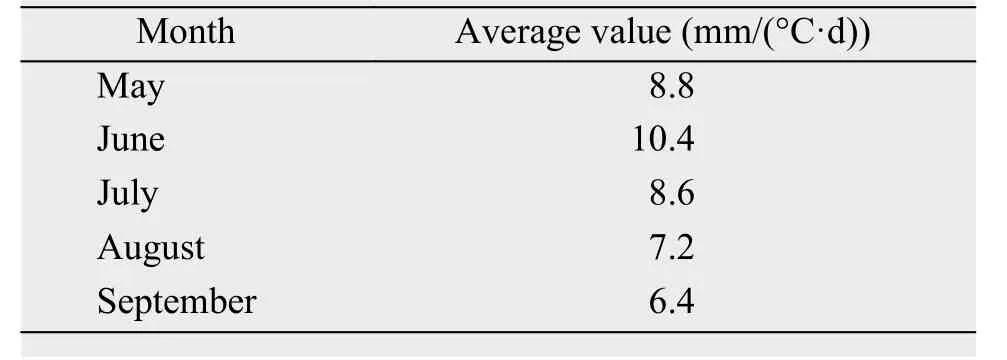
Table 1 The average value of DDF in different months from 2005 to 2010 on the KG
5 Summary
Based on the ablation and meteorological data from 2005 to 2010, the temporal and spatial variability of DDF on the KG and its influencing factors were analyzed. The results provide important parameters for estimating glacier mass balance, sensitivity of glacier response to climate change and meltwater of glaciers in the Tuomuer Mountains. The research shows that the correlation between ablation and positive accumulated temperature has different effects at differ-ent altitudes, with the values varying from 0.45 to 0.78 (p <0.05). The DDF had great variation in the period of ablation from 2005 to 2010, showing a trend of decrease that is more obvious on the upper part of the glacier. On the spatial scale, DDF increased obviously with increasing altitude. The DDF varied from 3.6 to 9.3 mm/(°C.d) at 3,700 m a.s.l., with a mean value of 6.0 mm/(°C.d). The DDF was 3.0 to 11.7 mm/(°C.d) at 4,000 m a.s.l., with a mean value of 8.6 mm/(°C.d). The DDF showed the highestvalues at 4,200 m a.s.l., varying from 6.9 to 13.0 mm/(°C.d),with a mean of 10.2 mm/(°C.d). Overall, the mean value of DDF was 7.2 to 10.4 mm/(°C.d) from 2005 to 2010 on the KG.
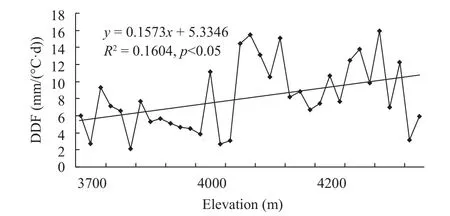
Figure 6 The relationship between DDF and altitudes on the KG from 2005 to 2010
Due to limiting conditions, the same height of continuous observation of the stake is not adequate,leading to uncertainties in calculating the ablation.Changes in reflectance, manmade measurement errors and occlusion, slope, and other terrain factors affect the DDF; but these lack corresponding observations, so we cannot explain them in detail. Some of the issues in this paper need to be further discussed and studied in the future.
Acknowledgments:
This study was supported by the National Natural Science Foundation of China (41501073, 41471060,41421061), the project of State Key Laboratory of Cryospheric Science (SKLCS-ZZ-2017), and China Postdoctoral Science Foundation (2015M580893,2016T90966). The authors would like to thank the workers who helped to observe in the field, and the editors and anonymous reviewers for their crucial comments, which improved the quality of this paper.
Braithwaite RJ, 1995. Positive degree-day factors for ablation on the Greenland ice sheet studied by energy-balance modelling. Journal of Glaciology, 41(137): 153–160. DOI: 10.1017/S0022143000017846.
Braithwaite RJ, Konzelmann T, Marty C, et al., 1998. Errors in daily ablation measurements in northern Greenland, 1993–94, and their implications for glacier climate studies. Journal of Glaciology,44(148): 583–588. DOI: 10.1017/S0022143000002094.
Braithwaite RJ, Olesen OB, 1989. Calculation of glacier ablation from air temperature, West Greenland. In: Oerlemans J (ed.). Glacier Fluctuations and Climatic Change. Dordrecht: Kluwer Academic Publishers, pp. 219–233.
Braithwaite RJ, Zhang Y, 2000. Sensitivity of mass balance of five Swiss glaciers to temperature changes assessed by tuning a degree-day model. Journal of Glaciology, 46(152): 7–14. DOI:10.3189/172756500781833511.
Braithwaite RJ, Zhang Y, Raper SCB, 2003. Temperature sensitivity of the mass balance of mountain glaciers and ice caps as a climatological characteristic. Zeitschrift für Gletscherkunde and Glazialgeologie, 38(1): 35–61.
Han HD, Ding YJ, Liu SY, 2005. Estimation and analysis of heat balance parameters in the ablation season of debris-covered Kerqikaer Glacier, Tianshan Mountains. Journal of Glaciology and Geocryology, 27(1): 88–94.
Han HD, Shao JR, Lin F, et al., 2012. Modeling the sensitivity of meltwater runoff of tuomuer-type glacier to climate changes. Progressus Inquisitiones de Mutatione Climatis, 8(5): 357–363. DOI:10.3969/j.issn.1673-1719.2012.05.007.
Han HD, Wang J, Wang X, et al., 2009. Study of the positive degreeday factor of ice cliff ablation in debris-covered area of the Koxkar glacier. Journal of Glaciology and Geocryology, 31(4): 620–627.
Hock R, 2003. Temperature index melt modelling in mountain areas.Journal of Hydrology, 282(1–4): 104–115. DOI: 10.1016/S0022-1694(03)00257-9.
Jing ZF, Wang K, Liu L, 2015. Movement and variation of four typical glaciers in the Qilian Mountains, northwestern China. Sciences in Cold and Arid Regions, 7(3): 206–211. DOI:10.3724/SP.J.1226.2015.00206.
Kayastha RB, Ageta Y, Nakawo M, et al., 2003. Positive degree-day factors for ice ablation on four glaciers in the Nepalese Himalayas and Qinghai-Tibetan Plateau. Bulletin of Glaciological Research,20: 7–14.
Kayastha RB, Takeuchi Y, Nakawo M, et al., 2000. Practical prediction of ice melting beneath various thickness of debris cover on Khumbu Glacier, Nepal, using a positive degree-day factor. In:Debris-Covered Glaciers. Washington, USA: IAHS Publication,264: 71–81.
Laumann T, Reeh N, 1993. Sensitivity to climate change of the mass balance of glaciers in southern Norway. Journal of Glaciology,39(133): 656–665.
Liu SY, Ding YJ, Wang NL, et al., 1998. Mass balance sensitivity to climate change of the Glacier No. 1 at the Urumqi River head,Tianshan Mts. Journal of Glaciology and Geocryology, 20(1):9–13.
Liu SY, Ding YJ, Ye BS, et al., 1996. Study on the mass balance of the Glacier No. 1 at the headwaters of the Urumqi River using degreeday method. In: Proceedings of the Fifth Chinese Conference on Glaciology and Geocryology (Volume 1). Lanzhou: Gansu Culture Press, pp. 197–204.
Liu SY, Wang NL, Ding YJ, et al., 1999. On the characteristics of glacier fluctuations during the last 30 years in Urumqi River Basin and the estimation of temperature rise in the high mountain area. Advance in Earth Sciences, 14(3): 279–285. DOI: 10.11867/j.issn.1001-8166.1999.03.0279.
Nuimura T, Fujita K, Fukui K, et al., 2011. Temporal changes in elevation of the debris-covered ablation area of Khumbu glacier in the Nepal Himalaya since 1978. Arctic, Antarctic, and Alpine Research, 43(2): 246–255. DOI: 10.1657/1938-4246-43.2.246.
Nuimura T, Fujita K, Yamaguchi S, et al., 2012. Elevation changes of glaciers revealed by multitemporal digital elevation models calibrated by GPS survey in the Khumbu region, Nepal Himalaya,1992–2008. Journal of Glaciology, 58(210): 648–656. DOI:10.3189/2012JoG11J061.
Qin DH, Chen YY, Li XY, 2005. Climate and Environment changes in China. Beijing: Science Press, pp. 114–120.
Scherler D, Bookhagen B, Strecker MR, 2011. Spatially variable response of Himalayan glaciers to climate change affected by debris cover. Natural Geoscience, 4(3): 156–159. DOI: 10.1038/ngeo1068.
Singh P, Kumar N, Arora M, 2000. Degree-day factors for snow and ice for Dokriani Glacier, Garhwal Himalayas. Journal of Hydrology, 235(1–2): 1–11. DOI: 10.1016/S0022-1694(00)00249-3.
Singh VP, Woolhiser DA, 2002. Mathematical modeling of watershed hydrology. Journal of Hydrologic Engineering, 7(4): 270–292.DOI: 10.1061/(ASCE)1084-0699(2002)7:4(270).
Sugiyama S, 2003. Influence of surface debris on summer ablation in Unteraar- and Lauteraargletscher, Switzerland. Bulletin of Glaciological Research, 20: 41–47.
Wu QR, Kang SC, Gao TG, et al., 2010. The characteristics of the positive degree-day factors of the Zhadang Glacier on the Nyainqêntanglha range of Tibetan Plateau, and its application.Journal of Glaciology and Geocryology, 32(5): 891–897.
Xie CW, Ding YJ, Liu SY, et al., 2004. Analysis on the glacial hydrological features of the glaciers on the south slope of Mt. Tuomuer and the effects on runoff. Arid Land Geography, 27(4): 570–575.DOI: 10.3321/j.issn:1000-6060.2004.04.022.
Yao TD, Thompson L, Yang W, et al., 2012. Different glacier status with atmospheric circulations in Tibetan Plateau and surroundings.Nature Climate Change, 2(9): 663–667. DOI:10.1038/nclimate1580.
Zhang Y, Liu SY, Han HD, et al., 2004. Characteristics of climate on the Keqicar Glacier on the South Slopes of the Tianshan Mountains during ablation period. Journal of Glaciology and Geocryology, 26(5): 545–550.
Zhang Y, Liu SY, Shangguan DH, et al., 2005. Study of the positive degree-day factors on the Koxkar Baqi glacier on the South Slope of Tianshan Mountains. Journal of Glaciology and Geocryology,27(3): 337–343.
*Correspondence to: ShiChang Kang, Professor of Cold and Arid Regions Environmental and Engineering Research Institute, Chinese Academy of Sciences. No. 320, West Donggang Road, Lanzhou, Gansu 730000, China. E-mail:shichang.kang@lzb.ac.cn
: Xu M, Han HD, Kang SC, 2017. The temporal and spatial variation of positive degree-day factors on the Koxkar Glacier over the south slope of the Tianshan Mountains, China, from 2005 to 2010. Sciences in Cold and Arid Regions, 9(5): 425–431.
10.3724/SP.J.1226.2017.00425.
January 5, 2017 Accepted: May 8, 2017
杂志排行

Sciences in Cold and Arid Regions的其它文章
- Changes of glacier area in the Xiying River Basin,East Qilian Mountain, China
- A mathematical approach to evaluate maximum frost heave of unsaturated silty clay
- Characteristics of thawed interlayer and its effect on settlement beneath embankment in permafrost regions-A case study for the Qinghai-Tibet Highway
- Chemistry and environmental significance of aerosols collected in the eastern Tianshan
- Contamination and risk assessment of heavy metals in farmland soils of Baghrash County, Xinjiang,Northwest China
- Complex network analysis of climate change in the Tarim River Basin, Northwest China