Characteristics of thawed interlayer and its effect on settlement beneath embankment in permafrost regions-A case study for the Qinghai-Tibet Highway
2017-11-17ZhiZhongSunHongLeiWangWenJieFengYongZhiLiuShuJuanZhang
ZhiZhong Sun , HongLei Wang , WenJie Feng , YongZhi Liu ,3, ShuJuan Zhang
1. State Key Laboratory of Frozen Soil Engineering, Northwest Institute of Eco-Environment and Resources, Chinese Academy of Sciences, Lanzhou, Gansu 730000, China
2. University of Chinese Academy of Sciences, Beijing 100049, China
3. Beiluhe Observation and Research Station on Frozen Soil Engineering and Environment in Qinghai-Tibet Plateau,Northwest Institute of Eco-Environment and Resources, Chinese Academy of Sciences, Lanzhou, Gansu 730000, China
Characteristics of thawed interlayer and its effect on settlement beneath embankment in permafrost regions-A case study for the Qinghai-Tibet Highway
ZhiZhong Sun1*, HongLei Wang1,2, WenJie Feng1, YongZhi Liu1,3, ShuJuan Zhang1
1. State Key Laboratory of Frozen Soil Engineering, Northwest Institute of Eco-Environment and Resources, Chinese Academy of Sciences, Lanzhou, Gansu 730000, China
2. University of Chinese Academy of Sciences, Beijing 100049, China
3. Beiluhe Observation and Research Station on Frozen Soil Engineering and Environment in Qinghai-Tibet Plateau,Northwest Institute of Eco-Environment and Resources, Chinese Academy of Sciences, Lanzhou, Gansu 730000, China
Based on ground temperatures and deformations monitored at the Xieshuihe site along the Qinghai-Tibet Highway (QTH)in permafrost regions from 2004 to 2015, variation of artificial permafrost table (APT), maximum frozen depth (MFD),thawed interlayer thickness (TIT) and ground temperature beneath embankment is analyzed, respectively. The results indicate that under the embankment, the change of APT occurred from October to December of that year and presented a deepening trend. The change of MFD occurred from April to June of that year with no obvious change trend, and TIT had an increasing trend year by year, which mainly resulted from the deepening artificial permafrost table. Mean annual ground temperature at 0.5 m depth was 3.91 °C higher beneath the embankment center than that under the natural field. The rising ground temperature at shallow layer of embankment resulted in the development of thawed interlayer beneath the embankment and warming of underlying permafrost. Embankment settlement is closely associated with TIT. Greater settlement easily occurs when permafrost with higher ice content exists under the thawed interlayer, and in turn the settlement is smaller when permafrost with lower ice content exists under the thawed interlayer.
thawed interlayer; embankment; in-situ monitoring; settlement; Qinghai-Tibet Highway
1 Introduction
The Qinghai-Tibet Plateau (QTP), with an average elevation of more than 4,000 m above sea level,is the highest and most extensive plateau in the world and is known as "roof of the world" and "Third Pole". Permafrost area on the plateau is estimated at 1.3X10⁶km2, approximately 70.6% of the land area of the QTP (Zhou et al., 2000).
Permafrost of the plateau is characterized by high mean annual ground temperature (MAGT) which refers to the permafrost temperature at a depth of zero annual amplitude, ranging between 0 °C and −4.0 °C,and consequently by weak thermal stability. Especially within the marginal, isolated, and warmer permafrost regions, natural ground surfaces are always in a heat-absorption state and underlying permafrost is sensitive and vulnerable to any thermal disturbance(Jin et al., 2000; Wu et al., 2010). Recent studies have demonstrated that under the combined effects of climate changes and increasing human activities, permafrost of the plateau warmed and degraded extensively during the past 40 years (Wu and Liu, 2004; Cheng and Wu, 2007; Jin et al., 2008).
With economic and social development, some transportation infrastructures, such as road and pipeline engineering, have been built during the past 60 years on the QTP. During infrastructure construction and maintenance of these projects, severe geotechnical and engineering problems occurred due to the presence of permafrost.
The Qinghai-Tibet Highway (QTH) from Golmud to Lhasa, which was built in 1954, is a vital highway connecting Tibet Autonomous Region and inland China, crossing about 750 km of permafrost regions(Wu et al., 2002). Hazard investigations on the QTH demonstrated that thawed interlayer beneath the embankment developed within 60% of highway sections,distributed mainly in high plain and intermountain basin areas. The thawed interlayer thickness is related to time of completion of the pavement, MAGT, and embankment height (Wang and Mi, 1993; Chen et al.,2014). After upgrading of asphalt pavement for the QTH in 1973, intense heat absorption capacity of black pavement altered the thermal state of permafrost and deepened the artificial permafrost table beneath the embankment, which resulted in a thawed interlayer in the permafrost beneath the embankment.
The thawed interlayer beneath the embankment refers to nonfreezing thawed soil layer between maximum frozen depth and artificial permafrost table (Wu et al., 1995; Wang et al., 2008; Liu et al., 2009). The occurrence of the thawed interlayer within the marginal, isolated and high-temperature permafrost regions means that permafrost has degraded. Under natural fields, thawed interlayer should be called talik because it is widely distributed along horizontal and vertical directions. Under the embankment, the thawed soil layer is not widespread, and thus should be appropriately called the thawed interlayer. From the definition of the thawed interlayer, it can be found that the seasonal freezing-thawing layer is above the thawed interlayer, and permafrost is under the thawed interlayer. Settlement resulting from thaw consolidation when permafrost thaws beneath the embankment mostly occur within the thawed interlayer, so formation of thawed interlayer can give rise to significant engineering problems, such as uneven settlement, longitudinal cracks and shoulder collapse (Wang et al.,2003; Xu et al., 2009). Lu and Wang (1996) concluded that liquid water within the thawed interlayer induced decline of artificial permafrost table and thickening of the thawed interlayer based on in-situ investigation data. Wu et al. (1995) proposed that formation of the thawed interlayer was connected with heat accumulation, potential effect of evaporation heat, and latent heat of free water within embankment from the point of quantity of heat. Li and Wu(1997) theoretically discussed the evolution of the thawed interlayer under asphalt pavement on the basis of approximate analytical solution of differential equation with two-dimensional phase change heat transfer. Especially, in a section of the QTH with high temperature and high ice content, the artificial permafrost table beneath the embankment continually declined with maximum decrease of about 4 m, and a thawed interlayer with considerable thickness was also formed (Liu et al., 2002; Wang et al., 2004; Chen et al., 2008). At the present time, thawing settlement of the QTH has not been completely solved due to hazards from the thawed interlayer. Therefore, the formation and distribution of the thawed interlayer and its effect on embankment stability have become an important issue for the QTH.
Permafrost in other countries, such as Russia,Canada, and the United States, is characterized by low temperature and consequently by good thermal stability. In addition, black asphalt pavement was seldom utilized in the above-mentioned countries, and so studies on thawed interlayer are rather limited (Xu et al., 2009). At the present time, more thawed interlayer relevant to engineering stability is developing beneath embankments in mid-low latitude permafrost regions of the QTP.
In this paper, dynamic characteristics of thawed interlayer and its effect on embankment settlement are investigated based on long-term ground temperature and deformation data at one monitoring site along the QTH. These results will provide a reliable series of field data for theoretical and numerical studies on embankment settlement and scientific guidance for future embankment construction and maintenance in permafrost regions.
2 Sites description and method
The monitoring site is located in a lowland south of Xieshuihe, at highway mileage K2939+185 of the QTH (Figure 1). The terrain is flat, and natural vegetation coverage is about 20%. The highway surface is black asphalt pavement, and the embankment is made up of coarse filling with a 2.2 m height on the natural surface. The site is about 100 m west of the Qinghai-Tibet Railway, another linear transportation engineering connecting Tibet Autonomous Region and inland China. The stratum and lithology from embankment surface downward are sandy gravel, gravelly sand,fine sand, mild clay with rubble and strongly weathered marlstone, respectively. High ice content permafrost including permafrost types of thin ground ice layer with soils and saturated permafrost occurs under the permafrost table. Average natural permafrost table is 1.83 m in recent decades and no thawed interlayer developed under natural field. MAGT is−0.95 °C, belonging to high temperature permafrost.
Ground temperatures and embankment deformations were monitored continuously. The left and right shoulders of the embankment are determined from Golmud to Lhasa direction, thus the left and right shoulders are always sunny and shaded, respectively.Ground temperature was measured by a string of thermistors installed in every borehole which includes natural, sunny shoulder, embankment center and shaded shoulder (Figure 2). The depth of all boreholes is 20 m. All ground temperatures were acquired by the thermistors installed at an interval of 0.5 m above 10 m depth and interval of 1.0 m below 10 m depth along the borehole. The thermistor with a precision of ±0.05 °C, was manufactured by the State Key Laboratory of Frozen Soil Engineering (SKLFSE) in China. The measurements were manually monitored twice by digital multimeters on the 5th and 20th of each month, respectively, and the monitoring duration lasted for 12 years from December 2003 to December 2015.
At the monitoring site, illustrated in Figure 2,three deformation monitoring points and one reference point were set out on the embankment surface.The monitoring points were made by 20-cm-long nails embedded into the embankment surface on the sunny shoulder, shaded shoulder and embankment centerline, respectively. The reference point was also located on the embankment shoulder. At the reference point, a longer metal rod was embedded into the embankment by 20 m deep with the upper end exposed on the embankment surface. All measurements were manually recorded monthly with relative elevations of the monitoring points and the reference point measured by electronic theodolite on the 20th of each month, with monitoring duration that lasted six years from July 2004 to December 2011. By subtracting the elevation of the monitoring point from that of the reference point, a time series of embankment deformation can be obtained from elevation differences.
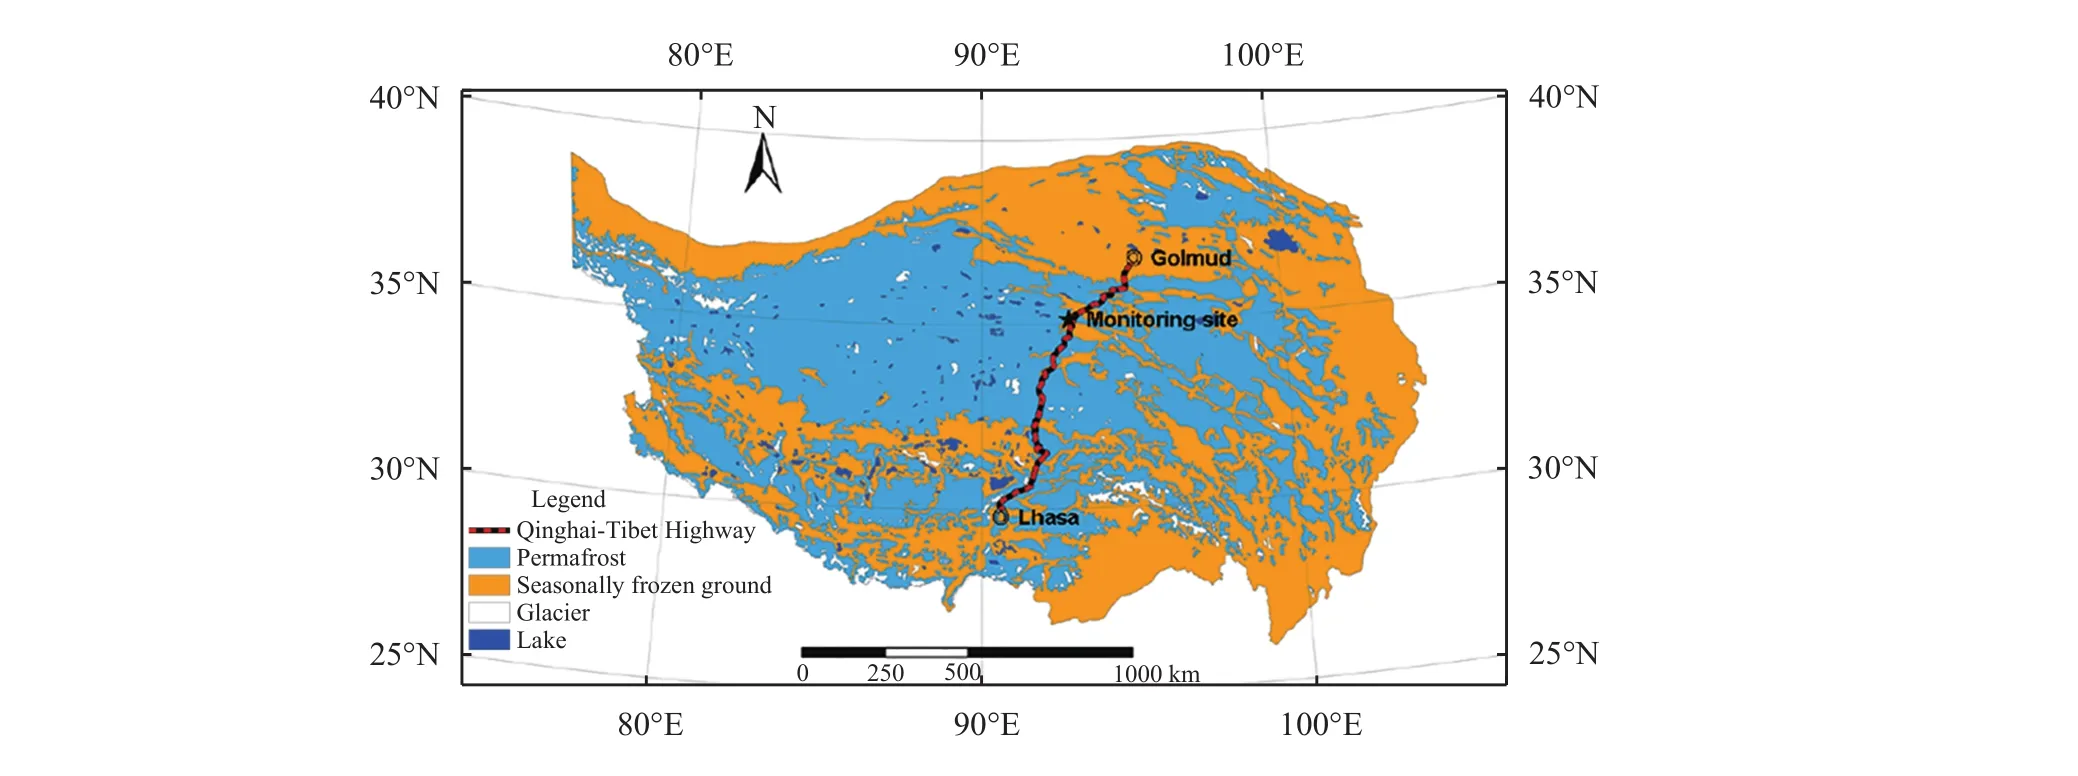
Figure 1 Map of the Qinghai-Tibet Highway and monitoring site
3 Results and analyses
3.1 Artificial permafrost table (APT)
Owing to intense heat absorption and decreasing evaporation of the asphalt pavement, APT beneath the embankment of the QTH is always changing. In this paper, APT is determined by maximum depth where 0 °C isotherms can reach under the effect of engineering activity.
Based on in-situ ground temperature, appearance of APT beneath shaded shoulder occurs from October to November of that year, but appearance of APT beneath sunny shoulder and embankment center occurs from November to December of that year. This indicates that the time reaching maximum thawing depth beneath shoulders and the embankment center are different. Figure 3 illustrates variation of APT with time beneath the embankment, and it can be found that APTs beneath the sunny shoulder and the embankment center are obviously deeper than beneath the shaded shoulder, respectively. This is because the sunny shoulder can absorb more solar radiation. APT beneath the sunny shoulder ranged from 6.39 m to 7.88 m with an average of 7.26 m, beneath the embankment center from 6.14 m to 7.84 m with an average of 7.23 m, and beneath the shaded shoulder from 2.78 m to 5.19 m with an average of 4.27 m. Figure 3 also shows that APTs exhibit a deepening trend year by year, and linear increasing rate of APTs beneath the sunny shoulder, embankment center and shaded shoulder were 11 cm/a, 14 cm/a and 18 cm/a, respectively. Based on previous research from a nearby monitoring site (Liu et al., 2014), rate of air temperature increase was 0.042 °C/a from 1970 to 2011. Climate warming and engineering effect jointly result in declining of APTs beneath the embankment.
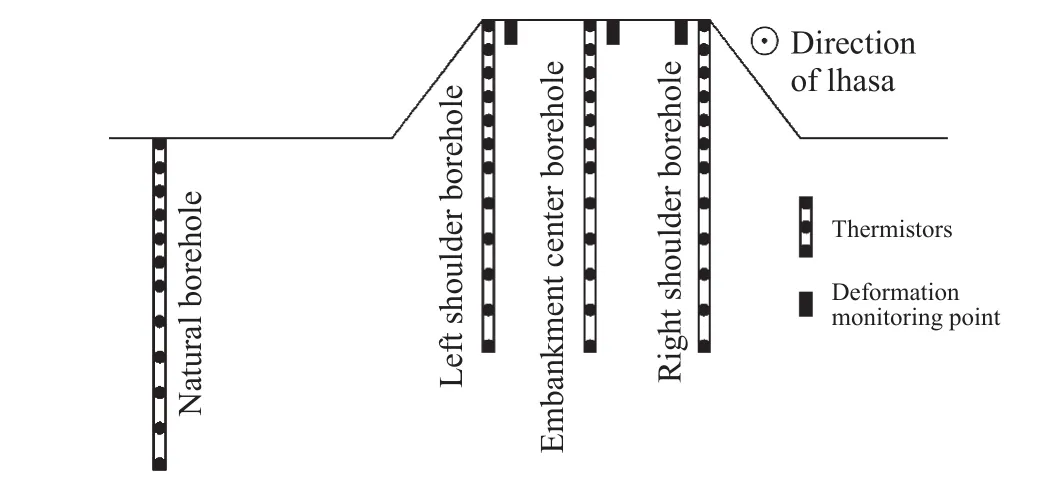
Figure 2 Sketch map of borehole distribution with thermistors and deformation monitoring points at site
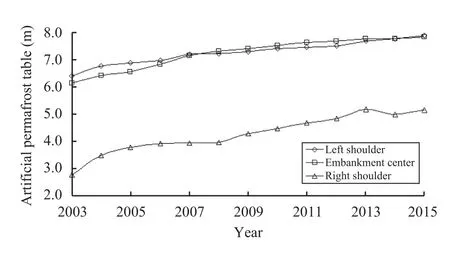
Figure 3 Variation of APT with time beneath embankment at monitoring site
3.2 Maximum frozen depth (MFD)
The freezing temperature of soil substantially refers to the freezing temperature of water in the soil,and purified water is frozen at 0 °C under standard atmospheric pressure. Because the water in soil is subject to effect of particle surface energy, salt content and external load, strictly speaking, the freezing temperature of soil is always below 0 °C. In general,MFD is used in seasonal frozen ground regions, but when the thawed interlayer occurs beneath the embankment, the soil above the thawed interlayer can be regarded as seasonal frozen ground. According to Wu and Mi (2000), the freezing temperature of soil under the embankment is decided as −0.15 °C. Based on maximum depth where −0.15 °C can reach above APT, the MFD can be calculated in all boreholes.
MFD of soil are closely related to mean annual air temperature, average air temperature in cold seasons,surface characteristic and soil properties, and it is rather sensitive to any change of external conditions.On the basis of ground temperature, appearance of MFD beneath the embankment occurred from April to June of that year. Figure 4 illustrates the variation of MFD with time beneath the embankment, and it can be found that MFD beneath embankment fluctuated.MFD is deepest beneath the shaded shoulder, second beneath the embankment center, and shallowest beneath the sunny shoulder. MFD beneath the sunny shoulder ranged from 3.36 m to 3.87 m, with an average of 3.49 m, beneath the embankment center from 3.42 m to 3.85 m, with an average of 3.73 m, and beneath the shaded shoulder from 3.85 m to 3.93 m,with an average of 3.90 m. From Figure 4, it can be found that MFD occurred at the beginning of 2011 beneath the shaded shoulder, which was later than that time for the sunny shoulder and embankment center,meaning that detachment of permafrost occurred in 2011.
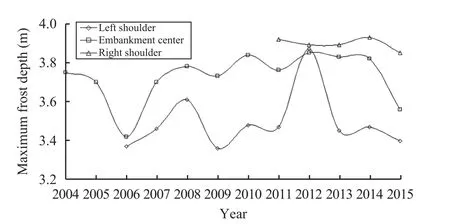
Figure 4 Variation of MFD with time beneath embankment at monitoring site
3.3 Thawed interlayer thickness (TIT)
Based on the definition of thawed interlayer, we can obtain the TIT ensuing year by using APT value in the year minus MFD value ensuing year. Figure 5 illustrates variation of TIT with time beneath the embankment, and it can be found that the thawed interlayer occurred firstly beneath the embankment center,secondly beneath the sunny shoulder and last beneath the shaded shoulder. TITs beneath the embankment center and sunny shoulder were obviously larger than that beneath the shaded shoulder, and TIT beneath the sunny shoulder was greater than that under the embankment center except in 2012. TIT beneath the sunny shoulder ranged from 3.50 m to 4.38 m with an average of 3.85 m, beneath the embankment center from 2.39 m to 4.20 m with an average of 3.45 m, and beneath the shaded shoulder from 0.55 m to 1.26 m with an average of 0.94 m. Figure 5 also shows that TITs beneath the embankment had a increasing trend year by year, and linear increasing rate of TITs be-neath the sunny shoulder, embankment center and shaded shoulder were 9 cm/a, 14 cm/a and 17 cm/a,respectively.
Magnitude of TIT depends on difference values between APT and MFD. APT with a deepening trend can increase TIT and vice versa. MFD with a deepening trend can decrease TIT and vice versa. During the period of observation, only MFD beneath shaded shoulder had a slightly decreasing trend, indicating TIT will increase. Based on variation amplitude of APT and MFD, it can be concluded that an increase of TIT mainly resulted from deepening of APT.
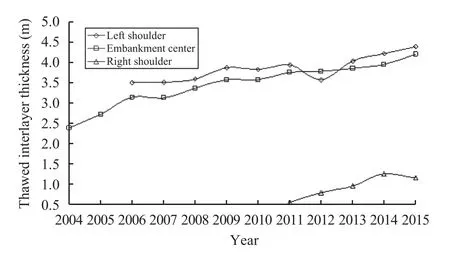
Figure 5 Variation of TIT with time beneath embankment at monitoring site
3.4 Ground temperature
Ground temperature data were collected at different depths under the embankment. Ground temperature in the shallow layer can be approximately regarded as temperature boundary condition, and can significantly affect ground temperature under the embankment surface. Meanwhile, ground temperature in the thawed interlayer is higher than the freezing temperature of soil. Ground temperature near the artificial permafrost table is directly related to the change of APT, and in turn will affect embankment settlement. Figure 6 shows the variation of ground temperature with time at different depths beneath the embankment center. It can be seen that ground temperature at 0.5 m depth fluctuated between positive and negative temperatures, and in every cycle maximum of positive temperature was apparently larger than maximum of absolute negative temperature. Ground temperature in the thawed interlayer at 6.0 m depth had an increasing trend, and it was in a positive temperature state all year round. Ground temperature near APT at 8.0 m depth also had an increasing trend.Based on multiyear ground temperatures in different depths beneath the embankment center from 2004 to 2015, the annual average ground temperatures were obtained and presented in Figure 7. The annual mean ground temperature at 0.5 m depth ranged from 3.09 °C to 4.59 °C, ground temperature in thawed interlayer at 6.0 m depth ranged from 0.01 °C to 0.89 °C, and ground temperature near APT at 8.0 m depth ranged from to −0.55 °C to −0.13 °C. Figure 7 also shows that ground temperatures beneath embankment center had an increasing trend year by year, and linear increasing rate of ground temperature at 0.5 m,6.0 m and 8.0 m deep was 0.06 °C/a, 0.07 °C/a and 0.04 °C/a, respectively, and the rate in thawed interlayer was the largest, indicating occurrence of thermal accumulation. During the same period, average ground temperature in natural borehole at 0.5 m depth is −0.27 °C. Thus, ground temperature at 0.5 m deep under embankment is 3.91 °C higher than that under natural field. It can be inferred that increasing ground temperature at shallow layer under the embankment was primary cause for development of thawed interlayer and warming of underlying permafrost.
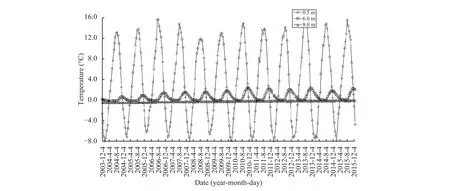
Figure 6 Variation of ground temperature with time at different depths beneath embankment center
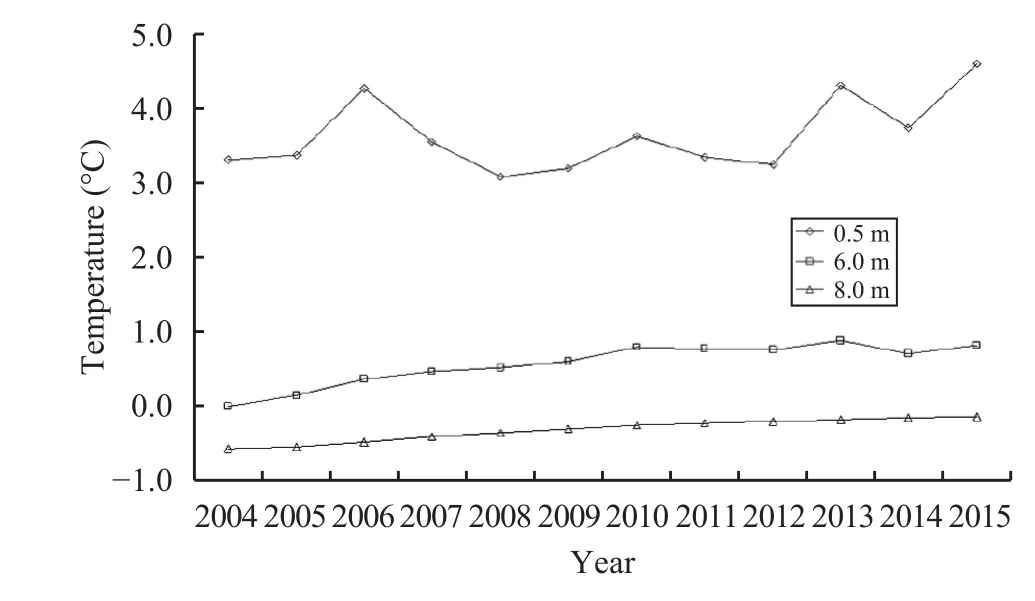
Figure 7 Annual average ground temperature at different depths beneath embankment center
Figure 8 shows the variation of ground temperature with time at 0.5 m depth beneath the sunny shoulder, embankment center and shaded shoulder.From Figure 8, ground temperature beneath the sunny shoulder and embankment center are obviously higher than that beneath the shaded shoulder which verify occurrence of thawed interlayer beneath sunny shoulder and embankment center occur before the shaded shoulder. Combining with variation of TIT beneath embankment in Figure 5, we find that formation mechanism of thawed interlayer is closely related to higher shallow ground temperature.
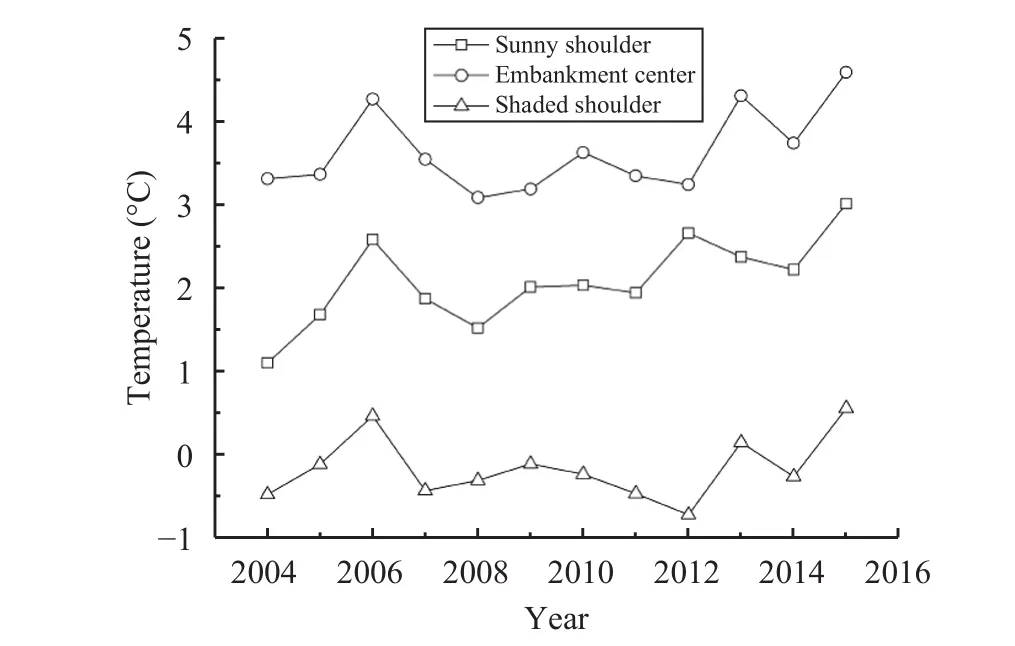
Figure 8 Variation of ground temperature with time at 0.5 m depth beneath embankment
4 Discussion
Appearance of thawed interlayer in natural fields suggests a constant degradation of permafrost within the vicinity of permafrost boundary and talik (Jin et al., 2006; Jin et al., 2007; Wu JC et al., 2010). Embankment construction of the QTH above permafrost,especially black asphalt pavement on the embankment surface, changed heat exchange relationship between ground surface and atmosphere, resulting in pronounced increase of surface temperature and then formation of heat accumulation in underlying soils.When MFD cannot connect with APT, a thawed interlayer forms under the embankment. Soil temperature within the thawed interlayer was larger than freezing temperature of soil, probably warming temperature of underlying permafrost and melting of ground ice near permafrost table consequently, resulting in decline of permafrost table and increase of TIT. Under the weight of above soil and traffic load, thawed interlayer experience consolidation settlement which is the main part of embankment deformation (Zhang et al.,2014). Furthermore, the aquifer will easily form within the thawed interlayer because surface water at toe and suprapermafrost water can penetrate into the thawed interlayer. In-situ investigation indicated that underground water developed within 40% of the thawed interlayer along the QTH in permafrost regions (Lu et al., 1997). The thawed interlayer developed with underground water can deepen artificial permafrost table, complicate thermal equilibrium state, and increase potential settlement deformation,which is detrimental to embankment stability.
Figure 9 illustrates the relationship between TIT and accumulative settlement under the embankment center from 2005 to 2011. It can be found that the accumulative settlement of embankment increased linearly with increasing TIT. During the period of July 2004 to December 2011, the accumulative settlement of embankment center approached 140 mm, which is extremely adverse for embankment stability. The thawed interlayer is closely associated with embankment settlement, while increasing thawed interlayer thickness results from the decline of artificial permafrost table, which is a similar relationship between embankment deformation and the development of the thawed interlayer or the occurrence of thaw settlement.
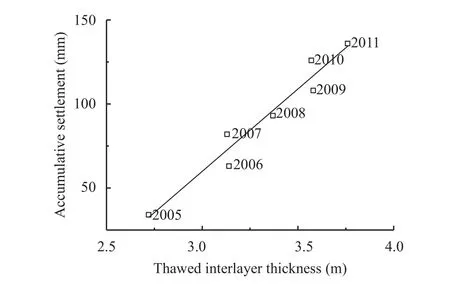
Figure 9 Relationship between TIT and accumulative settlement under embankment center
Not all embankments with thawed interlayer induce obvious deformation, while settlement is closely related to ice content of permafrost under the thawed interlayer. Greater settlement of embankment easily occurs when permafrost with high ice content exists under the thawed interlayer. For example, the Tanggula site at highway mileage K3312+000 along the QTH, where ice with ground and saturated permafrost developed with thawed interlayer under embankment, the embankment settlement was approximately 270 mm with no slowing trend from 2003 to 2011(Yuan et al., 2013). The embankment settlement was smaller when permafrost with low ice content existed under the thawed interlayer. For example, the Kekexili site at highway mileage K3022+780 along the QTH, where ice-poor permafrost developed and thawed interlayer thickness was about 4.2 m, the settlement was only 6 mm from 2010 to 2011 (Yu et al.,2013).
In the process of engineering practice, we should pay close attention to the thawed interlayer with high ice content permafrost below due to its effect on embankment stability. In the operation maintenance of the QTH, such strengthened measures include inserting thermosyphons at shoulders and toes of embankment, and placing crushed rock on embankment slopes. Adopting these measures allow the thawed interlayer to refreeze as soon as possible, ensuring embankment stability.
5 Conclusions
Based on the data of ground temperature and deformation monitored at Xieshuihe monitoring site along the Qinghai-Tibet Highway in permafrost regions from 2004 to 2015, some conclusions can be drawn as follows.
(1) Maximum thawing depth beneath the embankment occurred in October to December of that year.APT beneath the embankment had a deepening trend,and linear increasing rates of APT beneath the sunny shoulder, embankment center and shaded shoulder were 11 cm/a, 14 cm/a and 18 cm/a, respectively.
(2) Maximum freezing depth beneath the embankment occurred in April to June of that year. From 2004 to 2015, average maximum freezing depth were 3.49 m, 3.73 m and 3.90 m beneath the sunny shoulder, embankment center and shaded shoulder,respectively. Meanwhile, maximum freezing depth had no obvious change trend.
(3) Thawed interlayer thickness had an increasing trend year by year, and linear increasing rates beneath the sunny shoulder, embankment center and shaded shoulder were 9 cm/a, 14 cm/a and 17 cm/a,respectively. The increasing of thawed interlayer thickness mainly resulted from the deepening of artificial permafrost table beneath the embankment.
(4) Mean annual ground temperature at 0.5 m depth beneath the embankment center was 3.91 °C greater than that under the natural field. The rising of ground temperature at shallow part of embankment resulted in the development of thawed interlayer beneath the embankment and warming of underlying permafrost.
(5) Thawed interlayer is closely associated with embankment settlement. Greater settlement easily occurs when permafrost with higher ice content exists under the thawed interlayer, and in turn the settlement is smaller when permafrost with lower ice content exists under the thawed interlayer.
Acknowledgments:
This work was supported by the National Natural Science Foundation of China (No. 41571064), the Key Program of National Natural Science Foundation of China (No. 41630636), and the Independent Research of the State Key Laboratory of Frozen Soil Engineering (No. SKLFSE-ZT-09).
Cheng GD, Wu TH, 2007. Responses of permafrost to climate change and their environmental significance, Qinghai–Tibet Plateau.Journal of Geophysical Research, 112: 1–10. DOI: 10.1029/2006JF000631.
Chen DG, Wang SJ, Chen JB, et al., 2014. Study of the factors influencing the thickness of residual thawed interlayer and cooling effect of block-stone embankment. Journal of Glaciology and Geocryology, 36(4): 854–861. (in Chinese)
Chen JB, Wang SJ, Zhang JZ, et al., 2008. Formation and mechanism of high subgrade diseases of Qinghai-Tibet Highway. Journal of Chang'an University (Natural Science Edition), 28(6): 30–35.(in Chinese)
Jin HJ, Zhao L, Wang SL, et al., 2006. Thermal regimes and degradation modes of permafrost along the Qinghai-Tibet Highway. Science in China (Series D: Earth Sciences), 49(11): 1170–1183.
Jin HJ, Yu QH, Lv L, et al., 2007. Degradation of permafrost in the Xing'anling Mountains, Northeastern China. Permafrost and Periglacial Processes, 18: 245–258. DOI: 10.1002/ppp.589.
Jin HJ, Yu QH, Wang SL, et al., 2008. Changes in permafrost environments along the Qinghai-Tibet engineering corridor induced by anthropogenic activities and climate warming. Cold Regions Science and Technology, 53(3): 317–333. DOI: 10.1016/j.coldregions.2007.07.005.
Jin HJ, Li SD, Wang SL, et al., 2000. Impacts of climatic changes on permafrost and cold regions environments in China. Acta Geologca Sinca, 55(2): 161–173.
Li SX, Wu ZW, 1997. The change of thaw bulb under asphalt pavement in the region of permafrost on the Tibetan Plateau. Journal of Glaciology and Geocryology, 19(2): 133–140. (in Chinese)
Liu MH, Sun ZZ, Niu FJ, et al., 2014. Variation characteristics of the permafrost along the Qinghai-Tibet Railway under the background of climate change. Journal of Glaciology and Geocryology, 36(5):1122–1130. (in Chinese)
Liu YZ, Wu QB, Zhang JM, et al., 2002. Deformation of highway roadbed in permafrost regions of the Tibetan Plateau. Journal of Glaciology and Geocryology, 24(1): 10–15. (in Chinese)
Liu G, Zhang JZ, Zhu DP, et al., 2009. Research of subgrade damages caused by the thaw layer and their disposal measures in permafrost regions. In: Proceedings of the 8th International Symposium on Permafrost Engineering. Lanzhou: Lanzhou University Press, pp.286–289.
Lu X, Wang SL, 1996. Investigation of ground water in embankment of Qinghai-Tibet Highway in permafrost region. In the Proceedings of the 5th Chinese Conference on Glaciology and Geocryology. Lanzhou: Gansu Culture Press, pp. 1179–1184. (in Chinese)
Wang SL, Niu FJ, Zhao L, et al., 2003. The thermal stability of roadbed in permafrost regions along Qinghai–Tibet Highway. Cold Regions Science and Technology, 37: 25–34. DOI: 10.1016/S0165-232X(03)00011-9.
Wang SJ, Huo M, Zhou W, 2004. Subgrade failure of Qinghai-Tibet Highway in permafrost area. Highway, (5): 22–26. (in Chinese)
Wang SJ, Li ZL, Zhang JZ, et al., 2008. Highway Construction Technology on Permafrost Regions. Beijing: China Communications Press, pp. 41–45. (in Chinese)
Wang SL, Mi HZ, 1993. The change of permafrost under roadbed with asphalt pavement along the Qinghai-Tibet Highway. Journal of Glaciology and Geocryology, 15(4): 566–573. (in Chinese)
Wu QB, Liu YZ, Zhang JM, et al., 2002. A review of recent frozen soil engineering in permafrost regions along Qinghai–Tibet Highway,China. Permafrost and Periglacial Processes, 13: 199–205. DOI:10.1002/ppp.420.
Wu JC, Sheng Y, Wu QB, et al., 2010. Processes and modes of permafrost degradation on the Qinghai-Tibet Plateau. Science in China(Series D: Earth Sciences), 53(1): 150–158.
Wu QB, Liu YZ, 2004. Ground temperature monitoring and its recent change in Qinghai–Tibet Plateau. Cold Regions Science and Technology, 38(2–3): 85–92. DOI: 10.1016/S0165-232X(03)00064-8.
Wu QB, Mi HZ, 2000. Changes and control propose of frozen ground process in permafrost regions along the Qing-Tibet Highway. Hydrogeololgy and Engineering Geology, (2): 14–17. (in Chinese)
Wu QB, Tong CJ, Mi HZ, 1995. Changing characteristics of seasonal active layer under asphalt in Qinghai-Tibet Highway. Journal of Xi'an Highway University, 12(4): 1–5. (in Chinese)
Wu QB, Zhang TJ, Liu YZ, 2010. Permafrost temperatures and thickness on the Qinghai–Tibet Plateau. Global and Planetary Change,72(1–2): 32–38. DOI: 10.1016/j.gloplacha.2010.03.001.
Xu BK, Ding JK, Xiong ZW, 2009. Preliminary study on thaw trough beneath Qinghai-Tibet Highway in permafrost regions. Subgrade Engineering, 143(2): 145–146. (in Chinese)
Yu F, Qi JL, Yao XL, et al., 2013. In-situ monitoring of settlement at different layers under embankments in permafrost regions on the Qinghai–Tibet Plateau. Engineering Geology, 160: 44–53. DOI:10.1016/j.enggeo.2013.04.002.
Yuan K, Zhang JZ, Zhu DP, 2013. Analysis of deformation characteristics of embankment with deep permafrost table and degenerative permafrost. Rock and Soil Mechanics, 34(12): 3543–3548.(in Chinese)
Zhang QL, Li N, Ma W, et al., 2014. Analyses of the thawing consolidation of fill embankment in warm permafrost regions. Journal of Glaciology and Geocryology, 36(3): 614–621. (in Chinese)
Zhou YW, Guo DX, Qiu GQ, et al., 2000. Geocryology in China.Beijing: Science Press, pp. 43–44. (in Chinese)
: Sun ZZ, Wang HL, Feng WJ, et al., 2017. Characteristics of thawed interlayer and its effect on settlement beneath embankment in permafrost regions-A case study for the Qinghai-Tibet Highway. Sciences in Cold and Arid Regions, 9(5): 0447–0454.
10.3724/SP.J.1226.2017.00447.
*Correspondence to: ZhiZhong Sun, State Key Laboratory of Frozen Soil Engineering, Northwest Institute of Eco-Environment and Resources, Chinese Academy of Sciences. No. 320, West Donggang Road, Lanzhou, Gansu 730000, China.E-mail: sun@lzb.ac.cn
January 16, 2017 Accepted: April 18, 2017
杂志排行

Sciences in Cold and Arid Regions的其它文章
- The temporal and spatial variation of positive degree-day factors on the Koxkar Glacier over the south slope of the Tianshan Mountains, China, from 2005 to 2010
- Changes of glacier area in the Xiying River Basin,East Qilian Mountain, China
- A mathematical approach to evaluate maximum frost heave of unsaturated silty clay
- Chemistry and environmental significance of aerosols collected in the eastern Tianshan
- Contamination and risk assessment of heavy metals in farmland soils of Baghrash County, Xinjiang,Northwest China
- Complex network analysis of climate change in the Tarim River Basin, Northwest China