A mathematical approach to evaluate maximum frost heave of unsaturated silty clay
2017-11-17LinGengXianZhangLingLiangTangJunLuoXiuLiDu
Lin Geng , XianZhang Ling , Liang Tang *, Jun Luo , XiuLi Du
1. Beijing Key Lab of Earthquake Engineering and Structural Retrofit, Beijing University of Technology, Beijing 100124,China
2. School of Civil Engineering, Harbin Institute of Technology, Harbin, Heilongjiang 150090, China
3. State Key Laboratory of Frozen Soil Engineering, Cold and Arid Regions Environmental and Engineering Research Institute, Chinese Academy of Sciences, Lanzhou, Gansu 730000, China
A mathematical approach to evaluate maximum frost heave of unsaturated silty clay
Lin Geng1,2,3, XianZhang Ling2,3, Liang Tang2,3*, Jun Luo2,3, XiuLi Du1
1. Beijing Key Lab of Earthquake Engineering and Structural Retrofit, Beijing University of Technology, Beijing 100124,China
2. School of Civil Engineering, Harbin Institute of Technology, Harbin, Heilongjiang 150090, China
3. State Key Laboratory of Frozen Soil Engineering, Cold and Arid Regions Environmental and Engineering Research Institute, Chinese Academy of Sciences, Lanzhou, Gansu 730000, China
Maximum frost heave of unsaturated frost-susceptible soils, in conjunction with a high water table, is an important consideration for the design of foundations in seasonally frozen regions. Therefore, it is necessary to evaluate accurately and efficiently the maximum frost heave for a given soil. For this purpose, a series of one-sided freezing experiments was conducted on unsaturated silty clay in an open system. Multistage cooling of sufficient duration was applied to the soil sample's top, while constant above-zero temperatures were maintained at the bottom. Then, a simple methodology for calculating maximum frost heave at a given cooling temperature was derived utilizing information obtained within the limited time allotted for each stage. On this basis, an empirical equation for defining maximum frost heave as a function of cooling temperature and overburden pressure was determined. Overall, this study provides a simple and practical procedure that is applicable to the evaluation of maximum frost heave of unsaturated frost-susceptible soils.
mathematical approach; maximum frost heave; multistage freezing experiment; unsaturated silty clay
1 Introduction
In regions with seasonally frozen ground or permafrost, frost heave is an uneven upward movement of the ground surface during extended exposure to subfreezing temperatures (Cheng and He, 2001; Xu et al., 2001). Experimental observations indicate that when fine-grained soils, usually called frost-susceptible soils, are subjected to subfreezing temperatures,substantial frost heave may be observed in the field or laboratory (Konrad and Morgenstern, 1980; Sheng et al., 2013). Frost heave is attributed to the solidification of a portion of the water in soil pores and is associated with water migration, particularly in the presence of adequate water supply (Zhao et al., 2009;Zhou and Li, 2012).
In practice, the detrimental effect of frost action in frost-susceptible soils is an inevitable and significant concern in geotechnical engineering (Penner and Ueda, 1977; Peppin et al., 2011). In general, frost heave in cold regions is a primary cause of damage that can lead to the failure of various types of infrastructure such as roadways, bridges, pipelines, and foundations. Failures primarily occur when footings are located in frost-susceptible soils above the final frost-penetration line (Everett, 1961; Wang and Hu,2004; Abzhalimov and Golovko, 2009).
For this reason, numerous efforts have been made over decades to explain the frost heave mechanism of a variety of soils; these efforts have included laboratory tests on small specimens, model experiments, and field investigation (Taber, 1930; Singh and Chaudhary, 1995; Ma and Wang, 2012; Zheng and Kanie,2015). Recently in China, there has been renewed interest in researching the frost-heave mechanism and its adverse effects on engineering in frost-susceptible soils (Zhou and Zhou, 2012; Lai et al., 2014; Ma et al., 2015).
In this regard, typical methods to estimate the amount of frost heave are based on assumptions about saturated soils; proposed methods include the capillary model, the rigid-ice model, the segregation-potential model, thermo-mechanical models, and the semi-empirical model (O'Neil and Miller, 1985; Fremond and Mikkola, 1991; Nixon, 1991; Black, 1995;Michalowski and Zhu, 2006). Most of these approaches, requiring the use of many parameters, virtually explain the complicated phenomenon of saturated soils to predict accurately the amount of frost heave. However, these models may inherently show reduced accuracy when applied to the engineering problem of predicting frost-heave amounts of unsaturated soils. In this work, a series of one-sided,multistage freezing experiments involving an unsaturated silty clay column in an open system were conducted. Here, experimental results are presented and analyzed. On this basis, a mathematical procedure is proposed to predict the maximum frost heave with satisfactory accuracy and simplicity. Finally, some conclusions are drawn and future research directions proposed.
2 Test and materials
2.1 Sample preparations
Frost-susceptible silt clay obtained from the city of Harbin in Northeast China was used to prepare all reconstituted samples. A grain-size distribution of this clay is shown in Figure 1; and the clay exhibits the following grain-size characteristics: curvature coefficient, Cc=1.25; soil non-uniformity index, 10.04; and plasticity index, 11.57%. All circular solid samples were prepared with a diameter of 10 cm and height of 15 cm. These soil samples were compacted using slight vibration at an optimal moisture content of approximately 14% to achieve a density of about 1,670 kg/m3. The degree of saturation of the soil samples was 59%.
2.2 Equipment
Figure 2 shows the experiment setup. The apparatus includes four main components: temperature control, water supply, loading, and data acquisition (Figure 3). The surface of the inner container was covered with Vaseline to minimize side friction and adhesion between the sample and the container. Before testing,the sample was placed into a plexiglas container with inner dimensions of 20 cm in height and 10 cm in diameter. To enhance the cooling efficiency, the container circumference was insulated with a 50-mm-thick layer of insulating Styrofoam. All prepared specimens in the container were placed in a temperature chamber to avoid heat loss and kept at a constant environmental temperature of −2 °C.
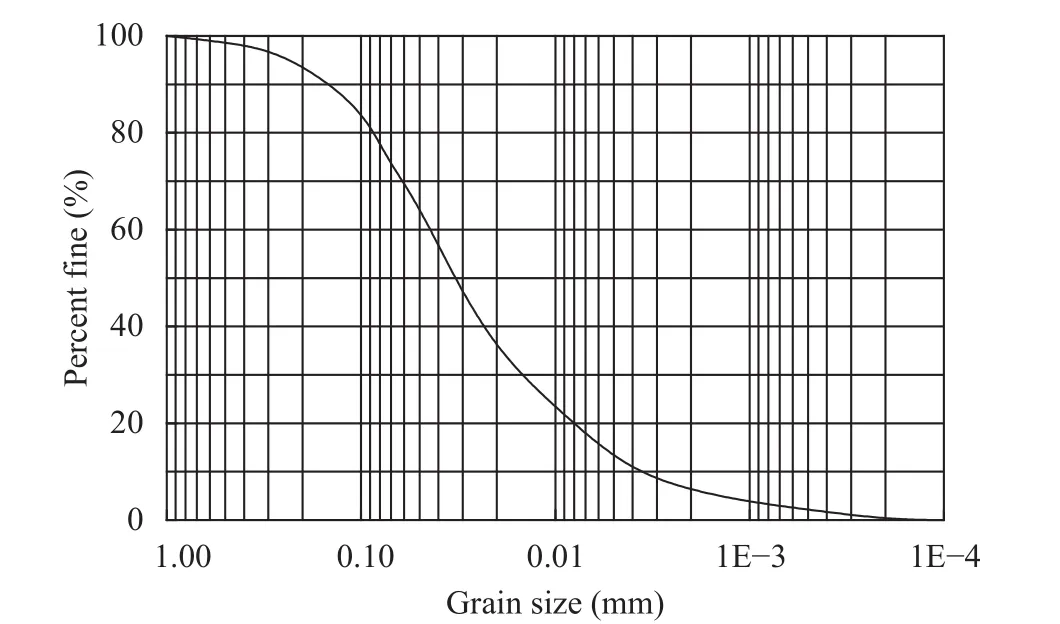
Figure 1 Grain size distribution of the silty clay
Alcohol, at temperatures ranging from −40 °C to+30 °C with an accuracy of ±0.1 °C, was used as the controlled liquid circulating through the plate (Figure 3). Throughout the test, the tops of the samples were the cooling end, subjected to subzero temperatures(Tc) through a copper plate; the bottoms of the samples were the warm end, subjected to the abovezero temperature (Tw), 2 °C, through another copper plate.
Additionally, the water-supplement system had a Mariotte flash connected to the bottom plate through a plastic tube. In all experiments, an unpressurized water-supplement process was employed.
2.3 Determination of freezing duration and test procedures
There were six freezing-test cases (i.e., Cases FT0 to FT5) conducted in this study (Table 1). Various overburden-stress conditions were enforced on the top of the soil column. All test specimens began to freeze after standing for 24 hours under corresponding load with no water supplement. A displacement transducer was installed at the plate to continuously monitor the accumulated frost heave at the specimen surface. The side of the container included four holes, accommodating four thermistors for each sample. These thermistors were inserted laterally through the holes, approx-imately 3 cm into the sample, at 3-cm intervals to measure internal soil temperature (Tsoil); two additional thermistors were placed at the top and bottom of each sample.
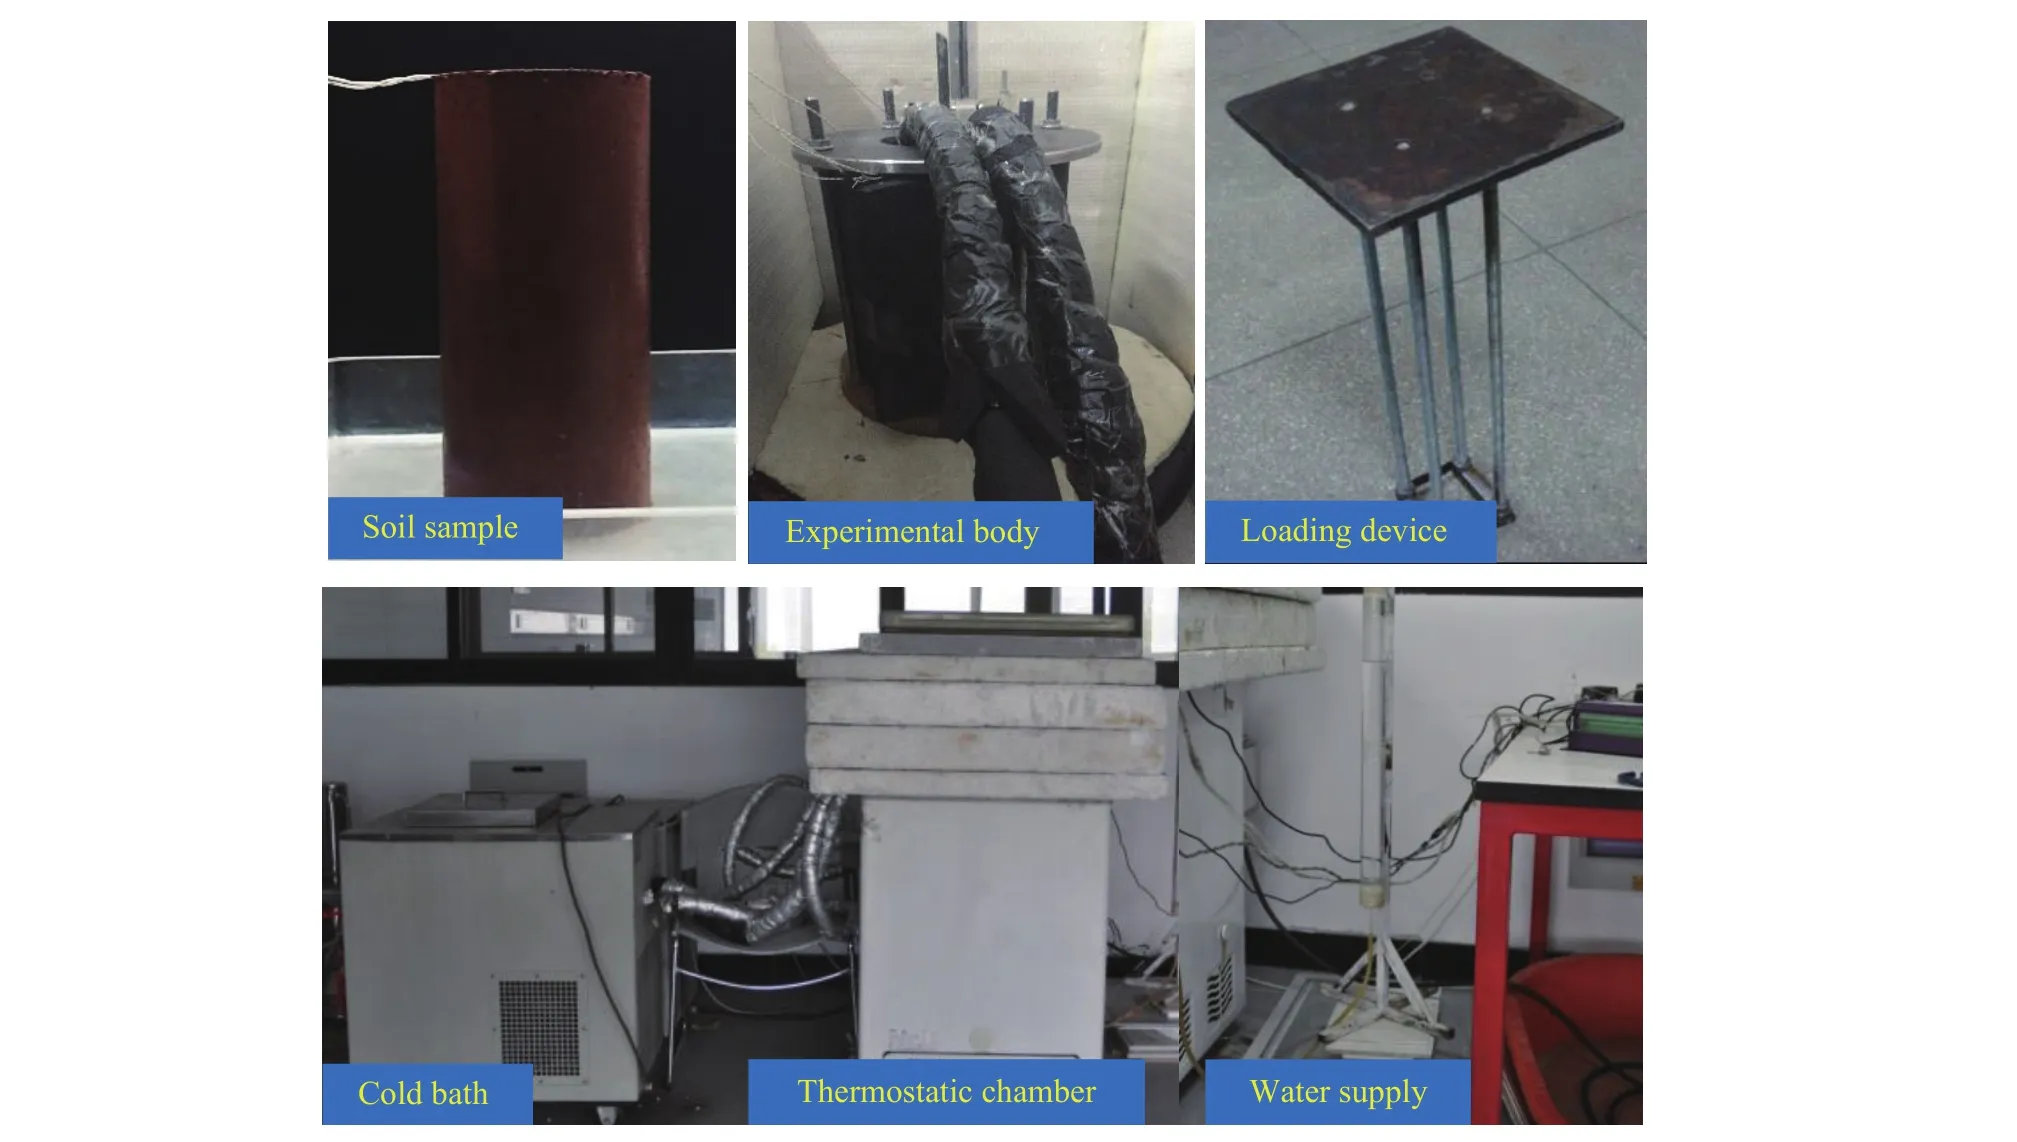
Figure 2 Experiment setup
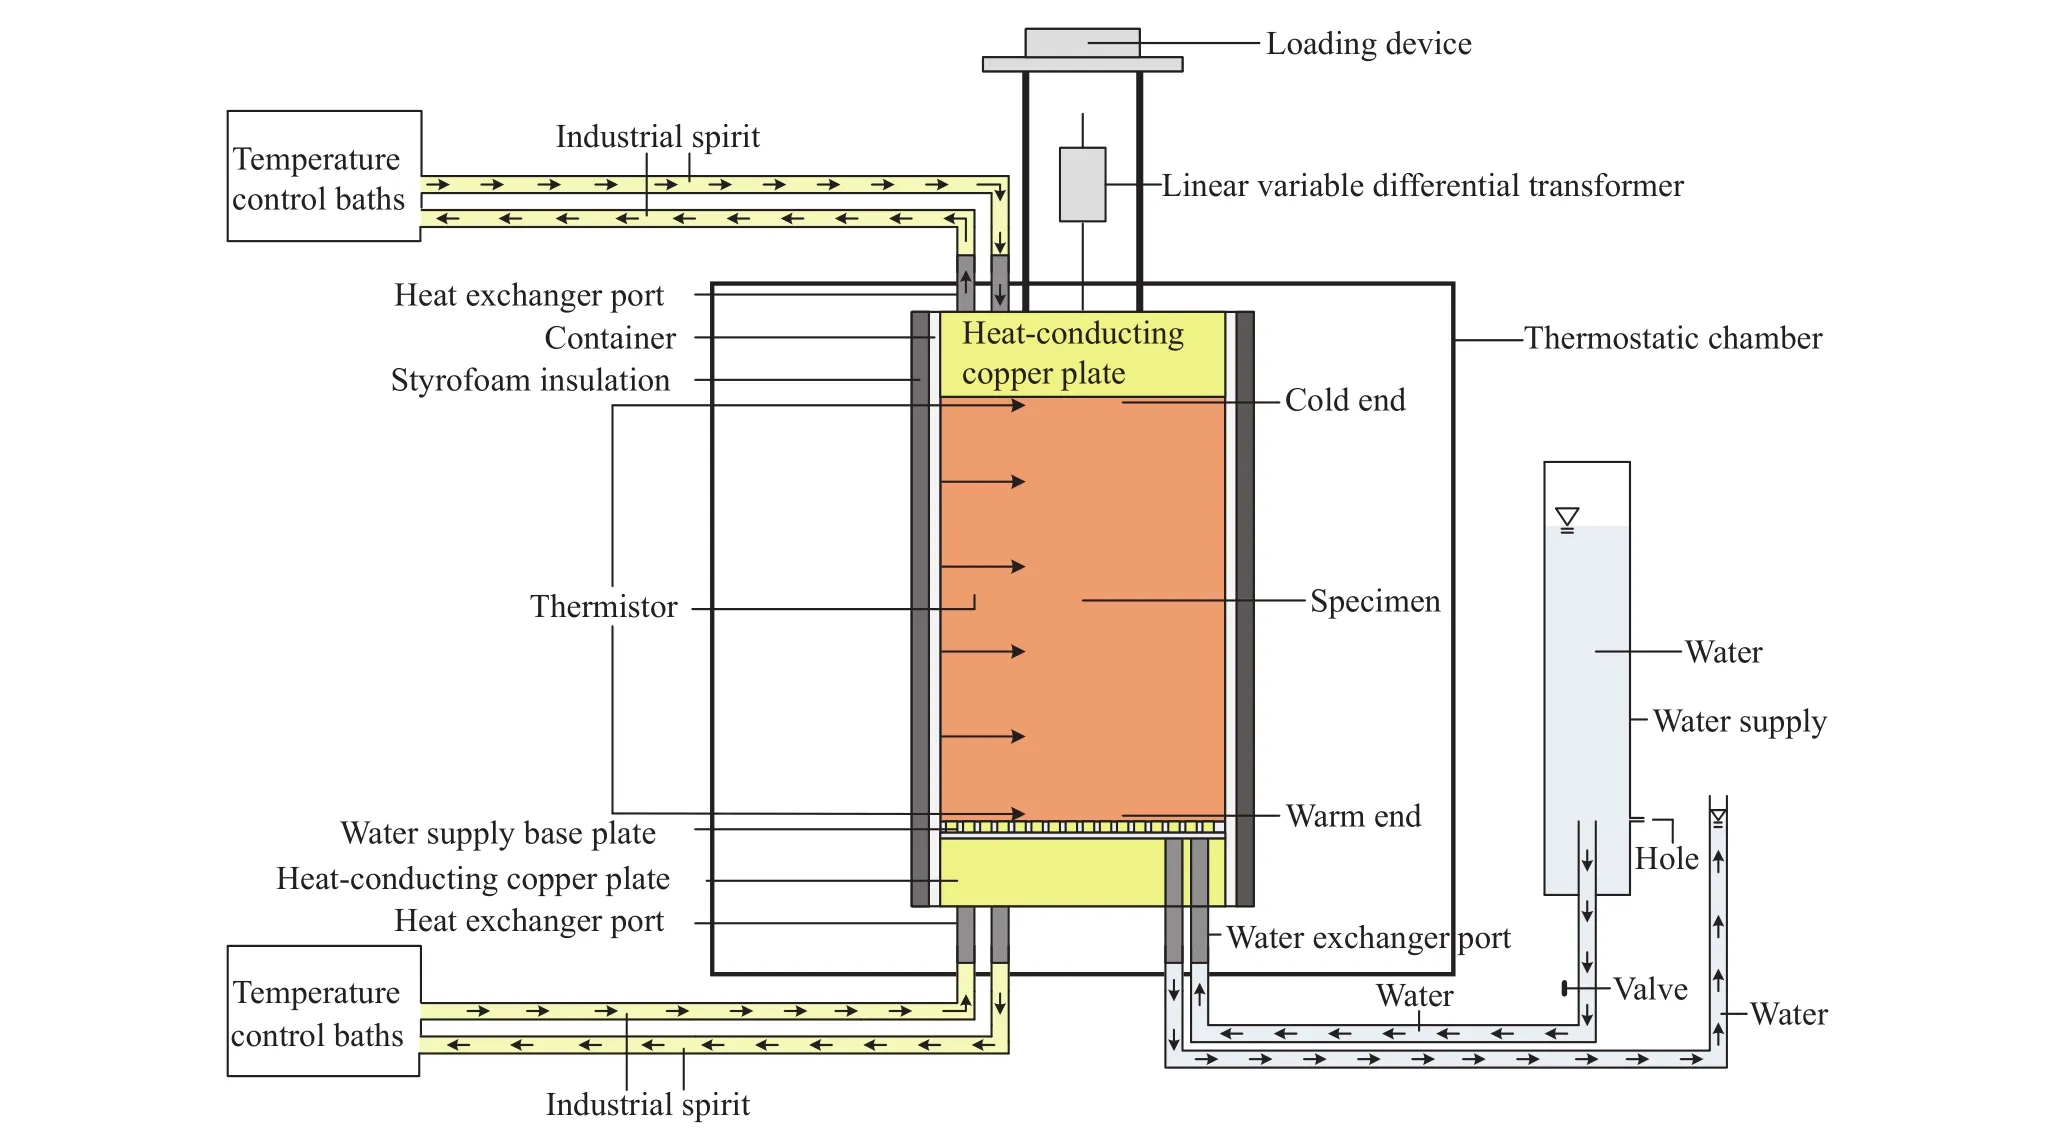
Figure 3 Schematic diagram of the experiment apparatus
Usually, evaluating maximum frost heave requires the maximum possible time duration at a given Tc. To minimize and reasonably determine freezing duration, the top of the sample in Case FT0 was successively cooled to a Tcof −5 °C over a 168-hour period. The frost heave and frost-heave rate with time elapsed in Case FT0 are presented in Figure 4. For ease of presentation, experimental data for frost heave is marked as S(t), where t is the freezing duration.From Figure 4, frost heave, SFT0(t), accumulated with t and approached a maximum value as the t approached 168 hours of freezing. Nevertheless, the frost-heave rate, dS(t)/dt, gradually reduced as t lapsed; and it tended toward zero by the end of the freezing period (i.e., t=168 hours). Using data of SFT0(t), a straight line is obtained by plotting 1/S(t)versus 1/t in Figure 5. Thus, the relationship between S(t) and t through the freezing period could be approximately expressed using a hyperbolic form.
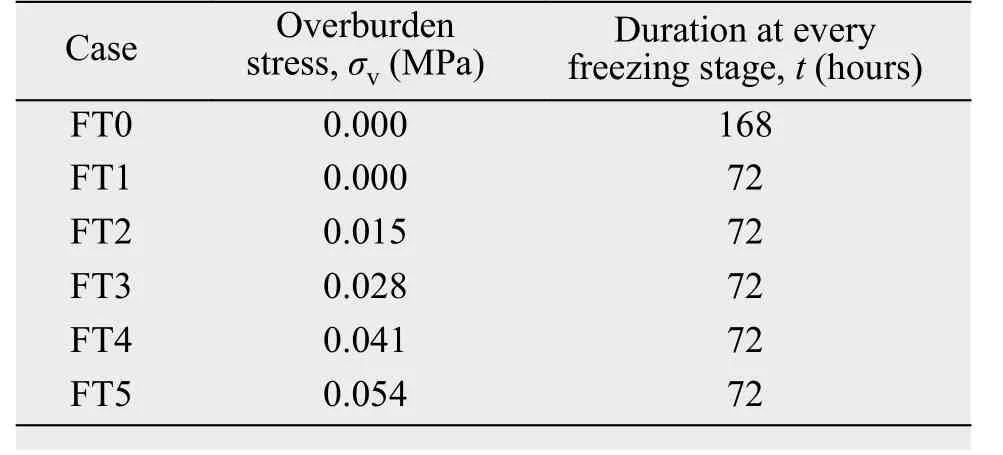
Table 1 Experiment cases
Further, the correlation between frost heave and freezing time for various ranges of elapsed time is shown in Figures 6a to 6g. From these figures, we see a correlation by using just the data from 0 to 72 hours;thus, the validity of the function and parameters used is confirmed. For this purpose, the 72-hour freezing duration for every stage in the following multistage freezing test cases was determined.
In Cases FT1 to FT5, identical thermal conditions,i.e., Stage 1 to Stage 4 (Figure 7), were applied to the samples. The top of each sample was successively cooled through one copper plate to various freezing temperatures of 0 °C, −5 °C, −10 °C, −15 °C,and −20 °C, stage by stage; and each freezing stage had a 72-hour duration.
3 Mathematical procedures
3.1 Analysis of experimental results
Figure 8 comprises the frost-heave time histories(i.e., SFT0(t) and SFT1(t)) in cases FT0 and FT1. It was found that the maximum frost heave was not attained by the end of every freezing stage in Case FT1. The recorded frost heave, S(t), versus time for Cases FT1 to FT5 is illustrated in Figure 9, in which each freezing interval is 72 hours. For each freezing stage, a similar trend of the frost heave under various overburden stresses was observed, at first accumulating rapidly and then more slowly until freezing ended. As Tcwas decreased from one stage to the next, frost heave demonstrated a slight but abrupt increase.
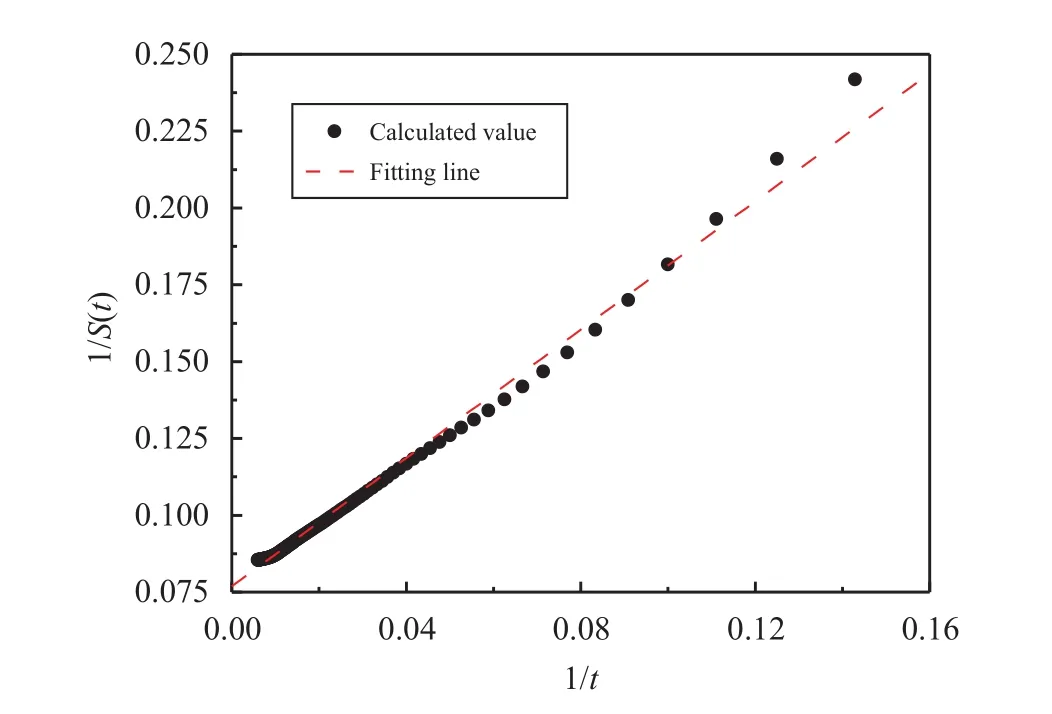
Figure 5 Variation of 1/S(t) versus 1/t(t varies in the range of 0~12 hours)
Frost-heave amounts under overburden stresses(σv) of 0.000 MPa, 0.015 MPa, 0.028 MPa, 0.041 MPa,and 0.054 MPa attained 18.1 mm, 15.1 mm, 13.0 mm,11.4 mm, and 10.0 mm, respectively, by the end of freezing (i.e., t=288 hours). Less frost heave occurred as the overburden stress (σv) increased, indicating that the reduction in frost heave maybe due to increasing σvat the sample surface. It may be that water was inhibited from entering into the soil due to the increase of σv.
3.2 Formulation of equation for frost-heave increment due to change of Tc
Maximum frost heave is a critical parameter for the design of foundations in frozen regions (Singh and Chaudhary, 1995; Peppin et al., 2011; Sheng et al.,2013). A new approach is firstly proposed to evaluate maximum frost heave by determining the appropriate equation for the relationship between incremental frost heave (ΔS) induced by the change of Tcand t,utilizing information obtained during the each stage.
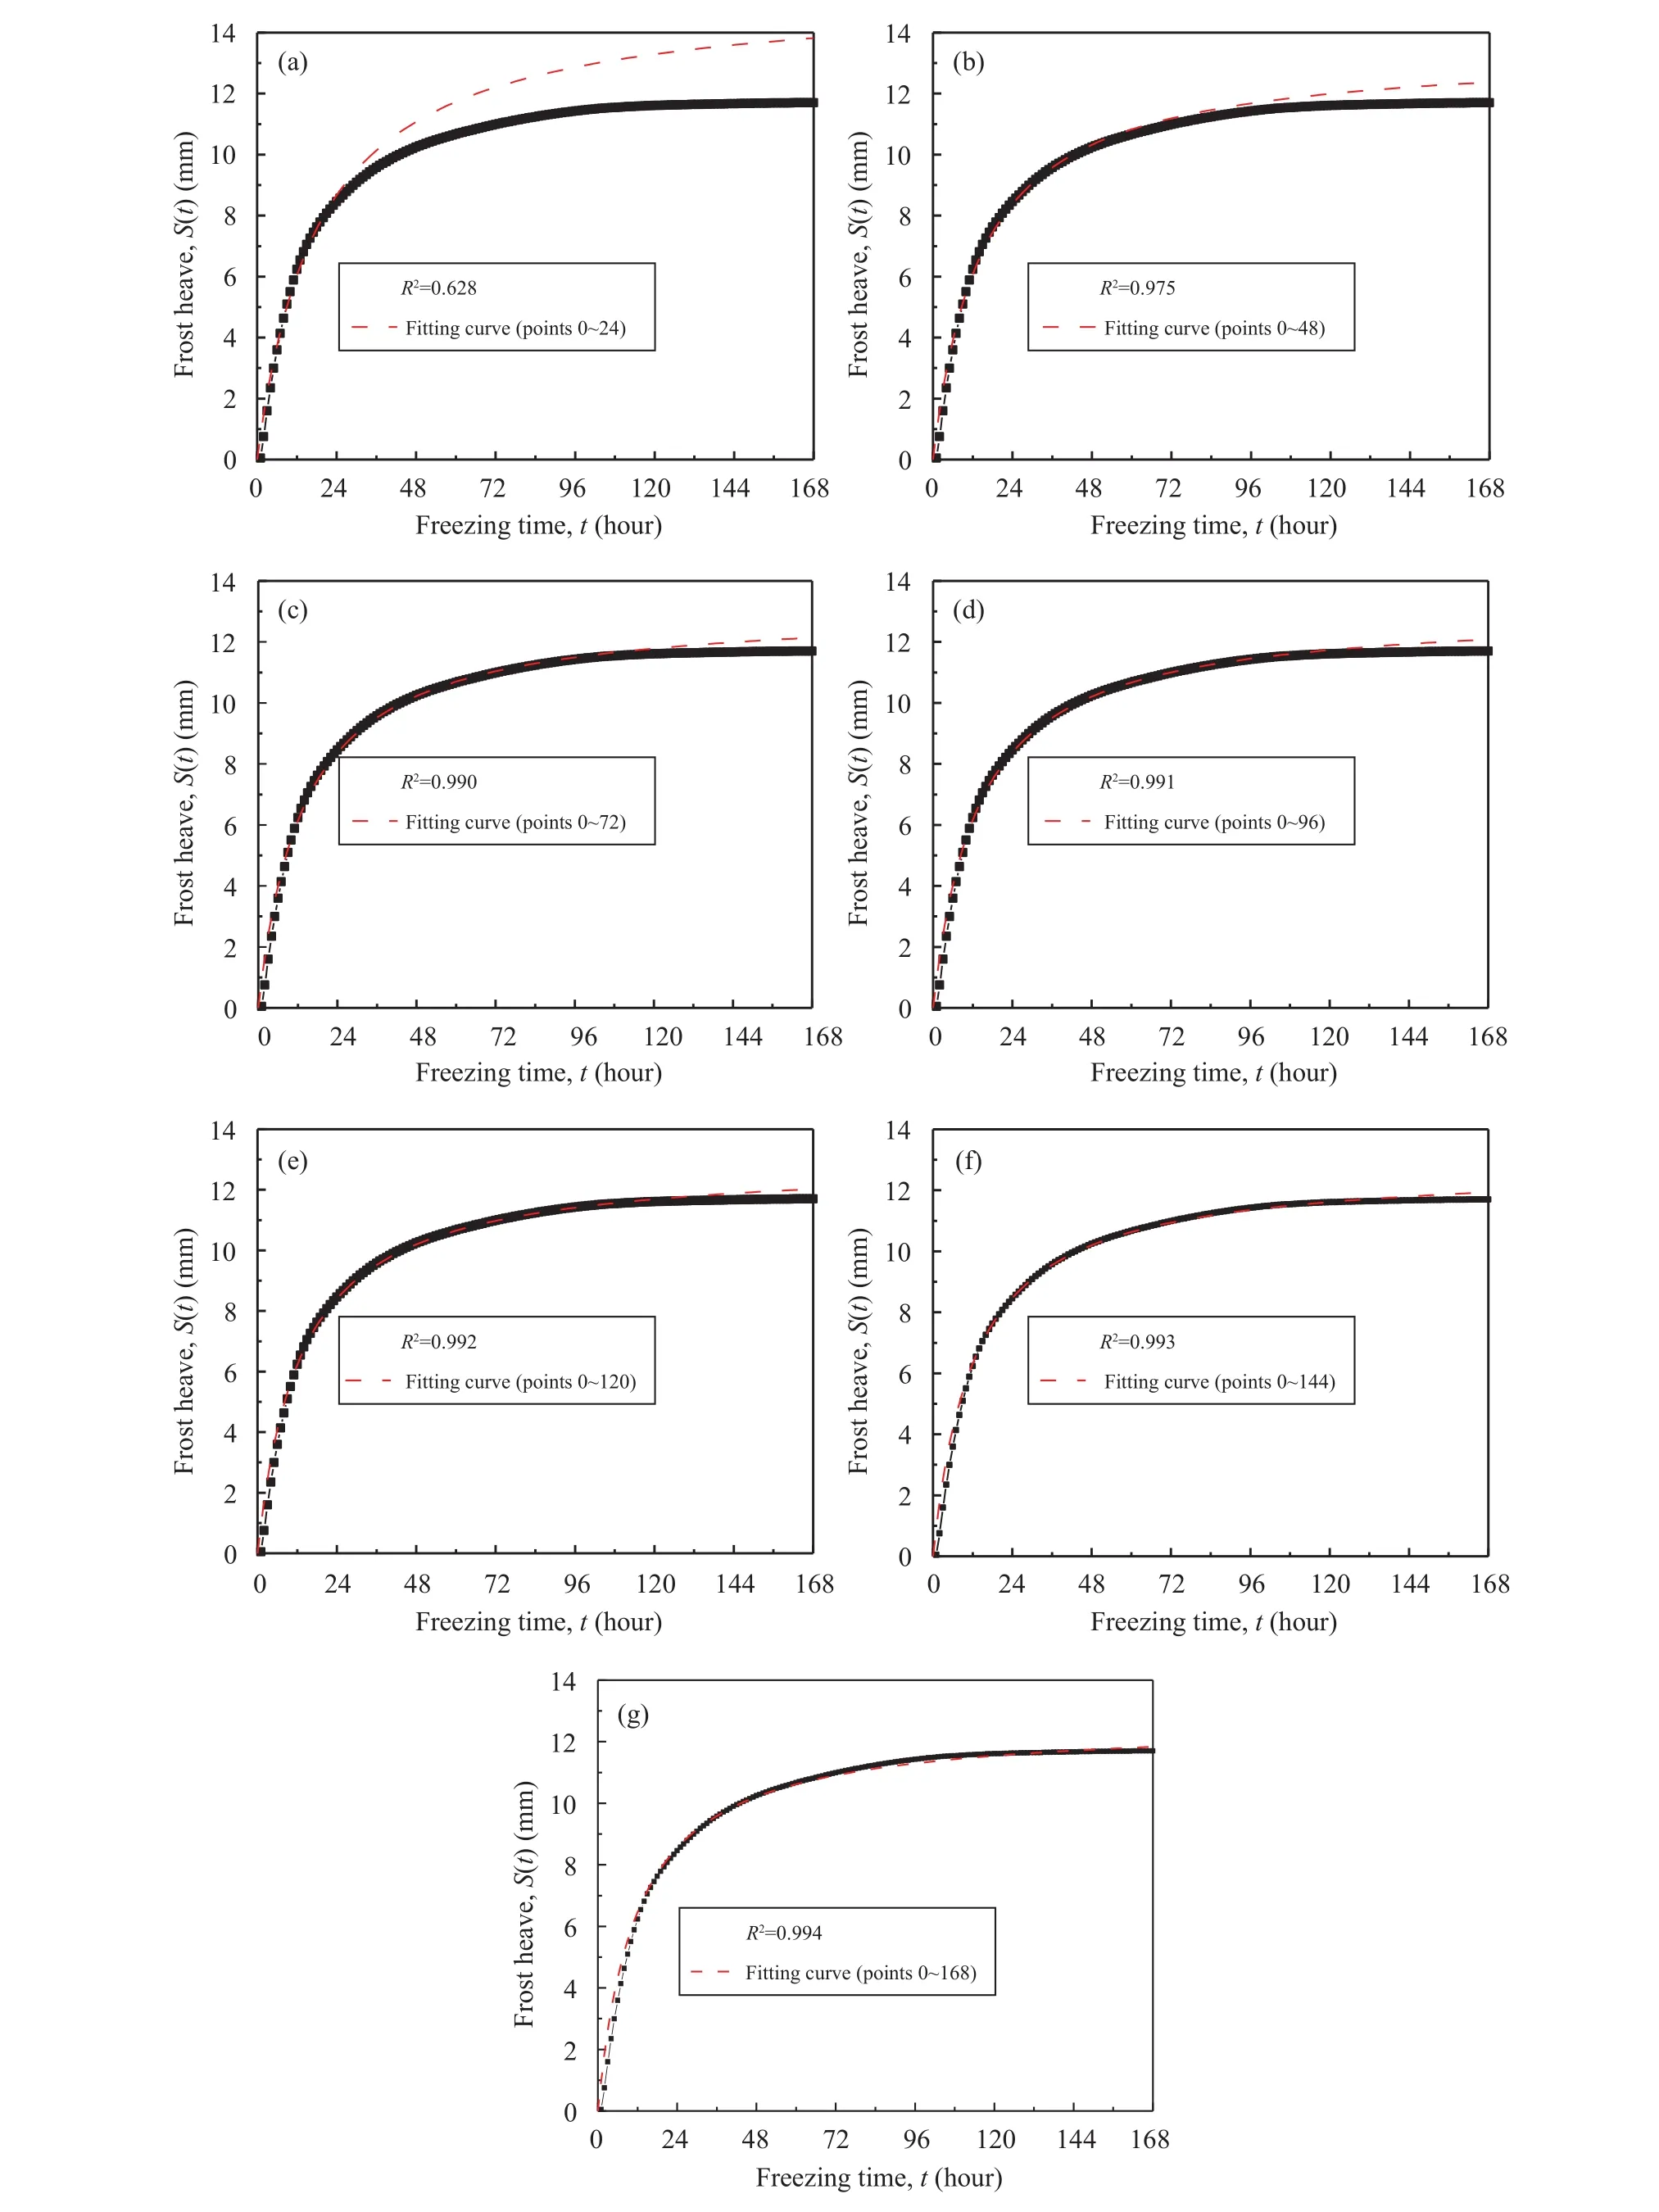
Figure 6 Correlation between frost heave and time elapsed using data from (a) 0~24 hours; (b) 0~48 hours; (c) 0~72 hours;(d) 0~96 hours; (e) 0~120 hours; (f) 0~144 hours; and (g) 0~144 hours
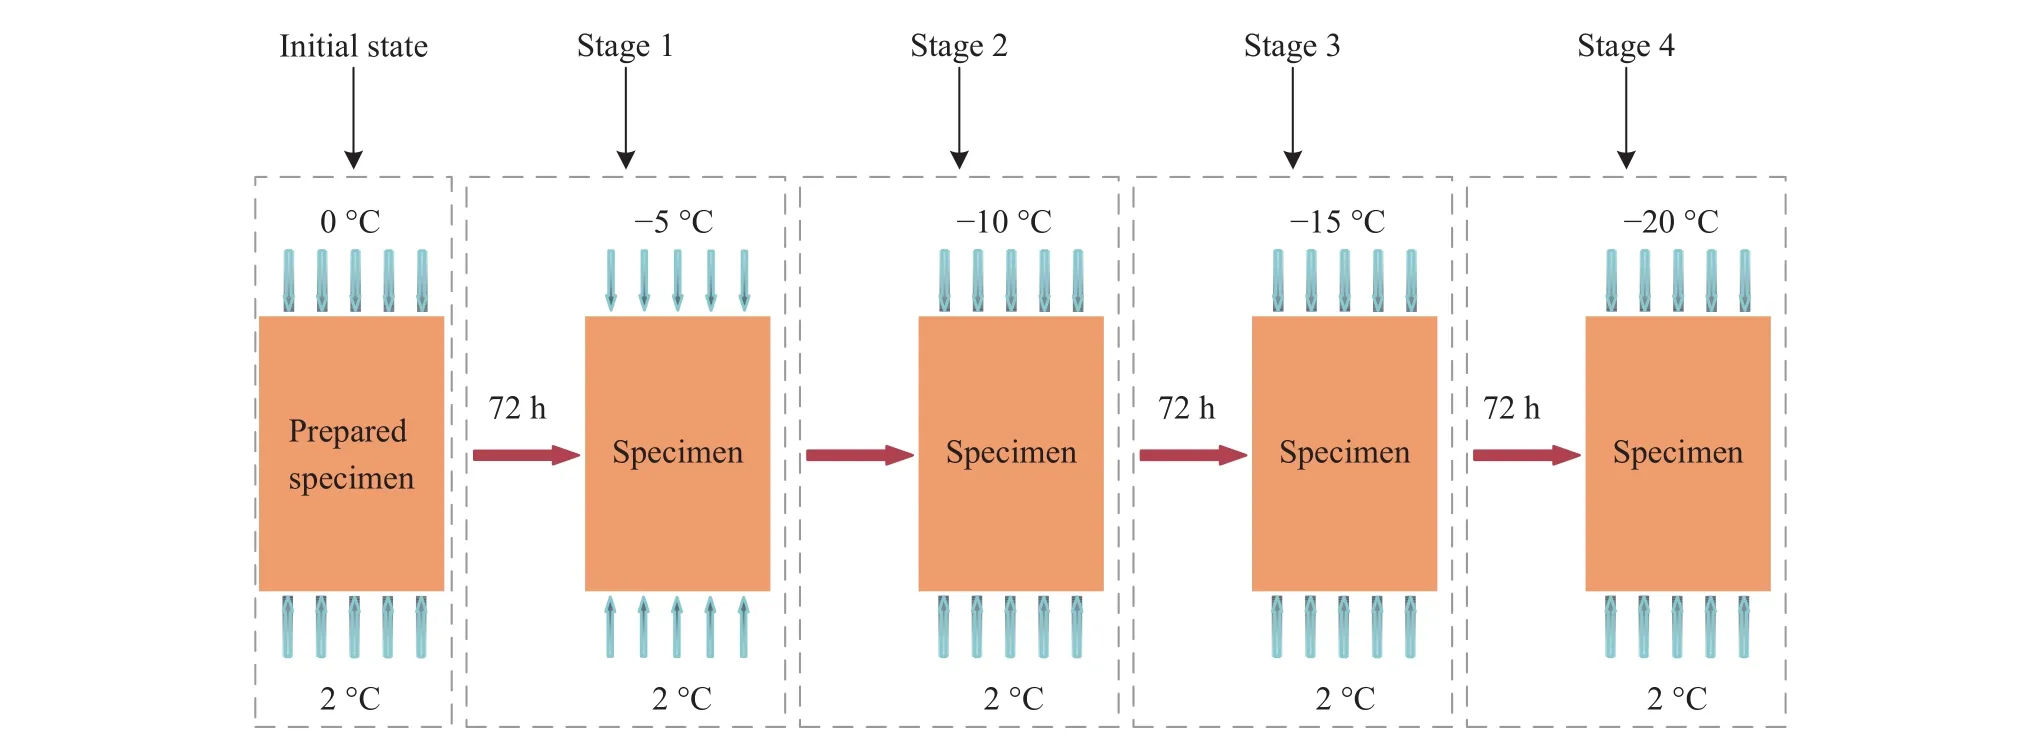
Figure 7 Temperature scheme for freezing
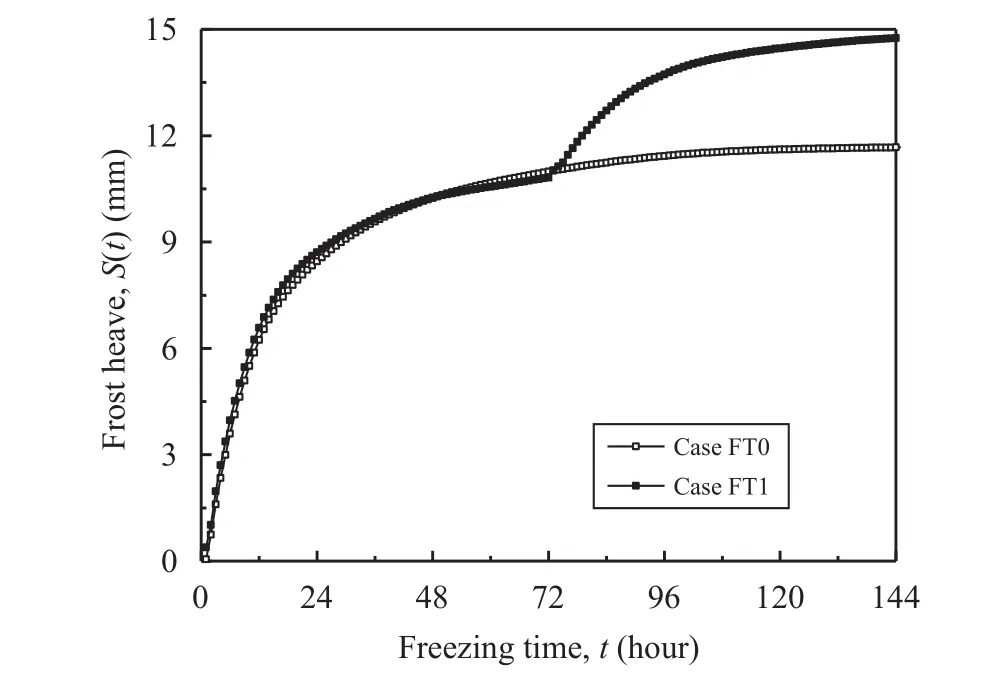
Figure 8 Variation of frost heave with time elapsed in Cases FT0 and FT1
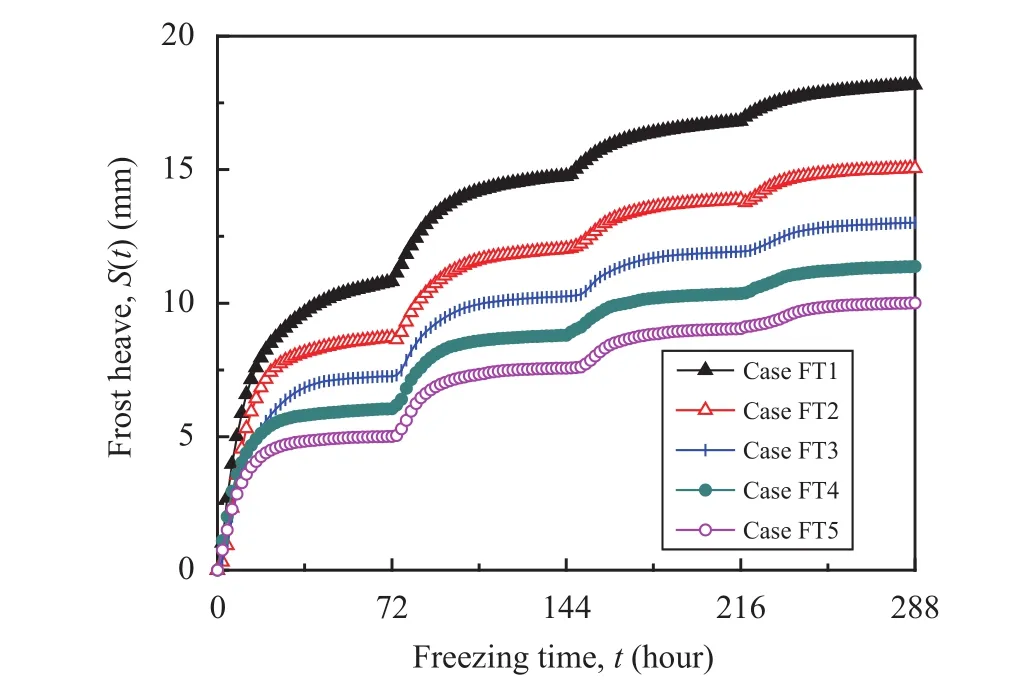
Figure 9 Variations of measured frost heave and freezing front of soil columns with time elapsed in Cases FT1~FT5
From Figure 8, variations of ΔS1,2(t) (i.e.,ΔS1,2(t)=SFT0(t)−SFT1(t)) and the associated frostheave increment rate (i.e., dΔS1,2(t)/dt) are obtained.These variations are presented in Figure 10, where the t varies in the range of 72~144 hours. Using data for ΔS1,2(t) (Figure 10), a straight line is obtained by plotting 1/ΔS1,2(t1) versus 1/t1(i.e., t1=t−72, t varies over the range of 72~144 hours), as presented in Figure 11.We have
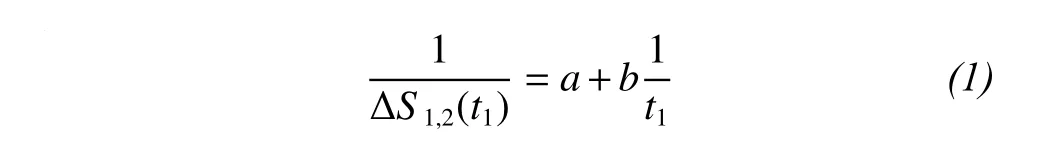
Which can be expressed as
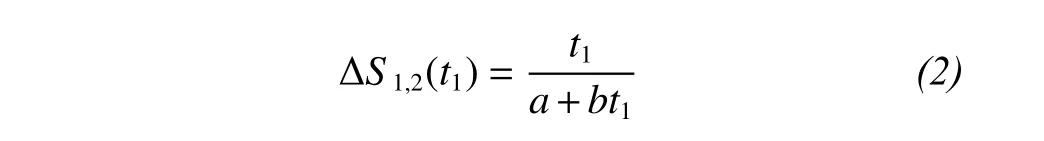
where the parameters a and b are undetermined coefficients. The values of a and b can be obtained from the slope and intercept of the straight line. Even with sufficient time, the ΔS1,2(t1) induced by the change of Tcfrom −5 °C to −10 °C can be fitted with the hyperbolic curve.
3.3 Estimation method for maximum frost heave
In this section, the proposed method for estimation of maximum frost heave is outlined. The above investigations have clarified that a hyperbolic curve can be used to fit the frost-heave increment (Figures 6c and 10) induced by the change of Tc.
It should be noted that ΔS0,1(t) (ΔS0,1(t)=S(t)−S(0),Figure 12a) is a known quantity, where t varies from 0 to 72 hours. After careful inspection, we have
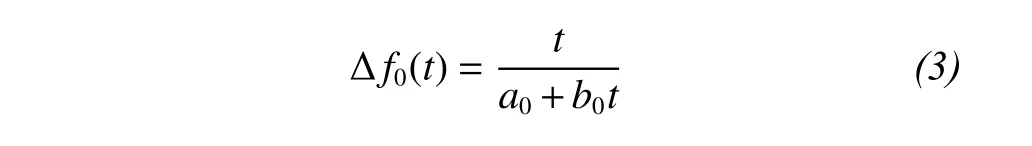
where the parameters a0and b0are undetermined coefficients. A straight line can be obtained by plotting 1/Δf0(t) versus 1/t. The value of a0and b0can be obtained from the slope and intercept of the straight line. This approach may also be used to calculate the undetermined coefficients in the hyperbolic curves' equations defining the other stages.
Theoretically, as time t→∞, the maximum frost heave, Smax,1, approaches that attained at Tcof −5 °C.Thus, it could be assessed from Equation (3) as

The predicted frost heave continues to grow at the Tcof −5 °C where t exceeds 72 hours, and the contribution of relevant frost heave can be extracted using Equation (3). Therefore, to remove this contribution, the ΔS1,2(t) occurring during the change of Tcfrom −5 °C to −10 °C can be obtained from Equation(5) as follows:

where t varies in the range 72~144 hours. Further,ΔS1,2(t) is a known quantity (Figure 12a).
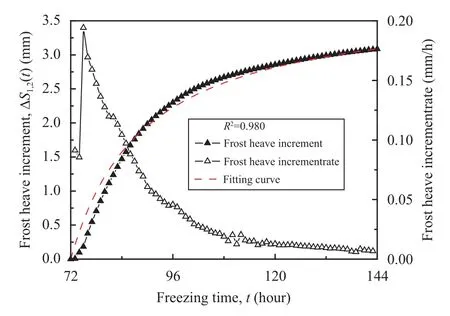
Figure 10 Variation of frost heave increment and frost heave increment rate with time elapsed(t varies in the range of 72~144 hours)
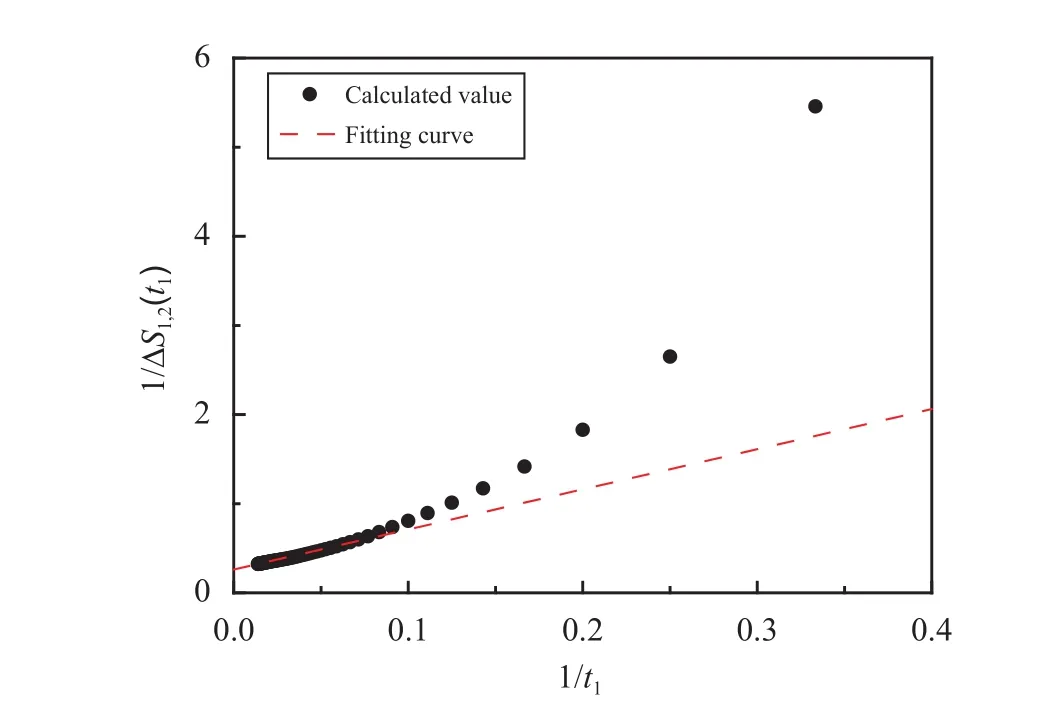
Figure 11 Variation of 1/ΔS1,2(t1) versus 1/t1 (i.e., t1=t−72,t varies in range of 72~144 hours)
Therefore, a similar hyperbolic equation is utilized to fit the discrete data of ΔS1,2(t) below:
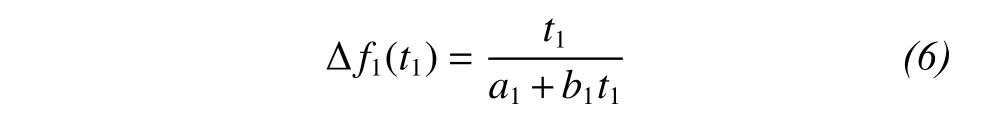
where t1(i.e., t1=t−72) is t at the beginning of Stage 2,and parameters a1and b1are undetermined coefficients.
Combined with Equations (3) and (6), maximum frost heave, Smax,2, at Tcof −10 °C is described in the following form:
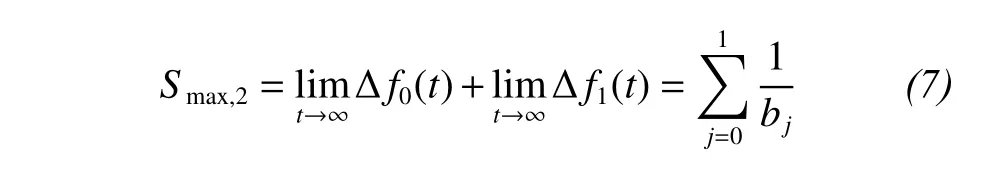
Maximum frost heave, Smax,3and Smax,4at Tcof−15 °C and −20 °C, respectively, can be similarly calculated.
To remove the overall effect of the change of Tcon the frost heave, we can separate out the effect of the change in Tcduring Stage 1 on the increase of frost-heave amount by extrapolating the curve obtained from Stage 1.
Similarly, the effect of Stage 2 is extrapolated to isolate the effect of the change in Tcon the next freezing stage. In this analysis, in addition to the assumptions made in the extrapolation, we have also supposed that the effect of Tcon frost heave is additive.On this basis, Figures 12a to 12e, present the recorded and predicted frost-heave increment at each freezing stage under various overburden stresses.
3.4 Empirical equation between Smax,n and Tc
Finally, frost heave can be assumed as a function of σvand Tc. By using the above-mentioned mathematical procedure, data for Smax,n(n=1, 2, 3, and 4) can be obtained; and eventually, the relationship between Smax,nand Tcunder various overburden stresses, as shown in Figure 13, may be derived. The hyperbolic curve is still chosen to fit data for Smax,nduring each freezing stage in this uniform form:
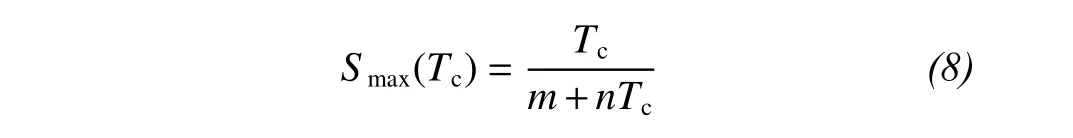
where Smax(Tc) is the fitting formula and represents the maximum frost heave at Tc. Parameters m and n are undetermined coefficients, which as the function of the σv, are expressed by Equations (9) and (10) as follows:
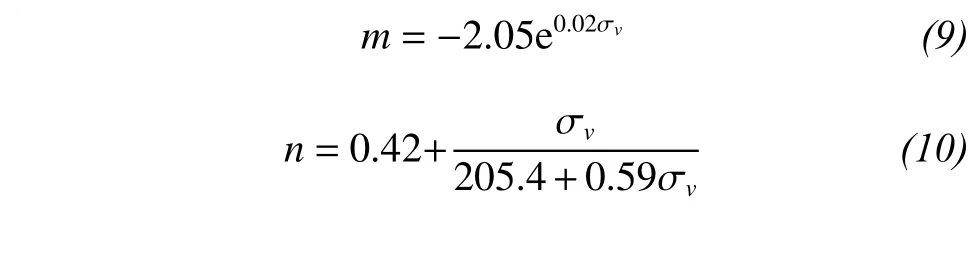
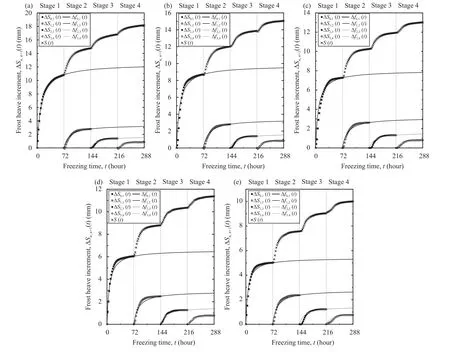
Figure 12 Frost heave increase caused by the change of freezing temperature at the cooling end under the tested specimens.(a) Case FT1; (b) FT2; (c) FT3; (d) FT4; and (e) FT5
4 Conclusions
A series of laboratory tests was conducted to investigate the frost heave of Harbin silty clay with free access to an external water source under one-sided,multistage freezing conditions. The results and conclusions are summarized as follows.
(1) Frost heave at the ground surface decreases due to increased overburden pressure, which may act as a constraint on frost heave. Frost heave can have more abrupt increases from one stage to the next.Overall, the evolution of frost-heave amount goes through two phases: rapid accumulation at the beginning of the freezing stage and then slow increase during the remainder of it.
(2) Maximum frost heave is not attained under test conditions with a 72-hour freezing period for each stage. Sufficient freezing time is required to reach maximum frost heave under a given thermal boundary setting. Further, a hyperbolic equation can be used to approximate the relations between incremental frost heave and freezing time, as well as those between frost-heave amount and freezing time at each freezing stage.
(3) Based on the assumption of the effect of the freezing temperature at the cooling end and its change on frost heave being an isolated additive, a simple method considering the effect of overburden pressure is proposed to estimate maximum frost heave. Meanwhile, the magnitude of maximum surface frost heave is found to be a function of cooling temperature and overburden stresses.
(4) This investigation provides a practical method to estimate maximum frost heave with accuracy sufficient for engineering. Future studies should address other important factors and introduce them into the theoretical model and framework. Including these additional factors can achieve a more general understanding of the frost-heave mechanism in unsaturated frost-susceptible soils.
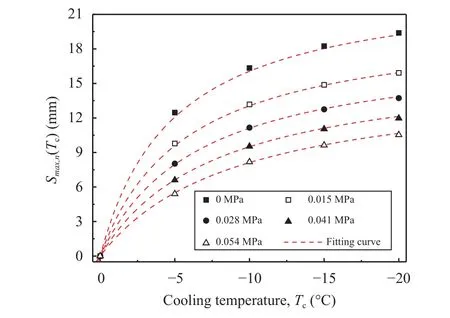
Figure 13 Relationship between Smax,n and freezing temperature (Tc) at the cooling end undervarious overburden stresses
Acknowledgments:
We gratefully acknowledge support for this research from the State Key Program of National Natural Science of China (Grant No. 41430634), the National Natural Science Foundation of China (Grant Nos.41702382, 51578195, 51378161, and 51308547), the Foundation Project Program 973 of China (No.2012CB026104), and the State Key Laboratory for Geomechanics and Deep Underground Engineering,China University of Mining & Technology (Grant No.SKLGDUEK1209).
Abzhalimov RS, Golovko NN, 2009. Laboratory investigations of the pressure dependence of the frost heaving of soil. Soil Mechanics and Foundation Engineering, 46(1): 31–38. DOI: 10.1007/s 11204-009-9040-5.
Black PB, 1995. Rigid ice model of secondary frost heave. Cold Regions Research and Engineering Laboratory, US Army Corps of Engineers.
Cheng GD, He P, 2001. Linearity engineering in permafrost areas.Journal of Glaciology and Geocryology, 23(3): 213–217. DOI:10.3969/j.issn.1000-0240.2001.03.001.
Everett DH, 1961. The thermodynamics of frost damage to porous solids. Transactions of the Faraday Society, 57: 1541–1551. DOI:10.1039/TF9615701541.
Fremond M, Mikkola M, 1991. Thermomechanical modelling of freezing soil. In: Proceedings of the 6th International Symposium on Ground Freezing. Rotterdam, The Netherlands, pp. 17.
Konrad JM, Morgenstern NR, 1980. A mechanistic theory of ice lens formation in fine-grained soils. Canadian Geotechnical Journal,17(4): 473–486. DOI: 10.1139/t80-056.
Lai YM, Pei WS, Zhang MY, et al., 2014. Study on theory model of hydro-thermal-mechanical interaction process in saturated freezing silty soil. International Journal of Heat and Mass Transfer, 78:805–819. DOI: 10.1016/j.ijheatmasstransfer.2014.07.035.
Ma W, Wang DY, 2012. Studies on frozen soil mechanics in China in past 50 years and their prospect. Chinese Journal of Geotechnical Engineering, 34(4): 625–640.
Ma W, Zhang LH, Yang CS, 2015. Discussion of the applicability of the generalized Clausius-Clapeyron equation and the frozen fringe process. Earth-Science Reviews, 142: 47–59. DOI: 10.1016/j.earscirev.2015.01.003.
Michalowski RL, Zhu M, 2006. Frost heave modelling using porosity rate function. International Journal for Numerical and Analytical Methods in Geomechanics, 30(8): 703–722. DOI:10.1002/nag.497.
Nixon JF, 1991. Discrete ice lens theory for frost heave in soils. Canadian Geotechnical Journal, 28(6): 843–859. DOI: 10.1139/t91-102.
O'Neil K, Miller RD, 1985. Exploration of a rigid ice model of frost heave. Water Resources Research, 21(3): 281–296. DOI:10.1029/WR021i003p00281.
Penner E, Ueda T, 1977. The dependence of frost heaving on load application-preliminary results. In: Proceedings of the International Symposium on Frost Action in Soils, vol. 1. Lulea, Sweden: Luleå University of Technology, pp. 137–142.
Peppin S, Majumdar A, Style R, et al., 2011. Frost heave in colloidal soils. SIAM Journal on Applied Mathematics, 71(5): 1717–1732.DOI: 10.1137/100788197.
Sheng DC, Zhang S, Yu ZW, et al., 2013. Assessing frost susceptibility of soils using PC Heave. Cold Regions Science and Technology, 95: 27–38. DOI: 10.1016/j.coldregions.2013.08.003.
Singh AK, Chaudhary DR, 1995. Evaluation of heat and moisture transfer properties in a frozen-unfrozen water-soil system. International Journal of Heat and Mass Transfer, 38(12): 2297–2303.DOI: 10.1016/0017-9310(94)00283-2.
Taber S, 1930. The mechanics of frost heaving. The Journal of Geology, 38(4): 303–317. DOI: 10.1086/623720.
Wang JY, Hu YF, 2004. A discussion on frost-heaving force on tunnel lining. Journal of Glaciology and Geocryology, 26(1): 112–119.DOI: 10.3969/j.issn.1000-0240.2004.01.017.
Xu XZ, Wang JC, Zhang LX, 2001. Frozen Soil Physics. Beijing: Science Press.
Zhao G, Tao XX, Liu B, 2009. Experimental study on water migration in undisturbed soil during freezing and thawing process. Chinese Journal of Geotechnical Engineering, 31(12): 1952–1957.
Zheng H, Kanie SJ, 2015. Combined thermal-hydraulic-mechanical frost heave model based on Takashi's equation. Journal of Cold Regions Engineering, 29(4): 04014019. DOI: 10.1061/(ASCE)CR.1943-5495.0000089.
Zhou JZ, Li DQ, 2012. Numerical analysis of coupled water, heat and stress in saturated freezing soil. Cold Regions Science and Technology, 72: 43–49. DOI: 10.1016/j.coldregions.2011.11.006.
Zhou Y, Zhou GQ, 2012. Intermittent freezing mode to reduce frost heave in freezing soils-experiments and mechanism analysis. Canadian Geotechnical Journal, 49(6): 686–693. DOI: 10.1139/T2012-028.
*Correspondence to: Liang Tang, Professor of School of Civil Engineering, Harbin Institute of Technology, Harbin,Heilongjiang 150090, China. E-mail: hit_tl@163.com; gl_hit@163.com Citation: Geng L, Ling XZ, Tang L, et al., 2017. A mathematical approach to evaluate maximum frost heave of unsaturated silty clay. Sciences in Cold and Arid Regions, 9(5): 438–446.
10.3724/SP.J.1226.2017.00438.
January 3, 2017 Accepted: June 22, 2017
杂志排行
Sciences in Cold and Arid Regions的其它文章
- The temporal and spatial variation of positive degree-day factors on the Koxkar Glacier over the south slope of the Tianshan Mountains, China, from 2005 to 2010
- Changes of glacier area in the Xiying River Basin,East Qilian Mountain, China
- Characteristics of thawed interlayer and its effect on settlement beneath embankment in permafrost regions-A case study for the Qinghai-Tibet Highway
- Chemistry and environmental significance of aerosols collected in the eastern Tianshan
- Contamination and risk assessment of heavy metals in farmland soils of Baghrash County, Xinjiang,Northwest China
- Complex network analysis of climate change in the Tarim River Basin, Northwest China