Comparison of Fiscal Revenue and Expenditure in China and America
2016-09-26ZhangBinCuiMeng
Zhang+Bin++Cui+Meng++Chen+Yifan
【Abstract】It is widely agreed that Americas financial system is superior to Chinas in virtue of the developed economy while China lag behind. Therefore, this article is aimed to illustrate the two dimensions and structures and also offer some proposals of optimizing the expenditure structure of China through the comparison of statistics analysis about these two countries revenue and expenditure.
【Key Words】revenue; expenditure; China and America
【中图分类号】F812 【文献标识码】A 【文章编号】2095-3089(2016)20-0009-01
一、Introduction
Governments can sometimes improve market outcomes. In order to make the whole country function well, the government need to raise revenue by taxation and spending. As a large part of a countrys economy, most is funded primarily through tax revenues from its citizens to cover future investment, acquisitions and transfer payment and so on.
二、The Analysis on Revenue and Expenditure Structure in China and America
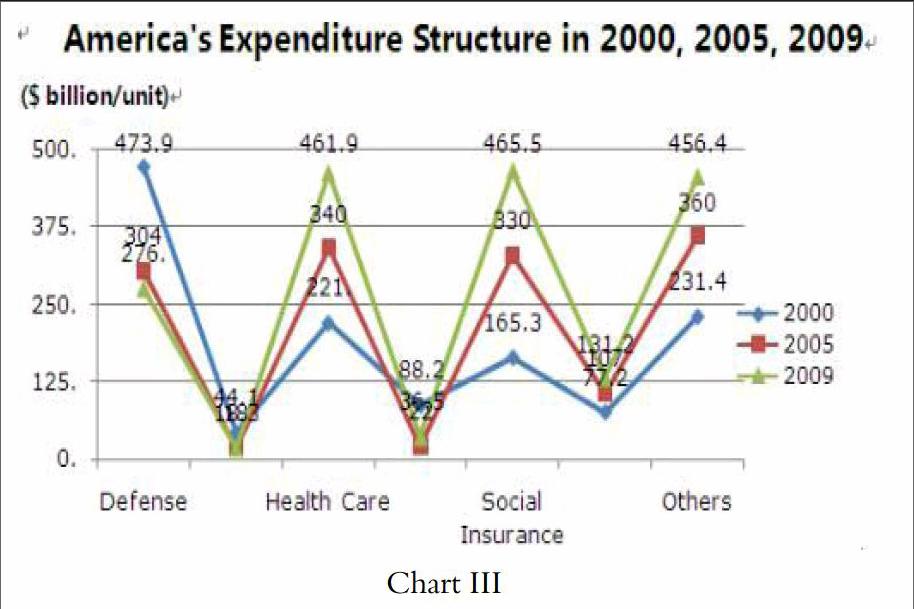
1.The Analysis on Revenue Structure in China and America
Chart I
From the Chart I, we can conclude that in China, the majority of the fiscal revenue comes from the enterprises rather than its citizens. Then theres no doubt that Chinese government serves for the capitalists for its immediate interest determines its policy orientation. Just on the contrary, Americas fiscal revenue relies on the individual income tax, that is, its citizens. According to a survey, the tax from those who earn more than $100,000 per year has exceeded 60% of the total income tax.
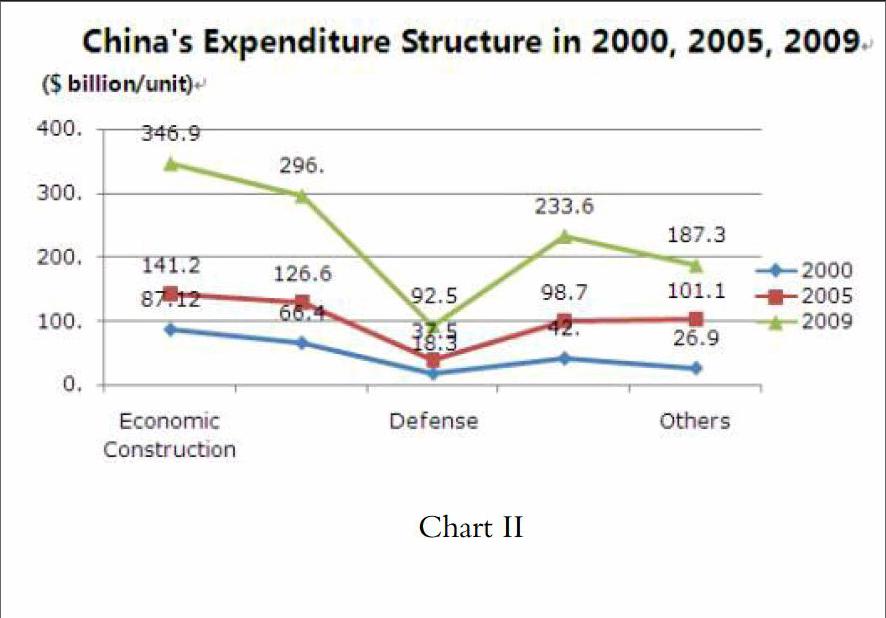
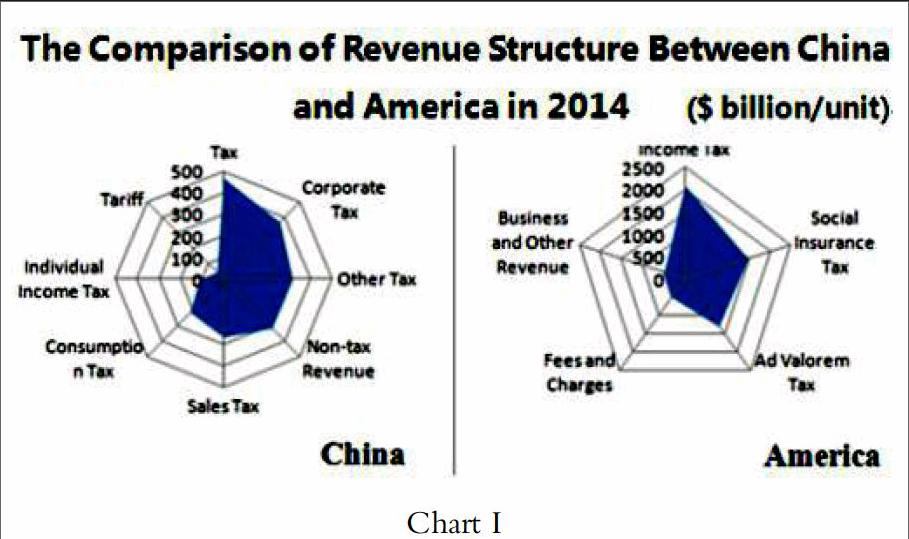
2.The Analysis on Expenditure Structure in China and America
Chart II
Chart III
Through the comparison of the Chart II and Chart III, we can recognize that the absolute number of Americas expenditure is always rising, while the relative number of that keeps balance. According to the exact statistics, the fiscal spending in America reaches $18.3 trillion in 2009 from $10.8 trillion in 2001. And its proportion of the GDP is floating around 12%. As for China, the two numbers both go up over these years, ranging from 12.8 trillion yuan in 2000 to76.3 trillion yuan in 2009. Meanwhile, the proportion of the total expenditure to the GDP is also growing, from 16% to 22.8%.
三、Conclusion
Generally speaking, the low ratio of the Chinas spending on social insurance cannot meet the increasing need of all its people, which goes against the smooth process of our countrys construction, and also weakens the macro-control of the national finance to normal economic operation.
In view of the above, the top priority must be put on the optimization of the expenditure in China, the reasonable transformation of government functions and switchover of the main part in the whole expenditure.
Reference:
[1]N.Gregory Mankiw. (2009) Macroeconomics. New York: Worth Publishers.
[2]冯索水.中美财政支出结构的比较、借鉴和启示[J].边疆经济与文化,2008,(2).
[3]李冰,我国财政支出的国际比较与对策[J].山东财政学院学报,2005,(3)14.
[4]http://gks.mof.gov.cn/zhengfuxinxi/tongjishuju/201501/t201 50130_1186487.
[5]http://usgovernmentspending.com/federal_budget_09.htm1 #usgs302.