联合多源多时相卫星影像和支持向量机的小麦白粉病监测方法
2022-05-30赵晋陵杜世州黄林生
赵晋陵 杜世州 黄林生
摘要:白粉病主要侵染小麦叶部,可利用卫星遥感技术进行大范围监测和评估。本研究利用多源多时相卫星遥感影像监测小麦白粉病并提升分类精度。使用四景 Landat-8的热红外传感器数据(Thermal Infrared Sensor ,TIRS )和20景 MODIS 影像的 MOD11A1温度产品反演地表温度(Land Surface Temperature , LST ),使用4景国产高分一号( GF-1) 宽幅相机数据(Wide Field of View ,WFV )提取小麦种植区和计算植被指数。首先,利用ReliefF算法优选对小麦白粉病敏感的植被指数,然后利用时空自适应反射率融合模型(Spa? tial and Temporal Adaptive Reflectance Fusion Model ,STARFM )对 Landsat-8 LST 和 MOD11A1数据进行时空融合。利用 Z-score 标准化方法对植被指数和温度数据统一量度。最后,将处理和融合后的单一时项 Landsat-8 LST 、多时相 Landsat-8 LST 、累加 MODIS LST 和多时相Landsat-8 LST 与累加 MODIS LST 结合的数据分别输入支持向量机(Support Vector Machine , SVM )構建了四个分类模型,即 LST-SVM 、SLST-SVM 、MLST- SVM 和 SMLST-SVM ,利用用户精度、生产者精度、总体精度和 Kappa 系数对比四个模型的分类精度。结果显示,本研究构建的 SMLST-SVM 取得了最高分类精度,总体精度和 Kappa 系数分别为81.2%和0.67,而 SLST-SVM 则为76.8%和0.59。表明多源多时相的 LST 联合 SVM 能够提升小麦白粉病的识别精度。
关键词:小麦白粉病;高分一号;MODIS ;Landsat-8;地表温度;支持向量机
Monitoring Wheat Powdery Mildew (Blumeriagraminis f. sp. tritici) Using Multisource and Multitemporal SatelliteImages and Support Vector Machine Classifier
ZHAO Jinling1 , DU Shizhou2* , HUANG Linsheng1
(1. National Engineering Research Centerfor Analysis and Application of Agro-Ecological Big Data, Anhui Univer‐sity, Hefei 230601, China;2. Institute of Crops, Academy of Agricultural Sciences, Hefei 230031, China )
Abstract: Since powdery mildew (Blumeriagraminis f. sp. tritici) mainly infects the foliar of wheat, satellite remote sensing technology can be used to monitor and assess it on a large scale. In this study, multisource and multitempo‐ral satellite images were used to monitor the disease and improve the classification accuracy. Specifically, four Land‐ sat-8 thermal infrared sensor (TIRS) and twenty MODerate-resolution imaging spectroradiometer (MODIS) temper‐ature product (MOD11A1) were used to retrieve the land surface temperature (LST), and four Chinese Gaofen-1(GF-1) wide field of view (WFV) images was used to identify the wheat-growing areas and calculate the vegetation indices (VIs). ReliefF algorithm was first used to optimally select the vegetation index (VIs) sensitive to wheat pow ‐dery mildew, spatial-temporal fusion between Landsat-8 LST and MOD11A1 data was performed using the spatial and temporal adaptive reflectance fusion model (STARFM). The Z-score standardization method was then used to unify the VIs and LST data. Four monitoring models were then constructed through a single Landsat-8 LST, multi‐ temporal Landsat-8 LSTs (SLST), cumulative MODIS LST (MLST) and the combination of cumulative Landsat-8 and MODIS LST (SMLST) using the Support Vector Machine (SVM) classifier, that were LST-SVM, SLST-SVM, MLST-SVM and SMLST-SVM. Four assessment indicators including user accuracy, producer accuracy, overall ac‐ curacy and Kappa coefficient were used to compare the four models. The results showed that, the proposed SMLST- SVM obtained the best identification accuracies. The overall accuracy and Kappa coefficient of the SMLST-SVM model had the highest values of 81.2% and 0.67, respectively, while they were respectively 76.8% and 0.59 for the SLST-SVM model. Consequently, multisource and multitemporal LSTs can considerably improve the differentiation accuracies of wheat powdery mildew.
Key words: wheat powdery mildew; GF-1; MODIS; Landsat-8; land surface temperature; support vector machine
CLC number:S435.121.4;TP79 Documents code:A Article ID:SA202202009
Citation:ZHAO Jinling, DU Shizhou, HUANG Linsheng. Monitoring wheat powdery mildew (Blumeriagraminis f. sp. tritici) using multisource and multitemporal satellite images and support vector machine classifier[J]. Smart Agri‐ culture, 2022, 4(1):17-28.(in English with Chinese abstract)
趙晋陵, 杜世州, 黄林生.联合多源多时相卫星影像和支持向量机的小麦白粉病监测方法[J].智慧农业(中英文), 2022, 4(1):17-28.
1 Introduction
Powdery mildew (Blumeriagraminis f. sp. trit‐ici) can occur at all stages of the wheat growth. It is a serious disease in some provinces of China, such as Sichuan, Guizhou, and Yunnan[1]. In recent years, it has become more severe in the wheat-growing ar‐eas of Northeastern China, North China, and North ‐ western China. When infected by the disease, some serious results will be caused such as early wither‐ing of leaves, decrease of panicle number, and de‐ crease of 1000-grain weight. Generally, the disease can lead to a 5%-10% reduction in yield and when it is seriously infected, a more serious loss of more than 20% can occur[2]. In view of the harmful effects on wheat production caused by the wheat powdery mildew, it is of great significance to improve the monitoring efficiency and accuracy. However, it is difficult for traditional in-situ sampling and random investigation methods to meet the needs of large- scale monitoring due to the limitations in terms of timeliness, economy, and accuracy[3]. Fortunately, the modern information technology has facilitated the accurate and efficient identification of crop dis‐ eases to ensure food security[4–6].
In recent years, the development of remote sensing technology has provided an important means for monitoring and forecasting large-scale wheat diseases and insect pests. It obtains crop in ‐ formation quickly, accurately and objectively. Many scholars have studied remote sensing-based moni‐toring of wheat diseases and insect pests by using ground-based, airborne and spaceborne remote sens‐ing data. For example, Huang et al.[7] showed that the photochemical reflectance index (PRI) was strongly correlated with wheat yellow rust and the coefficient of determination (R2) could reach 0.97 for the PRI-based monitoring model. Zhang et al.[8] built a discriminant model for wheat powdery mil‐dew severities by introducing continuous waveletanalysis based on the leaf-scale hyperspectral data.Luo et al.[9] constructed a monitoring model ofwheat aphid in two-dimensional feature space de‐rived from the modified normalized difference wa‐ter index (MNDWI) and land surface temperature(LST) based on Landsat-5 TM imagery, which hada high discriminant precision. Zheng et al.[10] con ‐structed a red edge disease stress index (REDSI) us‐ing three red-edge bands from Sentinel-2 satelliteimagery for monitoring the stripe rust on winterwheat and got a satisfying result. The above studiesshowed that the spaceborne remote sensing imageshave greatly facilitated the monitoring and diagno‐sis of wheat diseases.
In previous studies, multispectral satellite im‐ages were adopted to investigate the large-scale dis‐ease occurrence. Since the rapid development of hy‐perspectral remote sensing technology, some studieson wheat powdery mildew had been explored usingthe hyperspectral data. More vegetation indiceswere derived from the hundreds of spectral bands ofhyperspectral data. He et al.[11] improved the moni‐toring accuracy of wheat powdery mildew severityby selecting suitable observation angles and devel‐oping a novel vegetation index (VI). Zhao et al.[12]identified the powdery mildew severities of wheatleaves quantitatively on hyperspectral images andimage segmentation techniques. Khan et al.[13] de‐tected the disease using a partial least-squares lineardiscrimination analysis and the combined optimalfeatures (i. e., normalized difference texture indices(NDTIs) and VIs).
It can be found that the disease monitoringmainly depends on the vegetation changes betweenhealthy and diseased wheat. Nevertheless, the com ‐mission and omission errors are usually caused dueto the influences of other stress types such asdrought, inadequate nutrition, and other diseases. The incidence of wheat powdery mildew is in ‐ volved in several affecting factors such as tempera‐ture, humidity and planting system. Considering the availability of temperature data of satellite images for large-scale monitoring, in this study, particular attention was given to the contribution of LST to the disease occurrence. As a key habitat factor, LST was included in the construction of monitoring mod‐el for the disease. LST remote sensing image was usually used in the previous monitoring of the dis‐ ease[14] , but it has a cumulative effect on wheat pow ‐dery mildew. A single-phase LST image cannot ac‐curately represent the disease occurrence condition during the whole growth period. The primary objec‐tive of this study was to explore the availability and feasibility to identify wheat powdery mildew using a combination of multisource and multitemporal spaceborne remote sensing imagery. More specifi‐cally, three types of satellite images were adopted to identify the wheat-planting areas and retrieve the LST. Single and multitemporal LSTs were input in ‐ to the support vector machine (SVM) to compare the monitoring effects.
2 Materials and methods
2.1 Study area
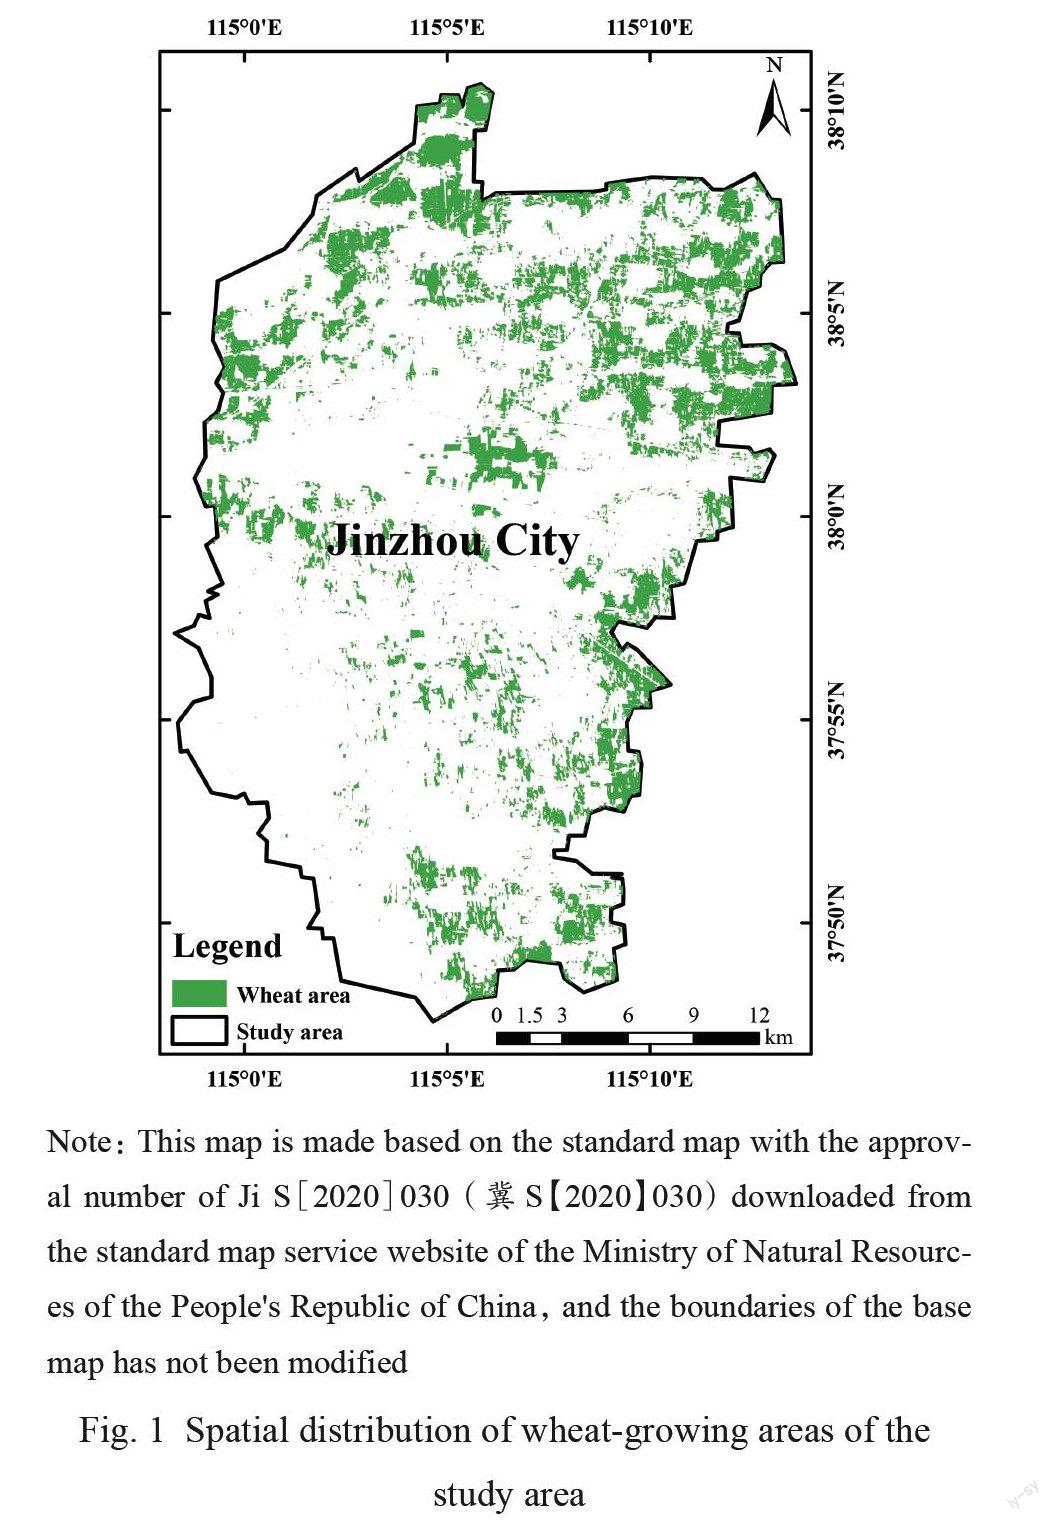
The study area is located in Jinzhou City, He‐bei province, China (114.97°-115.20° E, 37.80°-38.17° N)(Fig.1). It has a warm-temperate conti‐nental monsoon climate, with a flat and open ter‐ rain. There is a significant seasonal variation of sun radiation. Wheat is one of the important grain crops and widely planted in this area. The critical periods of wheat growth range from April to May. Due to its flat terrain, appropriate climate conditions and relatively single planting structure, the region issuitable for studying wheat powdery mildew usingremote sensing technology[15]. The historic statisticaldata also show that the occurrence frequency ofwheat powdery mildew is high and hazard degree isserious[16]. The wheat-planting areas were extractedby combining the elevation data and reflectance ofthe near-infrared (NIR) band of Chinese Gaofen-1(GF-1) by using decision tree classification tech ‐niques (Fig.1(b)). The extraction results were com ‐pared with the statistical data of Shijiazhuang City,which could fulfill the accuracy requirement of re‐mote sensing-based crop extraction.
2.2 Data collection and pre-processing
The data used in this study mainly were space‐borne remote sensing images and field survey dataof wheat powdery mildew. In-situ experiments werecarried out on 27 and 28 May 2014 in the central ar‐eas of Jinzhou City. Several typical experimental re‐gions were selected to collect the ground-truth data, where wheat was widely planted and wheat pow ‐dery mildew occurs frequently. A total of 69 valid data were acquired using the method presented by Yuan et al.[17]. The wheat powdery mildew severities were specified according to the Rules for the in ‐vestigation and forecast of wheat powdery mildew [B. graminis (DC.) Speer](NY/T 613-2002). First‐ly, the average severity D of diseased leaves for the colony leaves was calculated according to Equation (1). Then, the disease index I could be de‐ rived from Equation (2). The five levels were final‐ly obtained according to Table 1. To increase the comparability of remote sensing-based disease mon‐itoring, the five levels of severities were further di‐ vided into three levels of 0(healthy), 1(mild) and 2(severe).
where di is the value of eight severity levels, which is 1%, 5%, 10%, 20%, 40%, 60%, 80%, 100%; li is the number of diseased leaves for each level; L is the total number of investigated diseased leaves.
where F is the percentage of diseased leaf, which is ratio between the diseased leaves and total investi‐ gated leaves.
Multisource remote sensing data were com ‐ posed of GF-1, Landsat-8 and MODerate-resolution imaging spectroradio-meter (MODIS) data products.
GF-1: Four scenes of GF-1 wide field of view (WFV) images were collected on 6, 17 and 26 May, and 7 June 2014, respectively, with the path/rownumbers of 3/93 and 4/92. There are four spectralbands for the GF-1 WFV sensor within the spectralrange of 0.45-0.89μm, with the spatial resolutionof 16 m. The primary preprocessing procedures wereperformed including orthorectification, radiationcalibration, atmospheric correction and image sub ‐setting. The radiation brightness (Le , W/(m2·sr ·μm))of a WFV image can be derived from Equation (3).
where DN is the digital number of pixel. The abso‐lute radiometric calibration coefficients (gain andoffset) were derived from the China Center for Re‐sources Satellite Data and Application (http://www.cresda. com/CN/). After finishing the radiometriccalibration, the Fast Line-of-Sight AtmosphericAnalysis of Spectral Hypercubes (FLAASH) mod‐ule in ENVI 5.3 software was used to complete theatmospheric correction. The geometric correctionwas carried out using the second-order polynomialmodel with the accuracy of less than a pixel.
Landsat-8: The Landsat-8 operational land im‐ager (OLI) data were used to estimate the land re‐flectance and the thermal infrared sensor (TIRS) da‐ta were used for retrieving the LST[18]. Four scenesof cloud-free images were selected and their acquisi‐tion date was 4 April, 23 April, 15 May and 22 May2014, respectively. They were preprocessed includ‐ing accurate geometric correction and radiation cor‐rection.
MOD11A1 product: It provided daily per-pix ‐el land surface temperature and emissivity(LST&E) with 1 km spatial resolution[19]. A total of20 images were obtained from the land processesdistributed active archive center (LPDAAC) from 1April to 27 May, 2014. The data were preprocessedusing the MRT (MODIS Reprojection Tool).
2.3 Selection of vegetation indices
A total of eight VIs suitable for monitoring thewheat powdery mildew were selected in this studybased on the previous studies (Table 2).
To find out the most sensitive features, the Re‐liefF algorithm was used due to its advantages of dealing with multi-class classification problem and having no restrictions on the data types. A sample R was randomly taken from the training sample set each time, and then k nearest neighbor samples (near Hits) of R were found from the sample set of the same class as R, and k nearest neighbor samples (near Misses) were found from each sample set of different classes of R. The input features were ranked according to the weights from large to small. Then the correlation analysis was carried out for each feature and the combination with the smallest correlation coefficient was selected as the best com ‐ bination for model construction. The superiority and efficiency have been illustrated in remote sens‐ing-based classification and object recognition[20-23]. Consequently, it was adopted to perform the feature selection, which gave different weights to the fea‐tures in terms of the correlations between features and various disease samples[24]. Specifically, accord‐ing to the ReliefF algorithm, all the VI variables were sorted in descending order of weight, and eight VIs were selected with the weight of 0.075 as the threshold value. Then, the correlation analysisamong the selected features were conducted. Whenthe correlation coefficient (r) of the feature owingthe highest weight that was greater than 0.9, it waseliminated, and then that of the second highestweight with a high r was eliminated, and so on. Inaddition, there was a close relationship between thedisease incidence and meteorological factors suchas temperature, precipitation, humidity, etc. Thechanges of VIs calculated at different growth stagesalso affected the sensitivity to the disease. Consider‐ing the temporal features and accumulative effect oftemperature, three VIs were finally selected, namelythe SAVI on 26 May 2014 and the SIPI and EVI on17 May 2014.
2.4 Estimation of LST
Two-channel nonlinear splitter algorithm wasadopted to increase the information amount and re‐duce the influence of errors. The equation is shownas (12).
where ε and Δε respectively represents the meanand difference values of the two channels ′emissivi- ties depending on the land type and coverage; Ti and Tj are the observed brightness temperatures of the two channels; bi (i =0, 1, 2, … , 7) is the simulation dataset of various coefficients which can be derived from laboratory data, atmospheric parameters and the atmospheric radiation transmission equation. In order to modify the calculation precision, the coeffi- cient depends on the atmospheric water vapour col- umn[33]. Fig.2 is the LST of 22 May 2014 retrieved from Landsat-8 TIRS image. In general, the LSTs of crop planting areas are lower than other regions. To calculate the land surface emissivity, the weight- ing method of vegetation coverage was adopted, which bases on the NDVI and vegetation coverageretrieved from the visible and NIR bands of Land- sat-8 imagery [34].
The occurrence and development of wheat powdery mildew is a relatively long process during which the LST has a significant cumulative effect.For example, temperature conditions which are fa-vorable for wheat powdery mildew infection in ear-ly April will aggravate the disease. As a result, thedisease at the end of May has a high correlationwith previous LST. The Landsat-8 LST data at fourgrowth stages were selected including the standingstage, jointing stage, flowering stage and milkingstage, for the retrieval of LST and their summationSLST is shown in Equation (13).
where SLST denotes the cumulative effect of multi-temporal Landsat-8 LST data; LST is calculatedfrom a single Landsat-8 TIRS image; i (1, 2, 3, 4)represents the four stages, and the 20 means the up-per limit of temperature suitable for the incidence ofwheat powdery mildew. Similarly, the summationof 20 MOD11A1(MLST) can be also obtained ac-cording to the Equation (14).
2.5 Spatial-temporal fusion of MOD11A1and Landsat-8 LST
Since the four Landsat-8 LST data cannot fullyreflect the variation trend of LST during the wholewheat growth, the daily MOD11A1 was introduced.In order to obtain a data sequence that have enoughspatial and temporal resolutions, the widely appliedspatial and temporal adaptive reflectance fusionmodel (STARFM)[35] was used to conduct the spa-tial-temporal fusion of Landsat-8 LST andMOD11A1. The algorithm ignores the spatial posi-tion registration and atmospheric correction errors,so the pixel values of low spatial resolution (LSR)remote sensing data at the moment t can be calculat-ed using the weighted sum of that of high spatialresolution (HSR) data (Equation (15)).
Ct =∑( Fti× A t(i)) (15)
where Fti is the pixel value of HSR data for the posi‐tioni at the time t; A t(i) shows the weight of coverage area for each pixel; Ct represents the pixel value of LSR data at the corresponding time.
The STARFM algorithm first obtains the MOD11A1 and Landsat-8 LST data and their devia‐tion at the time tk . The deviation is caused by the systematic errors and land cover changes. Mean ‐ while, the Landsat-8 LST of the time t0 in accor‐ dance with MOD11A1 were predicted. The devia‐tion remains constant as time changes was assumed, and the pixel values of Landsat-8 LST at the time t0 are Equation (16).
HSR ( xi,yi,t0)= LSR ( xi,yi,t0)+
HSR ( xi,yi,tk )- LSR ( xi,yi,tk ) (16)
Considering the edge effect of pixels, a cloud- free pixel was selected in the moving window which was similar to the spectrum of central pixel when the pixel value was calculated. The calculat‐ing the central pixel value is shown as Equa‐tion (17).
HSR ( xw/2,yw/2,t0)=
Wijk×( LSR ( xi,yi,t0)+
HSR ( xi,yi,tk )- LSR ( xi,yi,tk )) ( 17)
where w is the size of the moving window;( xw/2 , yw/2) represents the position of central pixel; Wijk denotes the weight coefficient of a pixel similar to the central pixel. The spectral distance weight, temporal distance weight, and spatial distance weight of a similar pixel were obtained in the win ‐dow by a normalization method. The three weight coefficients were taken by referring to the study of Gao et al. in 2006[35]. Four Landsat-8 LST (LSTi) and 20 MOD11A1(LSTj) were used for the spatial- temporal fusion. The fusion data sequences were summed up as the SMLST in Equation (18).
SMLST = LSTi + LSTj ( 18)
2.6 Construction of monitoring models
Support vector machine (SVM) has the advan‐tages of a simple structure, strong generalizationability, and high accuracy, which has been widelyused in the classification of remote sensing imag‐es[36]. The discriminant function of the model isshown as Equation (19).
f ( x)= sgn (x ai yi k ( xi,x)+ b)
where ai is the Lagrange multiplier; Sv is the supportvector; xi and yi represent two kinds of support vec‐tors; b is the threshold; k(xi , x) represents a positivedefinite kernel function which satisfies the Mercertheorem.
The Z-score method was used to standardizeVIs and temperature data according to Equation (20)due to their different units. The training and valida‐tion datasets were divided using the ratio of 7:3.Four SVM-based models (LST-SVM, SLST-SVM,MLST-SVM and SMLST-SVM) were trained usingthe optimally selected three VIs. In addition to theVIs, these models were also involved in the Land‐sat-8 LST on 22 May (LST), four cumulative Land‐sat-8 LST data (SLST), 20 cumulative MOD11A1(MLST) and cumulative spatial-temporal fusionLST combing Landsat-8 LST and MOD11A1(SMLST), respectively. These models will explore abetter application of remote sensing-based LST tothe monitoring of wheat powdery mildew.
x '=(x -μ)ρ (20)
where x ' is the standardized data;μ is the mean oforiginal data;ρ is the standard deviation.
3 Results and discussion
3.1 Validation of the monitoring results
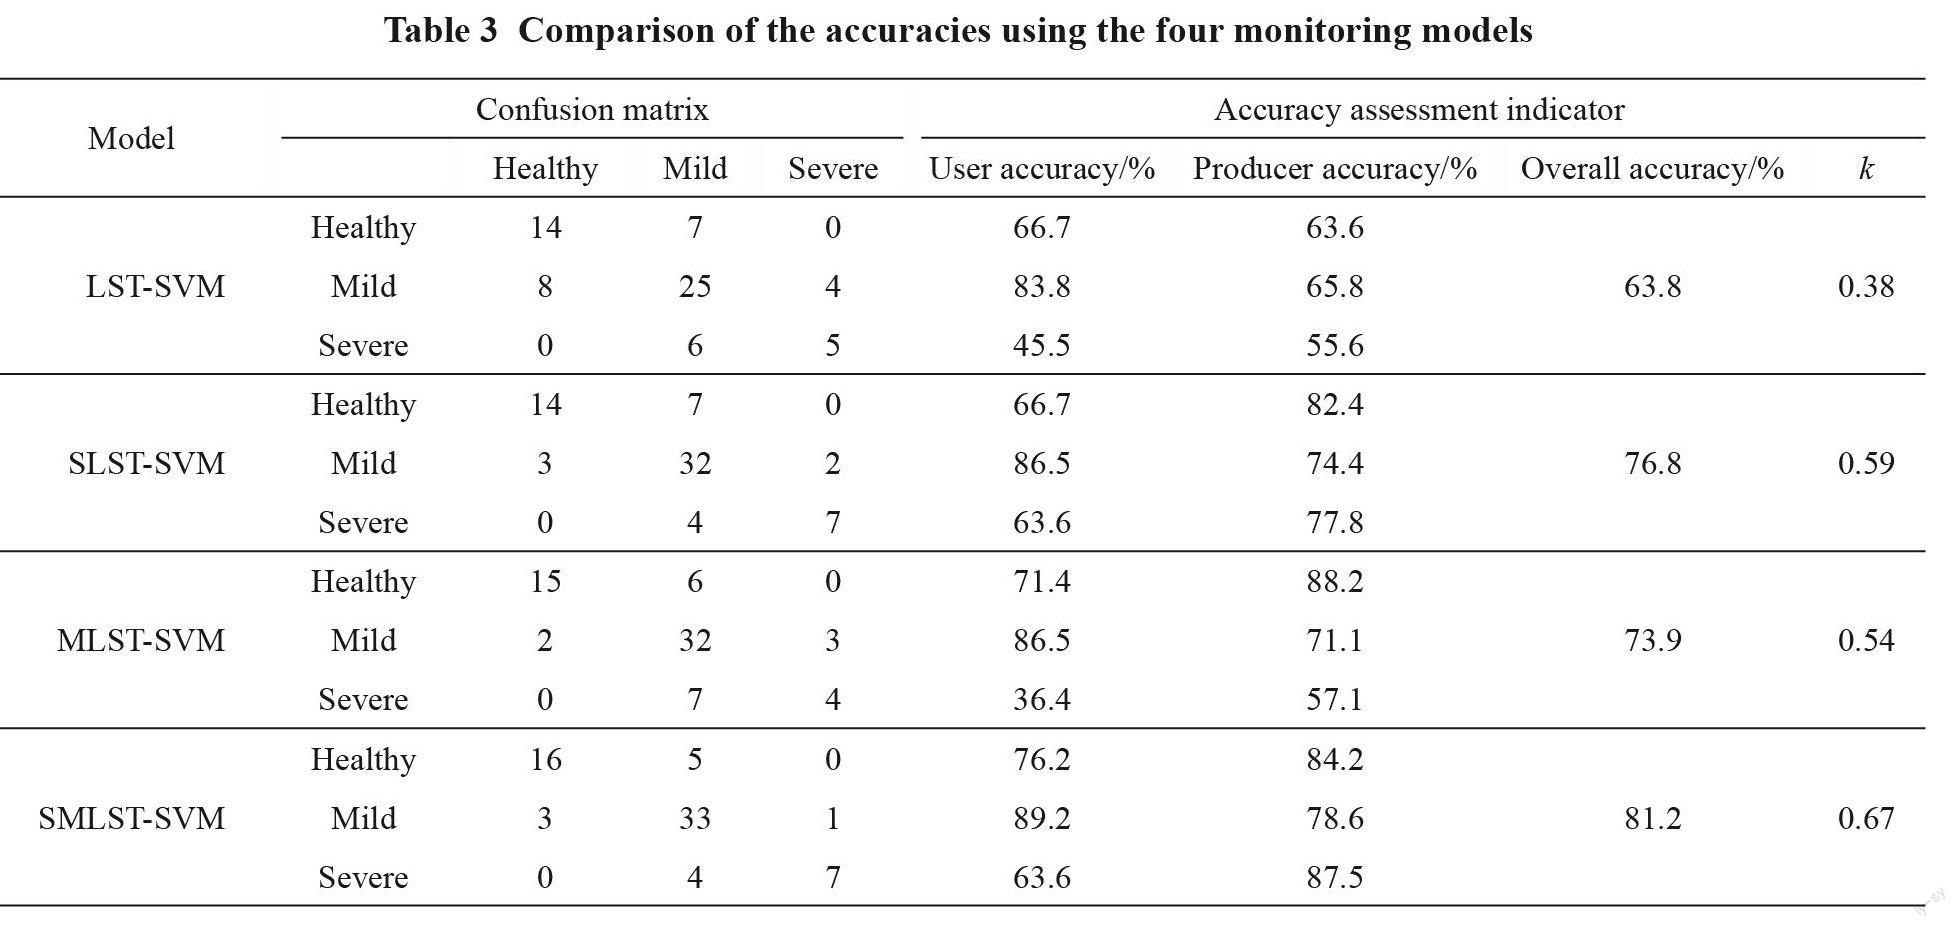
The cross-validation was adopted to estimatethe monitoring accuracies. As shown in Table 3,four indicators, namely the user accuracy (UA), pro ‐ducer accuracy (PA), overall accuracy (OA) and Kappa coefficient (k) were used to assess the four SVM-based models. It could be seen that the SLST- SVM and SMLST-SVM achieved better classifica‐tion performance. In terms of OA, the SMLST- SVM model obtained the best result, followed by the SLST-SVM and MLST-SVM models, while the LST-SVM model got the lowest value. The OAs of models indicated that the LST had a cumulative ef‐fect on the wheat powdery mildew infection. The k values of SMLST-SVM, MLST-SVM SLST-SVM and LST-SVM were 0.67, 0.54, 0.59 and 0.38, re‐spectively, which also showed the similar trend withOAs. From the perspective of UA, the ability of thefour models to distinguish diseased and healthywheat was strong. The differentiation ability ofSLST-SVM and SMLST-SVM models for mild andsevere wheat powdery mildew were significantlyhigher than that of LST-SVM model. The accura‐cies of MLST-SVM model were slightly lower thanthose of SLST-SVM and SMLST-SVM models,mainly due to the low spatial resolution ofMOD11A1 data on the city scale. The above resultsshow that the introduction of multi-temporal and cu ‐mulative LST can effectively improve the monitor‐ing and identification of wheat powdery mildew se‐verities.
Huang et al.[37] identified wheat powdery mil‐ dew of the study area using 30 m-resolution Chi‐nese HJ-1A/1B data to inverse LST and extract four-band reflectance data and build seven VIs. A combi‐ nation method (GaborSVM) of SVM and Gabor wavelet features were proposed to obtain the OA of 86.7% that was higher than 81.2% of this study, but the OA of SVM-based method was 80% and lower than this study. The primary reason is that the spa‐tial resolution of HJ-1B IRS is 300 m, but it is just 1000 m for MOD11A1. The comparison studyshows that spatial resolution of optical and thermalinfrared satellite remote sensing images is an impor‐tant factor of affect the accuracy of wheat powderymildew.
3.2 Mapping of wheat powdery mildew
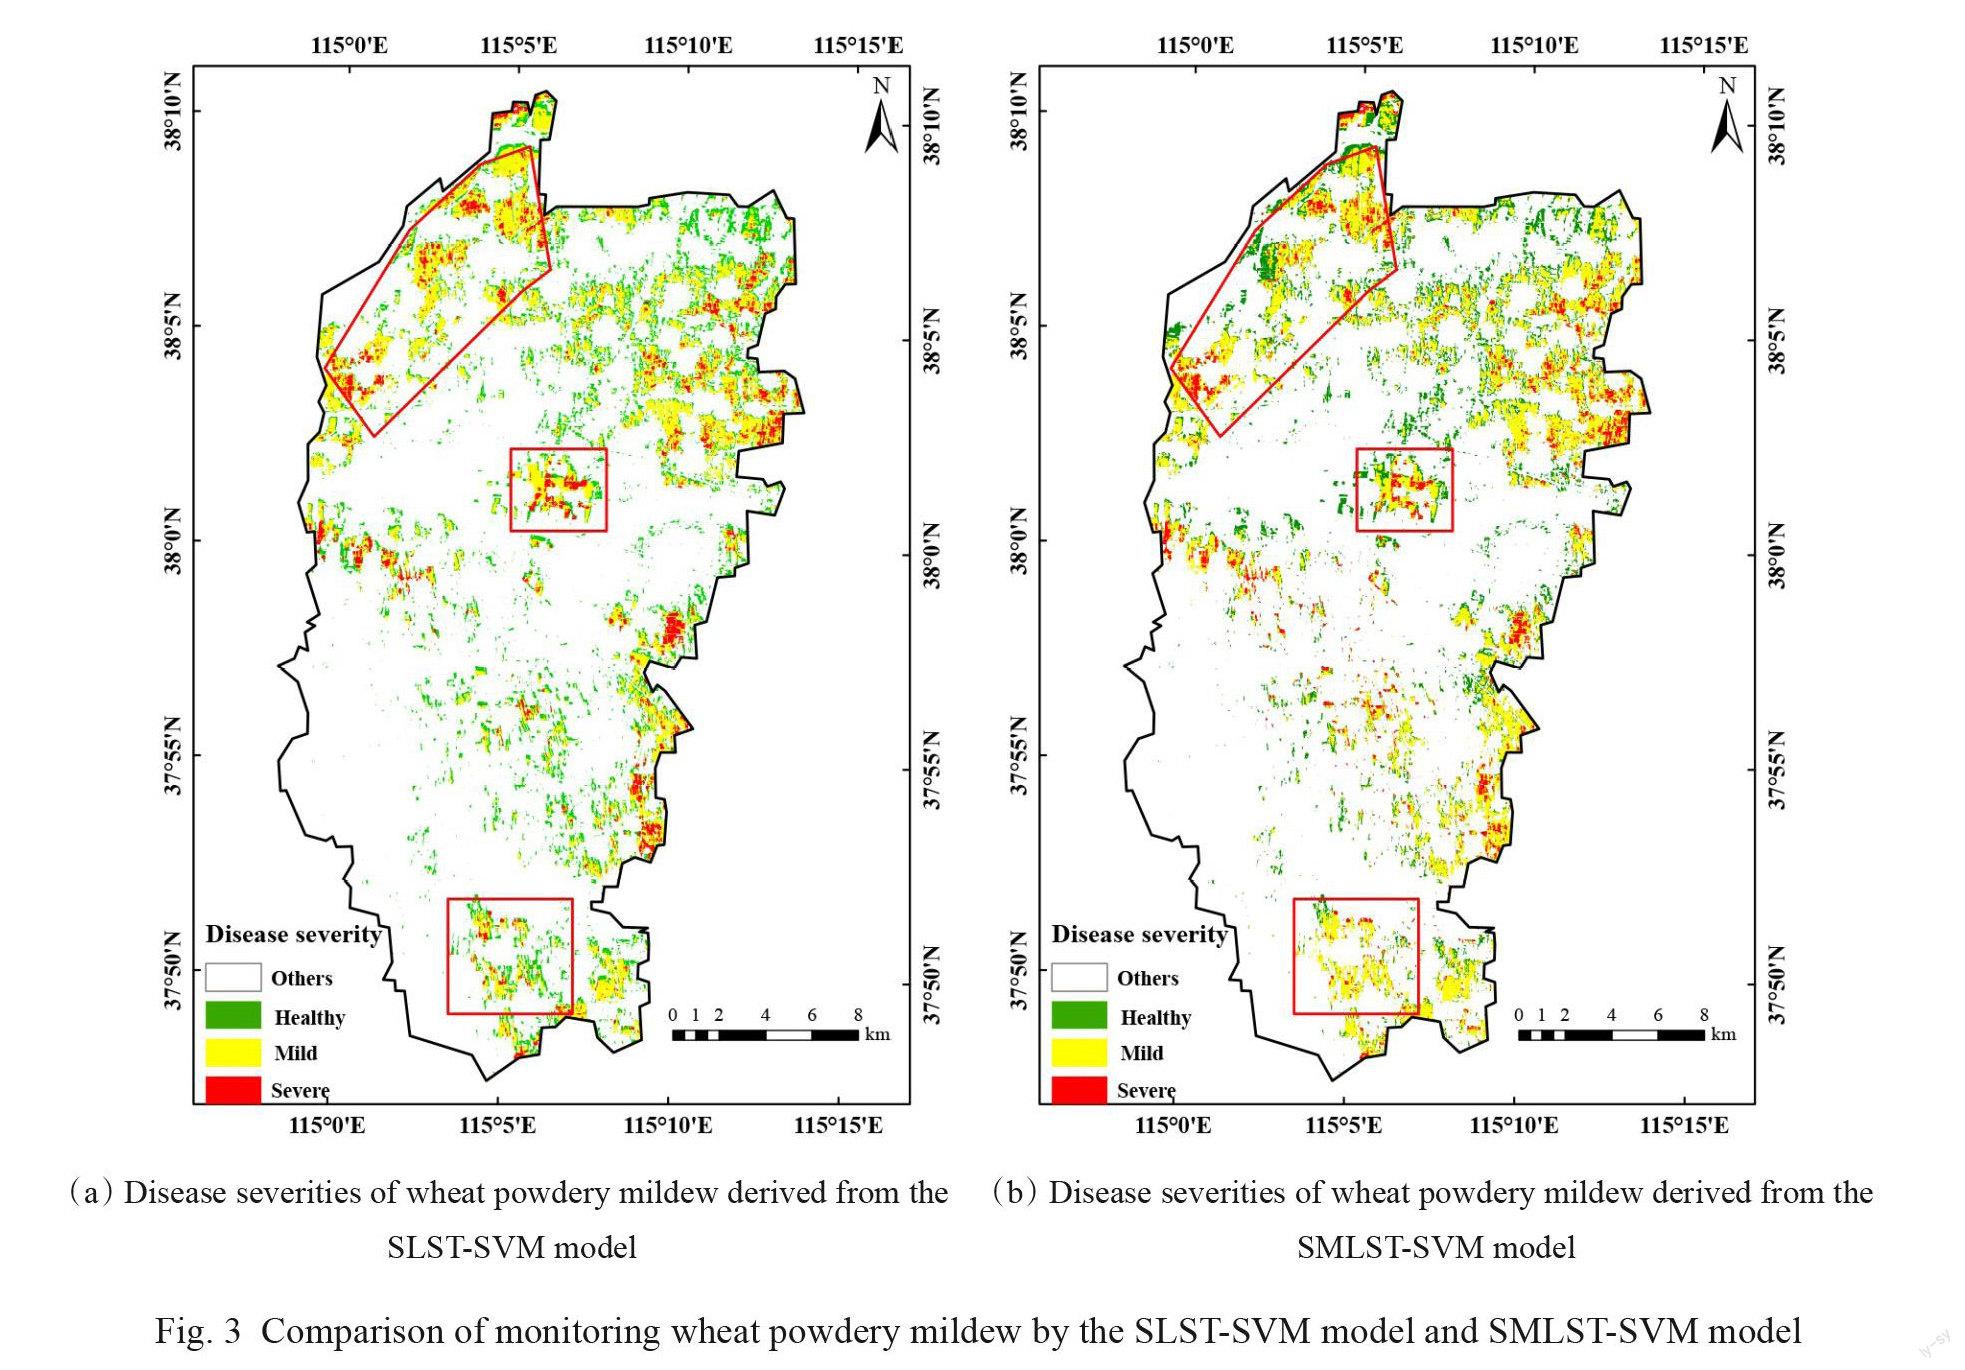
Based on multisource and multitemporal Land‐sat-8, GF-1 and MODIS data, three VIs of SIPI, SA ‐VI and EVI were optimally selected by the ReliefFalgorithm and correlation analysis. The VIs andfour temperature data of LST, SLST, MLST andSMLST were respectively used to construct four monitoring models through the SVM, namely the LST-SVM, SLST-SVM, MLST-SVM and SMLST- SVM. For example, the severity distribution on 26 May 2014 in Jinzhou was shown in Fig.3 using the SLST-SVM and SMLST-SVM models. The overall spatial distribution of wheat powdery mildew usingthe two monitoring models were similar. Neverthe‐less, there were also some obvious differences asshown in the red boxes. It was more serious in theeastern part than in the western part of the study ar‐ea. It was also obvious that the wheat powdery mil‐dew mainly occurred in the areas where wheat waswidely planted.
In the central regions where the ground-truth points were located, the monitoring results of the two models were also similar by visual observation. In the two figures, the distribution trends of wheat powdery mildew were both relatively concentrated. In comparison with the 32% of healthy samples, 55% of mild samples and 13% of severe samples for the in-situ investigation, they were 37%, 49% and 14% for the SLST-SVM model and 31%, 55% and 14% for SMLST-SVM model, respectively. It can be seen that the SMLST-SVM model had a bet‐ter result than SLST-SVM model.
3.3 Analysis of influence factors
Temperature is one of the key factors to affectthe incidence of wheat powdery mildew, however, itis difficult and inaccurate to identify the disease insmall and medium-sized regions, due to constraintof low spatial resolution of regular meteorologicaldata. Ma et al.[38] combined meteorological and re‐mote sensing data to monitor wheat powdery mil‐dew, because the distribution of meteorological sta‐tions was too sparse. The primary objective of thisstudy is to compare the relationship between LST and the disease severities of wheat powdery mil‐ dew. It can be found that different LST data have significant impact on the accuracies of the disease diagnosis. For example, in the retrieval of LST from Landsat-8 data, the two-channel nonlinear splitter used in this paper was more reliable than the single- channel method[39]. The spatial resolution of Land‐ sat-8 TIRS data and the temporal resolution of MOD11A1 data can both meet the requirements. Therefore, the combination and fusion of both the images were performed to acquire a better perfor‐mance. The accumulated temperature and effective accumulated temperature are key factors to affect wheat powdery mildew[40]. Multitemporal LST is better to show the temperature influence on the dis‐ ease monitoring than a single one.
4 Conclusion
It is a progressive process for the occurrence of wheat powdery mildew, the cumulative effect must be considered with the disease development. To ac‐curately identify the disease, multisource and multi‐ temporal GF-1, Landsat-8 and MOD11A1 were jointly utilized at a city scale. The vegetation fea‐tures and LSTs are simultaneously adopted to mon‐itor the disease for improving the classification ac‐ curacy.
To find out the most sensitive vegetation fea‐tures to wheat powdery mildew, four most impor‐ tant growth stages were selected including the stand‐ing stage, jointing stage, flowering stage and milk‐ing stage, which are also the criteria for selecting satellite images. Additionally, it has a progressive process for the disease incidence with the growth of wheat and changes of meteorological factors. As one of the most essential influencing factors, the ac‐ cumulative effects in LSTs must be considered when identifying the disease. Landsat-8 TIRS hashigh spatial resolution but low temporal resolution,however, it is quite contrary to MOD11A1. As a re‐sult, the STARFM was selected to perform the spa‐tial-temporal fusion of both data. Four SVM modelswere respectively constructed through a singleLandsat-8 LST (LST), multitemporal Landsat-8LSTs (SLST), cumulative MODIS LST (MLST)and the combination of cumulative Landsat-8 andMODIS LST (SMLST).
The OA of LST-SVM model was improved by13% using the four temporal LSTs. In addition, theKappa coefficient also increased from 0.38 to 0.59,indicating that LST is a key habitat factor for the oc‐currence and development of wheat powdery mil‐dew, due to a cumulative effect. On the other hand,the accuracies of MLST-SVM model were smallerthan that of SLST-SVM and SMLST-SVM models,indicating that it is inappropriate to apply MOD11A1data directly to the monitoring of wheat powderymildew in a relatively small area. Conversely, theperformance of SMLST-SVM is slightly better thanthat of SLST-SVM, indicating that the monitoringperformance can be enhanced by using a combina‐tion and fusion of high-resolution spatial-temporalremote sensing data.
References:
[1] ZHANG J, WANG N, YUAN L, et al. Discriminationof winter wheat disease and insect stresses using con‐tinuous wavelet features extracted from foliar spectralmeasurements[J]. Biosystems Engineering, 2017, 162:20-29.
[2] FENG W, SHEN W Y, HE L, et al. Improved remotesensing detection of wheat powdery mildew using dual-green vegetation indices[J]. Precision Agriculture,2016, 17(5):608-627.
[3] GALLEGO F J, KUSSUL N, SKAKUN S, et al. Effi‐ciency assessment of using satellite data for crop areaestimation in Ukraine[J]. International Journal of Ap‐plied Earth Observation and Geoinformation, 2014, 29:22-30.
[4] SETHY P K, BARPANDA N K, RATH A K, et al. Im‐age processing techniques for diagnosing rice plant dis‐ease: A survey[J]. Procedia Computer Science, 2020, 167:516-530.
[5] YANG C. Remote sensing and precision agriculturetechnologies for crop disease detection and manage‐ment with a practical application example[J]. Engineer‐ing, 2020, 6(5):528-532.
[6] ZHENG Q, YE H, HUANG W, et al. Integrating spec‐tral information and meteorological data to monitor wheat yellow rust at a regional scale: A case study[J]. Remote Sensing, 2021, 13(2): ID 278.
[7] HUANG W J, LAMB D W, NIU Z, et al. Identificationof yellow rust in wheat using in-situ spectral reflec‐tance measurements and airborne hyperspectral imag‐ing[J]. Precision Agriculture, 2007, 8(4-5):187-197.
[8] ZHANG J C, PU R L, WANG J H, et al. Detectingpowdery mildew of winter wheat using leaf level hy‐perspectral measurements[J]. Computers and Electron‐ics in Agriculture, 2012, 85:13-23.
[9] LUO J H, ZHAO C J, HUANG W J, et al. Discriminat‐ing wheat aphid damage degree using 2-dimensional feature space derived from Landsat 5 TM [J]. Sensor Letters, 2012, 10(1-2):608-614.
[10] ZHENG Q, HUANG W, CUI X, et al. New spectral in‐dex for detecting wheat yellow rust using sentinel-2 multispectral imagery[J]. Sensors, 2018, 18(3): ID 868.
[11] HE L, QI S, DUAN J, et al. Monitoring of Wheat pow ‐dery mildew disease severity using multiangle hyper‐ spectral remote sensing[J]. IEEE Transactions on Geo‐ science and Remote Sensing, 2020, 59(2):979-990.
[12] ZHAO J, FANG Y, CHU G, et al. Identification of leaf-scale wheat powdery mildew (Blumeriagraminis f. sp. Tritici) combining hyperspectral imaging and an SVM classifier[J]. Plants, 2020, 9(8): ID 936.
[13] KHAN I H, LIU H, LI W, et al. Early detection of pow ‐dery mildew disease and accurate quantification of its severity using hyperspectral images in wheat[J]. Re‐ mote Sensing, 2021, 13(18): ID 3612.
[14] ZHAO J, XU C, XU J, et al. Forecasting the wheatpowdery mildew (Blumeriagraminis f. Sp. tritici) us‐ing a remote sensing-based decision-tree classification at a provincial scale[J]. Australasian Plant Pathology, 2018, 47(1):53-61.
[15] LIANG W, CARBERRY P, WANG G, et al. Quantify‐ing the yield gap in wheat-maize cropping systems of the Hebei Plain, China[J]. Field Crops Research, 2011, 124(2):180-185.
[16] CHEN H, ZHANG H, LI Y. Review on research of me‐teorological conditions and prediction methods of crop disease and insect pest[J]. Chinese Journal of Agrome‐teorology, 2007, 28(2):212-216.
[17] YUAN L, PU R L, ZHANG J C, et al. Using high spa‐tial resolution satellite imagery for mapping powderymildew at a regional scale[J]. Precision Agriculture,2016, 17(3):332-348.
[18] LOVELAND T R, IRONS J R. Landsat 8: The plans,the reality, and the legacy[J]. Remote Sensing of Envi‐ronment, 2016, 185:1-6.
[19] WANG W, LIANG S, MEYERS T. Validating MODISland surface temperature products using long-termnighttime ground measurements[J]. Remote Sensing ofEnvironment, 2008, 112(3):623-635.
[20] HUANG L, JIANG J, HUANG W, et al. Wheat yellowrust monitoring based on Sentinel-2 Image and BPNNmodel[J]. Transactions of the Chinese Society of Agri‐cultural Engineering, 2019, 35(17):178-185.
[21] LIU R, ZAHNG S, JIA R. Application of feature selec‐tion method in building information extracting fromhigh resolution remote sensing image[J]. Bulletin ofSurveying and Mapping, 2018, (2):126-130.
[22] BAO W, ZHAO J, HU G, et al. Identification of wheatleaf diseases and their severity based on elliptical-max‐imum margin criterion metric learning[J]. SustainableComputing: Informatics and Systems, 2021, 30: ID100526.
[23] QIN F, LIU D, SUN B, et al. Identification of alfalfaleaf diseases using image recognition technology[J].PLoS One, 2016, 11(12): ID e0168274.
[24] ROBNIK- ?IKONJA M, KONONENKO I. Theoreticaland empirical analysis of ReliefF and RReliefF[J]. Ma‐chine Learning, 2003, 53(1):23-69.
[25] JORDAN C F. Derivation of leaf‐ area index from qual ‐ity of light on the forest floor[J]. Ecology, 1969, 50(4):663-666.
[26] ROUSE J W, HAAS R H, SCHELL J A, et al. Moni‐toring vegetation systems in the great plains withERTS[C]// In Third ERTS Symposium Volume 1: Tech‐nical Presentations. Washington, DC, USA: NASA,1973:309-317.
[27] GAMON J A, PENUELAS J, FIELD C B. A narrow-waveband spectral index that tracks diurnal changes inphotosynthetic efficiency[J]. Remote Sensing of Envi‐ronment, 1992, 41:35-44.
[28] HUETE A R. A soil-adjusted vegetation index (SA ‐VI)[J]. Remote Sensing of Environment, 1988, 25(3):295-309.
[29] LIU H, HUETE A. A feedback based modification ofthe NDVI to minimize canopy background and atmo‐spheric noise[J]. IEEE Transactions on Geoscience andRemote Sensing, 1995, 33(2):457-465.
[30] BROGE N H, LEBLANC E. Comparing predictionpower and stability of broadband and hyperspectralvegetation indices for estimation of green leaf area in‐dex and canopy chlorophyll density[J]. Remote Sens‐ing of Environment, 2000, 76(2):156-172.
[31] RICHARDSON A J, WIEGAND C L. Distinguishingvegetation from soil background information[J]. Photo‐grammetric Engineering and Remote Sensing, 1977, 43(12):1541-1552.
[32] PENUELAS J, BARET F, FILELLA I. Semi-empiricalindices to assess carotenoids/chlorophyll a ratio from leaf spectral reflectance[J]. Photosynthetica, 1995, 31(2):221-230.
[33] DU C, REN H, QIN Q, et al. A practical split-windowalgorithm for estimating land surface temperature from Landsat 8 data[J]. Remote Sensing, 2015, 7(1):647-665.
[34] REN H, DU C, LIU R, et al. Atmospheric water vaporretrieval from Landsat 8 thermal infrared images[J]. Journal of Geophysical Research: Atmospheres, 2015, 120(5):1723-1738.
[35] GAO F, MASEK J, SCHWALLER M, et al. On theblending of the Landsat and MODIS surface reflec‐tance: Predicting daily Landsat surface reflectance[J]. IEEE Transactions on Geoscience and Remote Sens‐ing, 2006, 44(8):2207-2218.
[36] OLATOMIWA L, MEKHILEF S, SHAMSHIRBANDS, et al. A support vector machine-firefly algorithm-based model for global solar radiation prediction[J].Solar Energy, 2015, 115:632-644.
[37] HUANG L, LIU W, HUANG W, et al. Remote sensingmonitoring of winter wheat powdery mildew based onwavelet analysis and support vector machine[J]. Trans‐actions of the Chinese Society of Agricultural Engi‐neering, 2017, 33(14):188-195.
[38] MA H, HUANG W, JING Y. Wheat powdery mildewforecasting in filling stage based on remote sensingand meteorological data[J]. Transactions of the Chi‐nese Society of Agricultural Engineering, 2016, 32(9):165-172.
[39] XU H. Retrieval of the reflectance and land surfacetemperature of the newly-launched Landsat 8 satel‐lite[J]. Chinese Journal of Geophysics-Chinese Edi‐tion, 2015, 58(3):741-747.
[40] SHARMA A K, SHARMA R K, BABU K S, et al. Ef‐fect of planting options and irrigation schedules on de‐velopment of powdery mildew and yield of wheat inthe North Western plains of India[J]. Crop Protection,2004, 23(3):249-253.