基于无人机图像颜色与纹理特征的小麦不同生育时期生物量估算
2022-05-30戴冕杨天乐姚照胜刘涛孙成明
戴冕 杨天乐 姚照胜 刘涛 孙成明
摘要:為实现小麦生物量田间快速无损监测,开展基于不同密度、氮肥和品种处理的田间试验,应用无人机获取小麦越冬前期、拔节期、孕穗期和开花期4个时期的 RGB 图像,通过影像处理获取小麦颜色指数和纹理特征参数,并同时期通过田间取样获取小麦生物量;分析不同颜色指数和纹理特征参数与小麦生物量的关系,筛选出适合小麦生物量估算的颜色和纹理特征指数。结果表明,不同时期图像颜色指数和小麦生物量均有较高的相关性,且大部分达到极显著相关水平;图像纹理特征指数与小麦生物量的相关性较差,只有少数指标达到显著或极显著相关水平。基于上述结果,研究利用相关性最高的颜色指数或颜色指数与纹理特征指数结合构建小麦不同生育时期的生物量估算模型,并通过独立的实测生物量数据对模型进行了验证,模型模拟值与实测值之间的相关性均达到了极显著水平( P<0.01), RMSE 均较小。其中,颜色指数模型在4个时期的 R2分别为0.538、0.631、0.708和0.464,RMSE 分别为27.88、516.99、868.26和1539.81 kg/ha。而颜色和纹理指数结合的模型在4个时期的 R2分别为0.571、0.658、0.753和0.515, RMSE 分别为25.49、443.20、816.25和1396.97 kg/ha ,说明模型估算的结果是可靠的,且精度较高。同时结合无人机图像颜色和纹理特征指数的小麦生物量估测模型的效果要优于单一颜色指数模型。研究可为小麦田间长势实时监测与生物量估算提供新的手段。
关键词:小麦;无人机图像;颜色指数;纹理特征指数;生物量;纹理指数
Wheat Biomass Estimation in Different Growth Stages Based on Color and Texture Features of UAV Images
DAI Mian1,2 , YANG Tianle1,2 , YAO Zhaosheng1,2 , LIU Tao1,2 , SUN Chengming1,2*
(1. Jiangsu Key Laboratory of Crop Genetics and Physiology/Jiangsu Key Laboratory of Crop Cultivation andPhysiology, Agricultural College, Yangzhou University, Yangzhou 225009, China;2. Jiangsu Co-Innovation Centerfor Modern Production Technology of Grain Crops, Yangzhou University, Yangzhou 225009, China )
Abstract: In order to realize the rapid and non-destructive monitoring of wheat biomass, field wheat trials were con‐ ducted based on different densities, nitrogen fertilizers and varieties, and unmanned aerial vehicle (UAV) was used to obtain RGB images in the pre-wintering stage, jointing stage, booting stage and flowering stage of wheat. The col‐ or and texture feature indices of wheat were obtained using image processing, and wheat biomass was obtained by manual field sampling in the same period. Then the relationship between different color and texture feature indices and wheat biomass was analyzed to select the suitable feature index for wheat biomass estimation. The results showed that there was a high correlation between image color index and wheat biomass in different stages, the val‐ues of r were between 0.463 and 0.911(P<0.05). However, the correlation between image texture feature index and wheat biomass was poor, only 5 index values reached significant or extremely significant correlation level. Based on the above results, the color indices with the highest correlation to wheat biomass or the combining indices of color and texture features in different growth stages were used to construct estimation model of wheat biomass. The mod‐els were validated using independently measured biomass data, and the correlation between simulated and measured values reached the extremely significant level (P<0.01), and root mean square error (RMSE) was smaller. The R2 of color index model in the four stages were 0.538, 0.631, 0.708 and 0.464, and RMSE were 27.88, 516.99, 868.26 and 1539.81 kg/ha, respectively. The R2 of the model combined with color and texture index were 0.571, 0.658, 0.753 and 0.515, and RMSE were 25.49, 443.20, 816.25 and 1396.97 kg/ha, respectively. This indicated that the estimated results using the models were reliable and accurate. It also showed that the estimation models of wheat biomass com ‐bined with color and texture feature indices of UAV images were better than the single color index models. Key words: wheat; UAV image; color index; texture feature index; biomass; texture index
CLC number:S512 Documents code:A Article ID:SA202202004
Citation:DAI Mian, YANG Tianle, YAO Zhaosheng, LIU Tao, SUN Chengming. Wheat biomass estimation in dif‐ferent growth stages based on color and texture features of UAV images[J]. Smart Agriculture, 2022, 4(1):71-83.(in English with Chinese abstract)
戴冕, 楊天乐, 姚照胜, 刘涛, 孙成明.基于无人机图像颜色与纹理特征的小麦不同生育时期生物量估算[J].智慧农业(中英文), 2022, 4(1):71-83.
1 Introduction
Biomass is an important physical and chemical parameter in ecosystems and a significant index for assessing the life activities of vegetation and for monitoring growth and estimating crop yield[1]. Tra‐ditional biomass estimation methods are not only time-consuming and labor-intensive, but also can not conduct large-scale monitoring[2]. The rapid de‐velopment of remote sensing technology in recent years has accelerated its wide application in crop biomass estimation, as it is fast, accurate, and non- destructive[1].
Based on the spectral features of vegetation, previous studies have obtained many achievements in using vegetation indices to estimate biomass. Ji‐menez-Sierra et al.[3] proposed GBF-Sm-Bs ap ‐proach by obtaining biomass estimation correlation of 0.995 with R2 =0.991. This result increased the precision in the biomass estimation by about 62.43% compared to previous work. Hou et al.[4] built a biomass estimation model based on multiple vegetation indices, of which the index model of red edge location was used to estimate the wheat bio ‐ mass model, R2 were all greater than 0.8. Liu et al.[5] used arbor as an object to analyze the correlation be‐ tween biomass and biomass factors, and constructed a highly accurate forest biomass estimation model using the partial least-squares method, the correla‐tion coefficient between the predicted value and the measured value was 0.718, and the accuracy was 90.1%. However, the vegetation index is not sensi‐tive to canopy biomass changes in high-density sce‐narios and deviates easily when inverting physical and chemical parameters or even agronomic param ‐eters, thus affecting the accuracy of the estimation model[6]. In response, some scientists have added texture feature information to the spectral features to improve saturation when only spectral informa‐tion is available, as well as to improve the spatialand temporal discrimination of image informationand the estimation potential of agronomic parame‐ters[7].
Some researchers have quantitatively analyzedthe application of texture features in agronomic pa‐rameters. Gu et al.[8] studied vegetation coverageand found that the combination of vegetation indi‐ces and texture feature indices could improve the ac‐curacy of vegetation coverage estimation. Sarkerand Nichol[9] assessed the biomass of arbor forestand found that the combination of vegetation indi‐ces and texture features was better at biomass esti‐mation. Cao et al.[10] extracted the texture featuresand spectral features of thematic mapper imagesand established a biomass regression estimationmodel, which could effectively estimate the bio ‐mass of mangrove wetlands. Mu et al.[11] constructeda multivariate regression model of vegetation indi‐ces, texture features, and vegetation biomass usingfour typical vegetation indices, and R2 of the modelwas 0.713, the minimum RMSE was 98.2543 g/m2.Based on the above researches, it was found that theaccuracy of the model for estimating biomass incombination with texture features was higher thanthe accuracy of the model for estimating biomassusing a single vegetation index with color fea‐tures[12].
In terms of monitoring crop growth based onunmanned aerial vehicle (UAV) images, Lee et al.[13]used RGB (Red Green Blue) cameras to obtain ricecanopy images and found that the absolute value ofgreen light depth (G) simulated by the exponentialequation was well correlated with the abovegroundbiomass and leaf area index (LAI). Wang et al.[14]demonstrated that the G-R value of rice RGB imag‐es had a good relationship with biomass and LAI,which could be used to construct an estimation mod‐el. Wang et al.[15] used random forest-support vector regression (RF-SVR) model to estimate soil and plant analyzer development (SPAD) values of the wheat canopy and achieved high accuracy (R2=0.754, RMSE=1.716). Yue et al.[16] combined UAV remote sensing and AquaCrop to estimate winter- wheat biomass, the predicted biomass agreed with the measured values (R2=0.61, RMSE=2.10 t/ha). Shan et al.[17] used explored the vertical distribution of wheat biomass and found that a linear regression relationship could be better obtained with a single row of wheat images, and the estimation accuracy was also higher than multi-row wheat image.
In this study, UAVs were used to obtain RGB images of wheat in different growth periods, and si‐multaneous sampling was conducted in the field to determine wheat biomass. The best color and tex‐ture feature indices were determined through corre‐lation analysis, and these indices were used to con ‐ struct the estimation models of wheat biomass in different growth periods based on UAV platform in order to provide a new method for biomass estima‐tion and real-time monitoring of wheat growth in the field.
2 Materials and methods
2.1 Field experiment design
Two experiments were conducted in this study, of which the data from Experiment 1 were used to construct a wheat biomass estimation model and the data from Experiment 2 were used for model valida‐tion. Study sites were located in Yizheng city andZhangjiagang city, Jiangsu province.
2.1.1 Experiment 1 for estimation model Experiment 1 was conducted in Yizheng from
2018 to 2019. Two wheat varieties of Yangmai23 and Yangfumai4 were selected as the research ob‐jects. Three planting densities were respectively setas:1 million plants/ha, 1.5 million plants/ha, and 2million plants/ha. Four nitrogen fertilizer levels wererespectively set as:0 kg/ha, 120 kg/ha, 160 kg/ha,and 200 kg/ha. Nitrogen fertilizers were applied ac‐cording to the ratio of base fertilizer: new shootsboosting fertilizer: jointing fertilizer: booting fertil‐izer =5:1:2:2, and the phosphorus and potassiumfertilizers were applied according to the ratio ofbase fertilizer: jointing fertilizer =5:5, and the appli‐cation amounts all were 120 kg/ha. Wheat wasplanted on November 2, 2016, with a plot area of16.65 m2. Each treatment was repeated twice for atotal of 48 experimental plots.
2.1.2 Experiment 2 for model validation
Experiment 2 was conducted in Zhangjiagangfrom 2017 to 2018. The wheat variety, density, andfertilizer were the same as Experiment 1. Wheatwas planted on November 10, 2017, with a plot areaof 30 m2. Each treatment was repeated twice for atotal of 48 experimental plots.
2.2 Data acquisition method
2.2.1 Image acquisition device
The Inspire 1 RAW UAV (DJI, Shenzhen, Chi‐na) was used for image data acquisition. This UAVis small, powerful, convenient and easy to operate,equipped with a 16-megapixel camera and is able tofly for 15-20 min depending on the load. The re‐mote control was connected to the wireless followerto extend the control distance to 5 km.
2.2.2 Image acquisition
UAV image acquisition runs through the pre-wintering period, jointing period, booting period,and flowering period, and sampling time was about8:00-10:00 AM or 3:00-5:00 PM. In this study, DJIGS Pro was used to automatically generate flightroutes within the designated area, and automaticflight, automatic shooting, and complete relevantdata receiving, processing and sending. The flight route of UAV was s-type, and the flight altitude was set to 15 m. In order to achieve accurate image reg ‐istration, the image repetition rate was set to 60% on the main route and 70% between the main route during route and point planning. The standard cali‐bration panels were used to perform radiation cali‐bration on RGB band sensors during flight to mini‐mize the influence of constantly changing lighting conditions on RGB images. After the aerial images were collected, the orthophoto image was generated by using the software Pix4DMapper, and the imag‐ es were stitched together seamlessly through feature matching of adjacent images[18].
2.2.3 Determination of aboveground biomass
In the pre-wintering period, jointing period, booting period, and flowering period of wheat growth, 15 wheat plants were selected from each plot, the aboveground parts of plants were collected and transported back to the laboratory, and were dried in an oven for 1.5 h at 105°C and then at 80°C until constant weight, and then were weighed and converted to biomass per unit area.
2.3 Data analysis and utilization
2.3.1 UAV image preprocessing method MATLAB2014a software was used for UAVimage preprocessing, including image cropping, de‐noising, smoothing, and sharpening. Image crop ‐ping stitches the images into uniform images ac‐cording to different cells. Denoising eliminates thenoise in digital images. Smoothing and sharpeningreduce the slope of the image, improve the imagequality, and reduce the loss of pixel extraction fromthe target.
2.3.2 Color indices
Eight commonly used color indices were se‐lected for UAV image data analysis, including visualatmospheric resistance vegetation index (VARI)[19] ,excess red vegetation index (ExR)[20] , excess greenvegetation index (ExG)[21] , green leaf vegetation in ‐dex (GLI)[22] , excess green-red difference index(ExGR)[20] , normalized difference index (NDI)[23] ,modified green red vegetation index (MGRVI)[24]and red green blue vegetation index (RGBVI)[24] , asshown in Table 1.
2.3.3 Texture feature indices
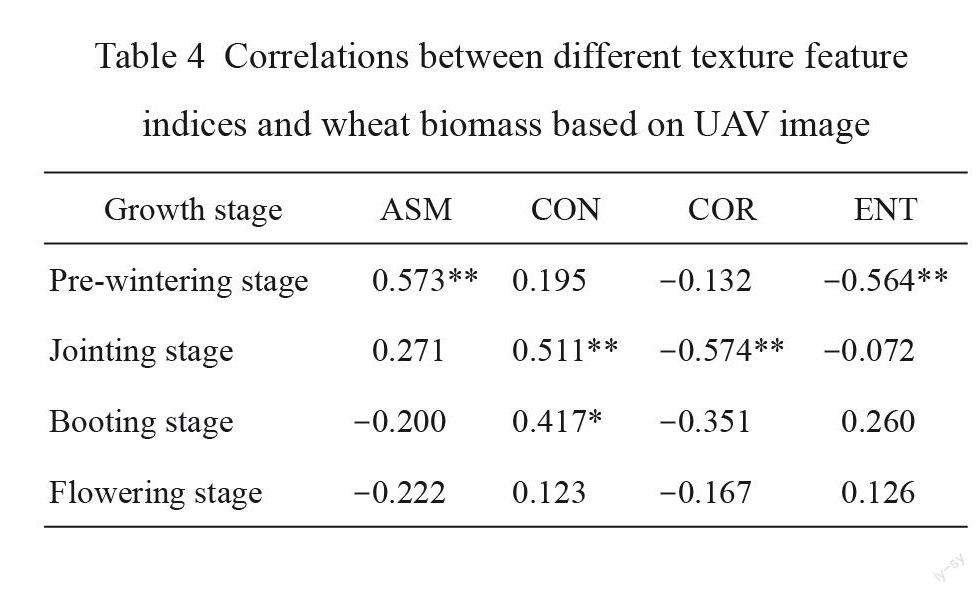
MATLAB software was used to extract texture features based on a gray level co-occurrence ma‐trix[25]. Four common texture features were extractedfrom the UAV image: angular second moment(ASM), contrast (CON), correlation (COR) and en‐tropy (ENT)[25] , as shown in Table 2.
2.4 Model construction and evaluation
Based on the correlation between image color and texture feature indices and wheat biomass, the color and texture feature indices with the largest correlation coefficient were selected to construct the regression model for biomass estimation (Experi‐ment 1 data). Then the independently measured bio ‐ mass data were used to validate and evaluate the model based on the coefficient of determination(R2), root mean square error (RMSE), and 1:1 map(Experiment 2 data).
3 Results and analysis
3.1 Correlation between wheat biomass and image color/texture feature indi ? ces in different growth periods
Wheat biomass experiences various changesthroughout the growth period and undergoes a pro ‐cess of continuous increase. In this study, the datain Experiment 1 were used to quantitatively analyzethe correlation between eight color indices as wellas four texture feature indices in the main growthperiods of wheat and biomass to determine the opti‐mal color index and texture feature index for esti‐mating biomass. The correlation between the differ‐ent color indices as well as the texture feature indi‐ces and wheat biomass based on the UAV image areshown in Table 3 and Table 4.
3.2 Biomass estimation models for wheat growth in different growth peri ? ods based on color indices
3.2.1 Model construction
(1) Estimation model of wheat biomass in thepre-wintering period
It can be seen from Table 1 that the correlationbetween the color indices of the UAV image andbiomass was good during this period. Besides NDI,the correlation between the other seven indices andbiomass was extremely significant (P<0.01), among which the correlation of VARI and biomass was the highest, with the correlation coefficient r reaching 0.743. Therefore, the color index VARI was chosen as the independent variable. The wheat biomass esti‐mation model was constructed by using regression analysis:
B1=535.9×VARI+87.9 (13)
where B1 represents the biomass of wheat in the pre- winter period, kg/ha. The coefficient of determina‐tion R2 was 0.553.
(2) Estimation model of wheat biomass in the jointing period
The correlation between the color indices andbiomass of the UAV image in the jointing period was the highest, and eight color indices reached a highly significant correlation level. Among them, ExGR had the highest correlation with biomass, and the correlation coefficient r reached 0.911. There‐ fore, the color index ExGR was selected as the inde‐ pendent variable, and the wheat biomass estimation model is:
B2=9054.6×ExGR+1915.5 (14)
where B2 represents the biomass of wheat in the jointing period, kg/ha. It was constructed using re‐gression analysis, with a coefficient of determina‐tion R2 of 0.804.
(3) Estimation model of wheat biomass in the booting period
With the gradual advancement of wheat growth and the increasing biomass, the color of the UAV image will become saturated, and its correla‐tion with biomass will be correspondingly weak‐ened. The correlation between UAV image color in ‐ dices and biomass in the booting period was signifi‐cantly lower than that in the jointing period. Only six indices were significantly correlated. Among them, MGRVI had the highest correlation with bio ‐mass, and the correlation coefficient r was 0.817.Therefore, the color index MGRVI was chosen asthe independent variable, and the wheat biomass es‐timation model is:
B3=20024.1×MGRVI?543.2 ( 15)
where B3 represents the biomass of wheat in thebooting period, kg/ha. It was constructed using re‐gression analysis, with an R2 of 0.670.
(4) Estimation model of wheat biomass in theflowering period
The canopy image in the flowering period con ‐tains different types of objects such as the ear andleaf, and the correlation between image color indi‐ces and biomass is further reduced. During this peri‐od, the correlation between the UAV image color in ‐dices and biomass was the lowest among the fourperiods, three of which being non-significant, onebeing significantly correlated, and the other fourreaching extremely significant levels, of which thecorrelation of VARI and biomass was the highestand the correlation coefficient r was 0.679. There‐fore, the color index VARI was selected as the inde‐pendent variable, and the wheat biomass estimationmodel is:
B4=42623.1×VARI+7115.3 (16)
where B4 represents the biomass of wheat in theflowering period, kg/ha. It was constructed using re‐gression analysis, and the R2 was 0.461.
3.2.2 Model validation
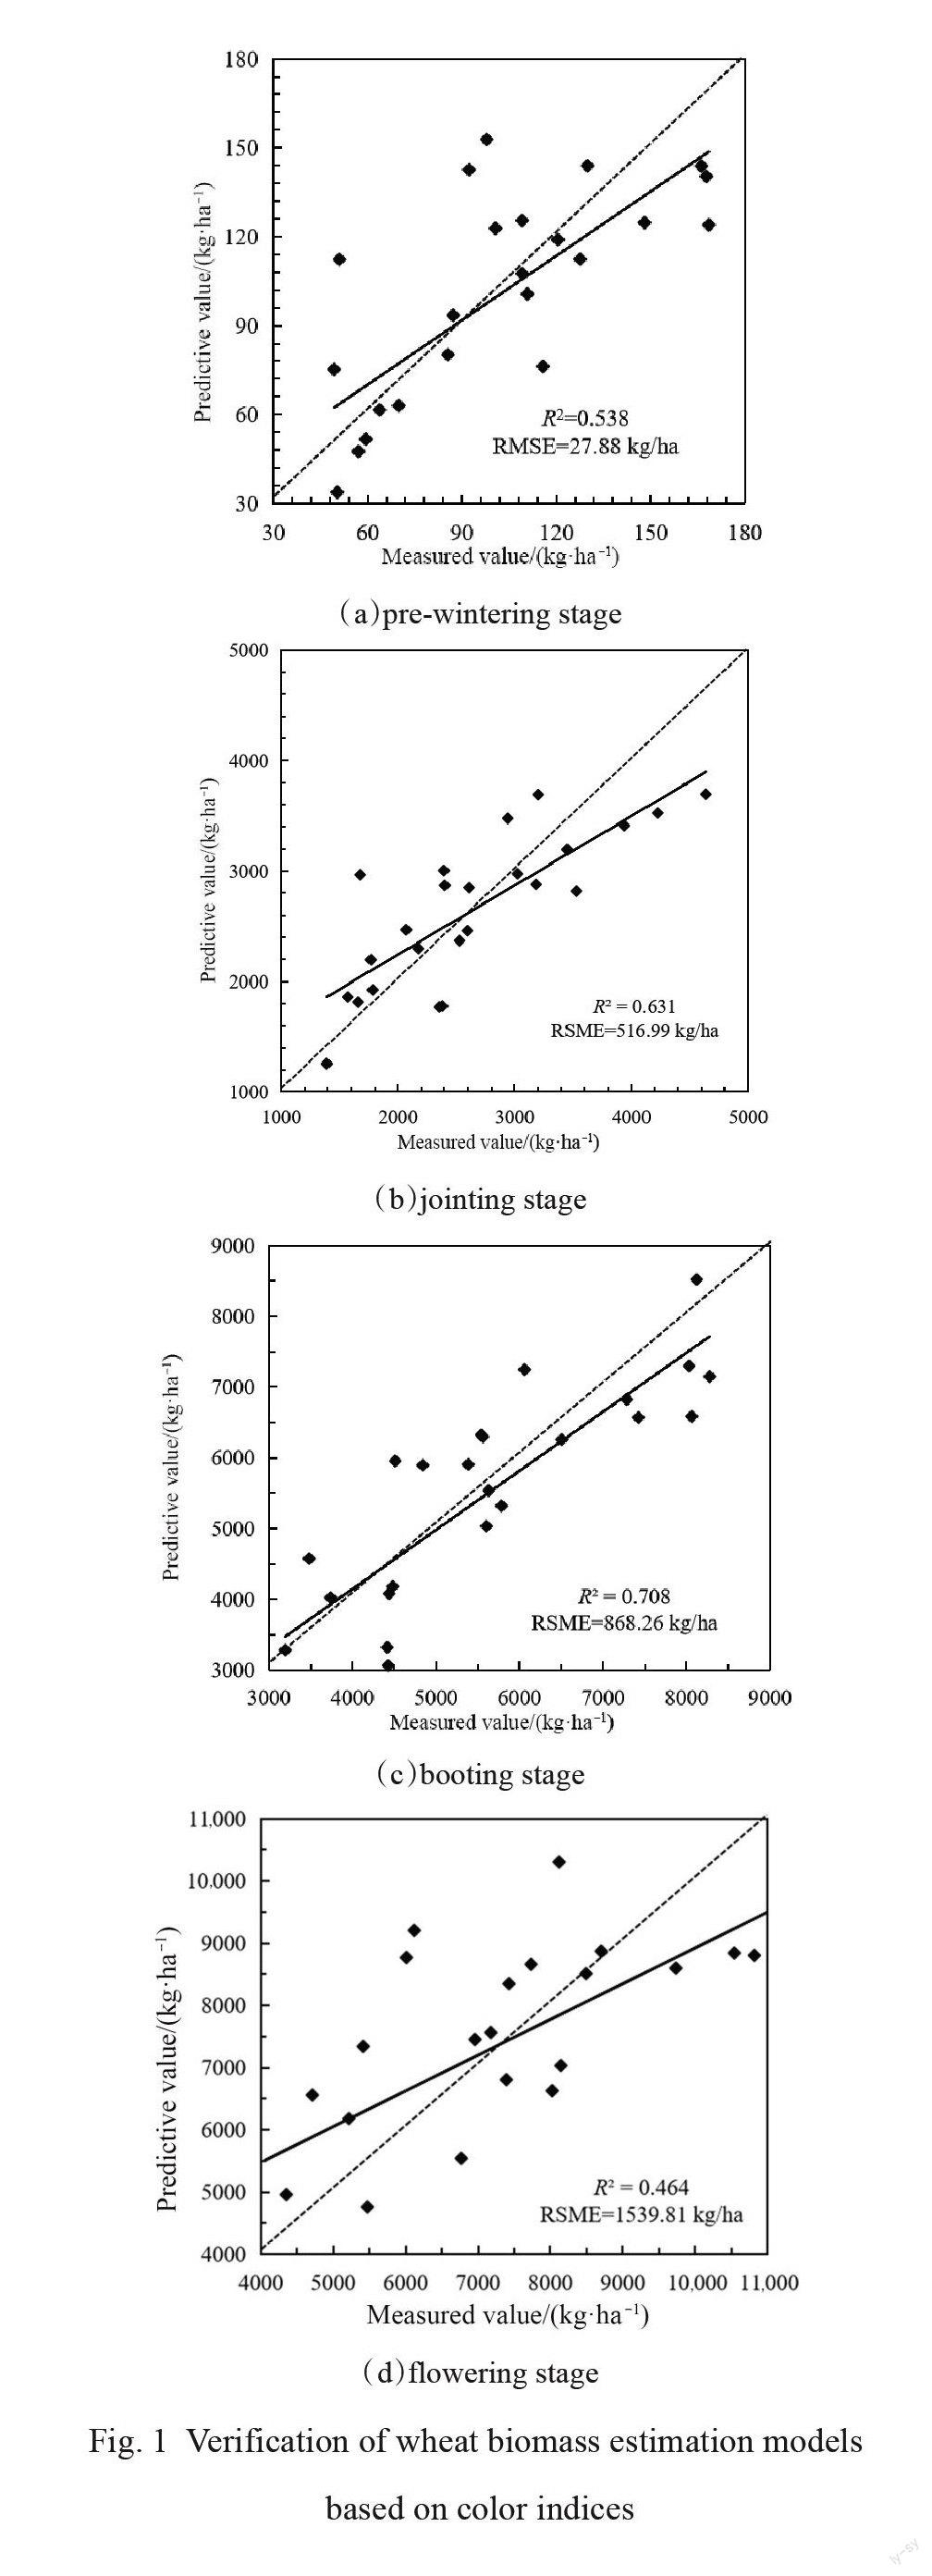
(1) Validation of the wheat biomass estimationmodel in the pre-wintering period
Independently measured data were used to vali‐date the wheat biomass estimation model in the pre-wintering period and plot the 1:1 relationship be‐tween the measured values and the model predic‐tions (Fig.1(a)). It is evident from the figure thatthere was high agreement between the predictedand measured values of wheat biomass in the pre-wintering period, and the predicted R2 of the modelwas 0.538. Correlation analysis showed that the cor‐ relation between the predicted value and the mea‐sured value reached a highly significant level, indi‐cating that the estimation model is feasible. In addi‐tion, the simulated RMSE was 27.88 kg/ha, which is relatively small, indicating that the simulation re‐sults of the model are relatively reliable.
(2) Validation of the wheat biomass estimation model in the jointing period
The validation results of the estimation model in the jointing period are shown in Figure 1(b). The predicted value of wheat biomass in the jointing pe‐riod was close to the measured value, and there was high consistency between the two. The predicted R2 of the model was 0.631, and the effect was better than the pre-wintering period. Correlation analysis indicated that the correlation between the predicted value and the measured value reached a highly sig ‐nificant level, indicating that the estimation model is feasible. In addition, the simulated RMSE was 516.99 kg/ha, which is relatively small, indicating that the simulation results of the model are relative‐ly reliable.
(3) Validation of the wheat biomass estimation model in the booting period
The results of the estimation model in the boot‐ing period are shown in Figure 1(c). It can be seen from the figure that the predicted value of wheat biomass in the booting period was close to the mea‐sured value, and there was high consistency be‐ tween the two. The predicted R2 of the model was 0.708, and the effect was better than the jointing pe‐riod. Correlation analysis indicated that the correla‐tion between the predicted value and the measured value was significant, indicating that the estimation model is feasible. In addition, the simulated RMSE was 868.26 kg/ha, which is relatively small, indicat‐ing that the simulation results of the model are rela‐tively reliable.
(4) Validation of the wheat biomass estimationmodel in the flowering period
The validation results of the estimation modelin the flowering period are shown in Figure 1(d).The predicted value of wheat biomass in the flower‐ing period was close to the measured value, andthere was a good agreement between the two. Themodel predicted an R2 of 0.464, and the effect wasthe poorest among the four periods. However, thecorrelation analysis demonstrated a correlation be‐tween the predicted value and the measured value,indicating that the estimation model is feasible. Inaddition, the simulated RMSE was 1539.81 kg/ha,which is relatively small, indicating that the simula‐tion results of the model are relatively reliable.
In summary, the UAV image color indicescould be used to estimate wheat biomass in differ‐ent growth periods, and the effects in the differentperiods also differed. However, wheat biomass esti‐mation using a single color index did not achievethe best results.
3.3 Wheat biomass estimation models in different growth periods based on color and texture feature indices
3.3.1 Model construction
(1) Estimation model of wheat biomass in thepre-wintering period
It can be seen from Table 4 that the correlationbetween UAV image texture indices and biomass inthe pre-wintering period was high, however, it waspoorer than the color indices. Among the four tex‐ture feature indices, two were not significantly cor‐related, whereas the other two were significantlycorrelated, of which ASM had the highest correla‐tion with biomass, with a correlation coefficientof 0.573. Therefore, the texture feature index
ASM was combined with the color index VARI, andthe wheat biomass estimation multiple regressionmodel is:
B5=547.9×VARI?35.9×ASM+97.2 (17)
where B5 represents the biomass of wheat in the pre-winter period combining VARI and ASM. The R2was 0.565, and the accuracy was slightly improvedcompared with the single color index model (2.17%increase).
(2) Estimation model of wheat biomass in thejointing period
From the pre-wintering period to the jointingperiod, the UAV image texture indices did not im‐prove significantly. Among the four texture featureindices, only two had a significant correlation withbiomass, with COR exhibiting the highest correla‐tion with an r of 0.574(Table 4). Therefore, the tex‐ture feature index COR was combined with the col‐or index ExGR. The wheat biomass estimation mul‐tiple regression model is:
B6=8762.5×ExGR?259.4×COR+2075.8 (18)
where B6 represents the biomass of wheat in thejointing period combining ExGR and COR. The R2was 0.833, and the accuracy was improved com ‐pared with the single color index model (3.61% in ‐crease).
(3) Estimation model of wheat biomass in thebooting period
The colors of the wheat UAV images in thebooting period showed a certain saturation phenom ‐enon, and the texture feature indices were also af‐fected. Among the four texture feature indices, onlyCON was significantly correlated with biomass,with an r of 0.417(Table 4). Therefore, the texturefeature index CON was combined with the color in ‐dex MGRVI, and the wheat biomass estimation mul‐tiple regression model is:
B7=24027.4×MGRVI?3098.6×CON+2252.3(19)
where B7 represents the biomass of wheat in the booting period combining MGRVI and CON. The R2 was 0.762, and the accuracy was significantly im‐ proved compared with the single color index model (13.73% increase).
(4) Estimation model of wheat biomass in the flowering period
The correlation between UAV image texture feature indices and wheat biomass in the flowering period was relatively low, and the correlation be‐ tween the four feature indices and wheat biomass did not reach a significant level (Table 4). Therefore, the index ASM with the highest correlation coefficient was selected and combined with the color index VARI. The wheat biomass estimation multiple re‐gression model is:
B8=42654.9×VARI?5595.3×ASM+8507.9(20) where B8 represents the biomass of wheat in the flowering period combining VARI and ASM. The R2 was 0.485. The accuracy was much higher than the single color index model (5.21% increase).
3.3.2 Model validation
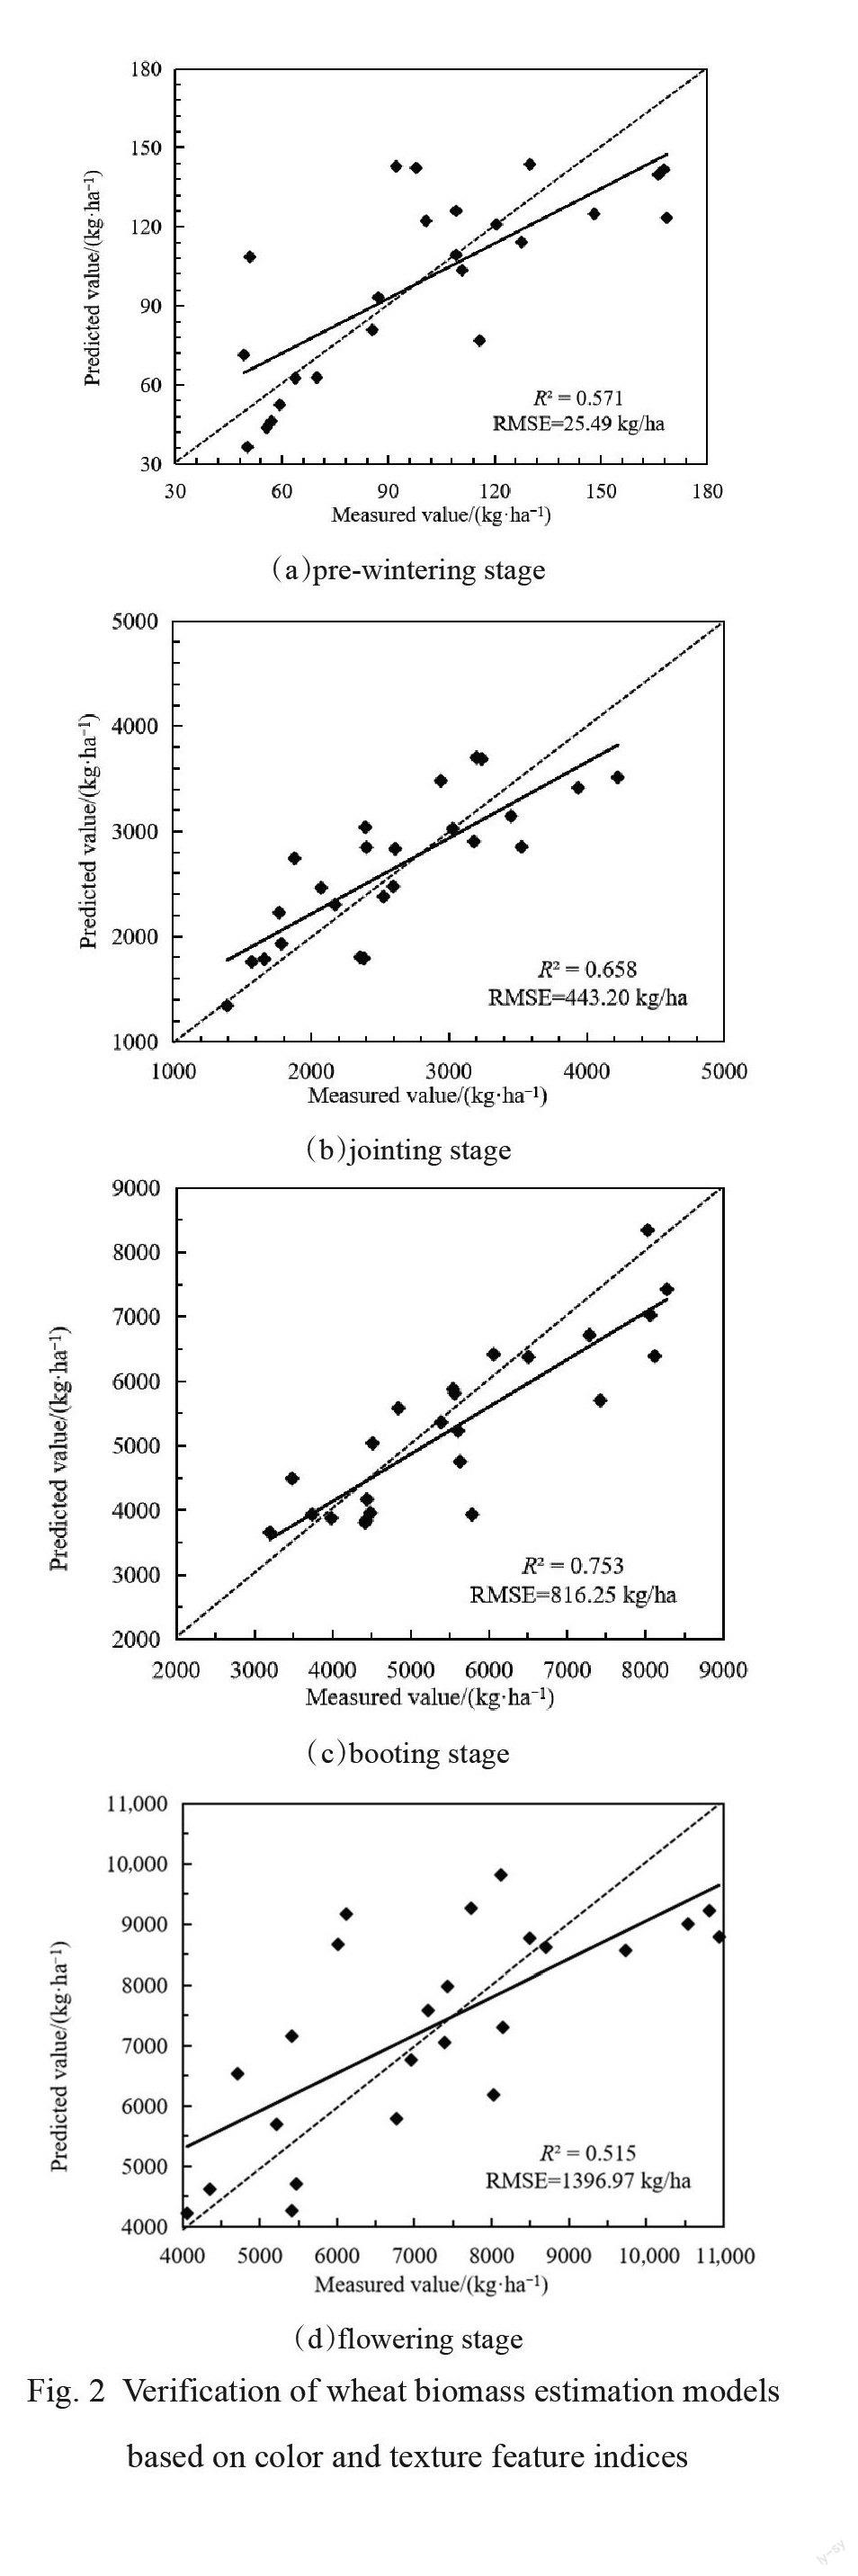
(1) Validation of the wheat biomass estimation model in the pre-wintering period
The independently measured data were used to validate the wheat biomass estimation model in the pre-wintering period, and the 1:1 relationship be‐ tween the measured values and the model predic‐tions was plotted (Figure 2(a)). There was good agreement between the predicted value of wheat biomass and the measured value in the pre-winter‐ing period. The predicted R2 of the model was 0.571, which was better than the single color index model (6.13% increase). Correlation analysis showed that the correlation between the predicted value and the measured value was significant, indi‐cating that the estimation model is feasible. In addi‐tion, the simulated RMSE was 25.49 kg/ha, whichwas smaller than the RMSE of the single color in ‐dex model (reduced by 8.57%), indicating that thereliability of the model had been further improved.
(2) Validation of the wheat biomass estimationmodel in the jointing period
The validation results of the jointing estima‐tion model are shown in Fig.2(b). It can be seenthat the predicted value of wheat biomass in thejointing period was close to the measured value,and there was a good agreement between the two.The predicted R2 of the model was 0.658, which isbetter than the pre-wintering period, and the predic‐tion accuracy was improved compared to the singlecolor index model (4.28% increase). Correlationanalysis indicated that there was a correlation be‐tween the predicted value and the measured value,indicating that the estimation model is feasible. Thesimulated RMSE was 443.20 kg/ha, which was sig ‐nificantly smaller than the RMSE of the single col‐or index model (14.27% decrease), indicating thatthe reliability of the model had been greatly im‐proved.
(3) Validation of the wheat biomass estimationmodel in the booting period
The validation results of the booting period es‐timation model are shown in Fig.2(c). The predict‐ed value of wheat biomass in the booting periodwas close to the measured value, and there was highconsistency between the two. The model predictedan R2 of 0.753, which was better than the jointingperiod, and the prediction accuracy was greatly im‐proved compared to the single color index model(6.36% increase). Correlation analysis indicatedthat the correlation between the predicted value andthe measured value was significant, indicating thatthe estimation model is feasible. In addition, thesimulated RMSE was 816.25 kg/ha, which wassmaller than the RMSE of the single color indexmodel (5.99% decrease), indicating that the reliabili‐ ty of the model had been improved.
(4) Validation of the wheat biomass estimation model in the flowering period
The validation results of the flowering period estimation model are shown in Fig.2(d). The pre‐dicted value of wheat biomass in the booting period was close to the measured value, and there was a high agreement between the two. The predicted R2 of the model was 0.515, and the prediction accuracy was improved compared to the single color index model (10.99% increase). Correlation analysis indi‐cated that the correlation between the predicted val‐ue and the measured value was significant, indicat‐ing that the estimation model is feasible. In addi‐tion, the simulated RMSE was 1396.97 kg/ha, which was smaller than the RMSE of the single col‐ or index model (reduced by 9.28%), indicating that the reliability of the model had been improved.
Based on the above results, the biomass estima‐tion model of wheat in different growth periods based on the combination of UAV image color and texture feature indices was significantly improved over the single color index model and can be used to estimate the biomass of wheat in different growth periods.
4 Discussion
At present, few studies have monitored growth indices such as wheat biomass using the RGB im‐ age data of UAVs. Hunt et al.[26] obtained wheat can ‐opy images using UAVs and used the vegetation in ‐ dices NDVI and GNDVI to monitor wheat growth in order to validate the availability of UAV images in wheat growth monitoring. In this study, the RGB images collected in the four key growth periods of wheat were systematically analyzed. The image in ‐ formation was extracted, and eight common colorindices and four texture feature indices were calcu‐lated. The best performing color index and texture feature index were selected using correlation analy‐ sis. The results showed that the biomass estimation model constructed using a single color index could reduce the estimation accuracy due to the saturation of the image in the late growth period of wheat. In order to solve the above problems, the UAV image color and texture feature indices were combined to establish a multivariate model of wheat biomass es‐timation based on two types of indices, and the model was tested using independently measured biomass data, achieving an overall better perfor‐mance than a single color index model.
Other studies have combined image color indi‐ces with other indices to estimate crop yield or bio ‐ mass. For example, Lu et al.[27] used UAV image da‐ ta and point cloud data to estimate the aboveground biomass of wheat. Compared to the use of single color data, the model with combined indices im‐ proved the estimation accuracy, R2 was 0.78, RMSE was 1.34 t/ha and rRMSE was 28.98%. Duan et al.[28] established a new method combining the vegetation indices based on UAV images and the abundance in ‐ formation obtained from spectral mixture analysis (SMA). The results showed that the vegetation in ‐dex with abundance information exhibited better predictive ability for rice yield than the vegetation index alone with the coefficient of determination reaching 0.6 and estimation error below 10%. Zhou et al.[29] established wheat yield prediction model by using color and texture feature indices of RGB im‐ ages at wheat booting and flowering stages, and the R2 of the model increased by 2.15% and 3.69% com ‐ pared with the single-color index model, respective‐ly. The above results demonstrate that combining the color indices of UAV images with different indi‐ces, such as shape, texture, and coverage can im‐prove the estimation effect of the model.
In addition, previous studies often only moni‐tored the biomass in a certain growth period of thecrop due to image availability or other constraints,and thus the results are difficult to extrapolate. Inthis study, UAV images of the four key growth peri‐ods of wheat were analyzed, and the dynamic moni‐toring model of wheat biomass based on the UAVplatform was established. The model was tested us‐ing independently measured data, and the resultswere all reliable, indicating that it is feasible to dy‐namically monitor wheat biomass using a UAV plat‐form equipped with a digital camera, which is suit‐able for small and medium area applications. How ‐ever, in the future, UAVs will be equipped withmore types of cameras. Therefore, in future re‐search, information such as the spectrum, color, andtexture of the image could be comprehensively usedto improve the monitoring accuracy and range.
5 Conclusions
In this study, estimation models of wheat bio ‐mass at main growth stages were constructed basedon the color and texture index of UAV images.
Firstly, the color index and texture feature in ‐dex optimally correlated with wheat biomass wereidentified. Among the eight color indices, most ofthe correlations with wheat biomass were signifi‐cant, and the correlation of VARI in the pre-winter‐ing period was the highest at r=0.743**. The corre‐lation of ExGR in the jointing period was the high ‐est at r=0.911**. The correlation of MGRVI in thebooting period was hight at r=0.817**, and the cor‐relation of VARI in the flowering period was hightat r=0.679**. The correlation between the four im‐age texture feature indices and wheat biomass waspoor, and only a few indices reached significant cor‐relation levels.
Then, using the color indices of VARI, ExGR, MGRVI and VARI, the biomass estimation models of wheat in the pre-wintering, jointing, booting, and flowering periods were constructed, and the wheat biomass estimation multivariate models were con ‐ structed by combining the texture feature indices that with the highest correlation with wheat bio ‐ mass.
Finally, the models were validated using inde‐pendently measured biomass data. The results showed that both two types of estimation models passed the significance test, with the correlation reaching a significant level and the RMSE being small. The wheat biomass estimation model com ‐bined with the UAV image color and texture feature indices was better than the single color index model.
References:
[1] WANG E. Study on remote sensing monitoring ofmaize growth and biomass[D]. Hefei: Anhui Agricul‐tural University, 2018.
[2] FAN Y, GONG Z, ZHAO W, et al. Study on vegetationbiomass inversion method based on hyperspectral re‐ mote sensing[J]. Journal of Hebei Normal University (Natural Science Edition), 2016, 3:267-271.
[3] JIMENEZ-SIERRA D, CORREA E, BEN?TEZ-RE ‐STREPO H, et al. Novel feature-extraction methods for the estimation of above-ground biomass in rice crops[J]. Sensors, 2021, 21(13):1-14.
[4] HOU X, NIU Z, HUANG N, et al. The hyperspectralremote sensing estimation models of total biomass and true LAI of wheat[J]. Remote Sensing for Land & Re‐ sources, 2012, 24(4):30-35.
[5] LIU Q, PENG D, TU Y, et al. Estimating forest bio‐mass by partial least squares regression[J]. Journal of Northeast Forestry University, 2014, 7:44-47.
[6] YUE J, ZHOU C, GUO W, et al. Estimation of winter-wheat above-ground biomass using the wavelet analy‐ sis of unmanned aerial vehicle-based digital images and hyperspectral crop canopy images[J]. International Journal of Remote Sensing, 2021, 42(5):1602-1622.
[7] LI J, SHI Y, VEERANAMPALAYAM-SIVAKUMARA N, et al. Elucidating sorghum biomass, nitrogen and chlorophyll contents with spectral and morphological traits derived from unmanned aircraft system[J]. Fron‐tiers in Plant Science, 2018, 9:1-12.
[8] GU Z, JU W, LI L, et al. Using vegetation indices andtexture measures to estimate vegetation fractional cov‐erage (VFC) of planted and natural forests in Nanjingcity, China[J]. Advances in Space Research, 2013, 51(7):1186-1194.
[9] SARKER L R, NICHOL J E. Improved forest biomassestimates using ALOS AVNIR-2 texture indices[J]. Re‐mote Sensing of Environment, 2011, 115(4):968-977.
[10] CAO Q, XU D, JU H. The biomass estimation of man‐grove community based on the textural features andspectral information of TM images[J]. Forest Resourc‐es Management, 2010, 6:102-108.
[11] MU Q, GAO Z, BAO Y, et al. Estimation of sparsevegetation biomass based on grey-level co-occurrencematrix of vegetation indices[J]. Remote Sensing Infor‐mation, 2016, 1:58-63.
[12] LIU C, YANG G, LI Z, et al. Biomass estimation inwinter wheat by UAV spectral information and textureinformation fusion[J]. Scientia Agricultura Sinica,2018, 51(16):3060-3073.
[13] LEE K J, LEE B W. Estimation of rice growth and ni‐trogen nutrition status using color digital camera imageanalysis[J]. European Journal of Agronomy, 2013, 48(3), 57-65.
[14] WANG Y, WANG D, ZHANG G, et al. Estimating ni‐trogen status of rice using the image segmentation ofG-R thresholding method[J]. Field Crops Research,2013, 149(149):33-39.
[15] WANG J, ZHOU Q, SHANG J, et al. UAV- and ma‐chine learning-based retrieval of wheat SPAD values atthe overwintering stage for variety screening[J]. Re‐mote sensing, 2021, 13:1-19.
[16] YUE J, FENG H, LI Z, et al. Mapping winter-wheatbiomass and grain yield based on a crop model andUAV remote sensing[J]. International Journal of Re‐mote Sensing, 2021, 42(5):1577-1601.
[17] SHAN C, LIAO S, GONG Y, et al. Application of digi‐tal image processing for determination of vertical dis‐tribution of biomass in the canopy of winter wheat[J].Acta AgronomicaSinica, 2007, 33(3):419-424.
[18] CHEN W. Evsluation of seed emergence unifermity ofwheat based on UAV image[D]. Yangzhou: YangzhouUnivefrsity, 2018.
[19] GITELSON A A, STARK R, GRITS U, et al. Vegeta‐tion and soil lines in visible spectral space: A conceptand technique for remote estimation of vegetation frac‐tion[J]. International Journal of Remote Sensing, 2002,23(13):2537-2562.
[20] MAO D, WU X, DEPPONG C, et al. Negligible roleof antibodies and C5 in pregnancy loss associated ex‐clusively with C3-dependent mechanisms through com ‐plement alternative pathway[J]. Immunity, 2003, 19(6):813-822.
[21] WOEBBECKE D M, MEYER G E, VON BARGENK, et al. Plant species identification, size, and enumera‐tion using machine vision techniques on near-binary images[J]. Proceedings of SPIE-The International Soci‐ety for Optical Engineering, 1993, 1836:1-12.
[22] HUNT JR E R, DAUGHTRY C S T, EITEL J U H, etal. Remote sensing leaf chlorophyll content using a vis‐ible band index[J]. Agronomy Journal, 2011, 103(4):1090-1099.
[23] TUCKER P W, HAZEN E E, COTTON F A. Staphylo‐coccal nuclease reviewed: A prototypic study in con‐ temporary enzymology[J]. Molecular & Cellular Bio‐ chemistry, 1979, 23(2):67-86.
[24] BENDIG J, YU K, AASEN H, et al. Combining UAV-based plant height from crop surface models, visible, and near infrared vegetation indices for biomass moni‐toring in barley[J]. International Journal of Applied Earth Observation & Geoinformation, 2015, 39:79-87.
[25] HARALICK R M, SHANMUGAM K, DINSTEIN I.Textural features for image classification[J]. IEEETransactions on Systems Man & Cybernetics, 1973, 3(6):610-621.
[26] HUNT JR E R , HIVELY W D, FUJIKAWA S, et al.Acquisition of NIR-Green-Blue digital photographsfrom unmanned aircraft for crop monitoring[J]. Re‐mote Sensing, 2010, 2(1):290-305.
[27] LU N, ZHOU J, HAN Z, et al. Improved estimationofaboveground biomass in wheat from RGB imageryand point cloud data acquired withalow?cost unmannedaerial vehicle system[J]. Plant Methods, 2019, 15:1-16.
[28] DUAN B, FANG S, ZHU R, et al. Remote estimationof rice yield with unmanned aerial vehicle (UAV) dataand spectral mixture analysis[J]. Frontiers in Plant Sci‐ence, 2019, 10:1-14.
[29] ZHOU Y, WANG D, CHEN C, et al. Prediction ofwheat yield based on color index and texture feature in‐dex of UAV RGB image[J]. Journal of Yangzhou Uni‐versity (Agricultural and Life Science Edition), 2021,42(3):110-116.