Genome-wide identification of the aquaporin gene family in wheat and their roles in salt and drought stress response
2021-11-12MADongfangHUYifengNIUHongliZENGFansong
MA Dongfang, HU Yifeng, NIU Hongli, ZENG Fansong
1.Engineering Research Center of Ecology and Agricultural Use of Wetland, Ministry of Education; Hubei Collaborative Innovation Center for Grain Industry, Yangtze University, Jingzhou 434025, Hubei 2.Key Laboratory of Integrated Pest Management on Crop in Central China, Ministry of Agriculture; Hubei Province Key Laboratory for Control of Crop Diseases, Pest and Weeds; Institute of Plant Protection and Soil Science, Hubei Academy of AgriculturalSciences, Wuhan 430064, Hubei
[Abstract]Aquaporins (AQPs) function in selectively controlling the flow of water and other small molecules through cell membranes.They are essential for many physiological processes in plants, including the abiotic stress response.Wheat (Triticum aestivum L.) is one of the most important food crops globally, but the effects of drought and salt stress on the growth and yield are significant constraints. 127 non-redundant wheat aquaporin genes(s) and 4 alternative splicing variants were identified. RNA-seq analysis of TaAQP genes reveals specific expression patterns of wheat AQP genes. Specifically, TaTIPs and TaPIPs are more highly expressed than TaNIPs and TaSIPs. qRT-PCR analysis shows that when wheat is subjected to drought and salt stress, several AQPs, including TaNIP4; 03_3D, TaTIP2; 02b_7B, TaSIP2; 02_4A, TaNIP3; 03_6D and TaNIP2; 04a_7D, are significantlyinduced and have high expression, suggesting that they participate in stress response. These results provide new ideas for further exploring the role of TaAQPs genes in plant response to drought stress and salt stress.
[Key words]abiotic stress; AQP; drought stress; gene expression; salt stress; Triticum aestivum
1 Introduction
Aquaporins (AQPs) are a superfamily of intrinsic proteins (MIPs) that selectively promote the diffusion of water and small molecules, including carbon dioxide, hydrogen peroxide and glycerol through biofilms. They also adjust the two-way motion of water in response to the osmotic gradients[1,2]. Based on sequence similarity and subcellular localization, the aquaporin protein family is divided into 5 subfamilies: plasma intrinsic proteins (PIPs), tonoplast intrinsic proteins (TIPs), nodulin26-like intrinsic proteins (NIPs), small basic intrinsic proteins (SIPs) and X (or unrecognized) intrinsic proteins (XIPs)[3-5]. XIPs persist in some higher plants, having been lost in the Brassicaceae, monocots and possibly the gymnosperms, but are diversified in the Malpighiales. GlpF-like intrinsic proteins (GIPs) and heterozygous endogenous proteins (HIPs) have been reported in non-vascular mosses[6,7]. Moreover, different subfamilies of AQP proteins show significant diversity in protein localization. For example, PIPs, XIPs, SIPs and some NIPs are generally localized to the plasma membrane[8-10], whereas TIPs are mostly localized to tonoplasts[11]. NIPs also localize to the membrane of the endoplasmic reticulum(ER).
Although plant AQPs from different subfamilies differ in primary sequence, evolutionary distance, and subcellular localization, plant AQPs have highly conserved structures[12,13]. Plant AQPs generally contain six transmembrane (TM) domains (TM 1-6) connected by five short intervening loops (Loops A-E), with the N- and C-termini located in the cytosol[6]. The six TM domains together with two additional hemi-helices (loops B, LB and loops E, LE) form an alpha-helical bundle that produce the membrane spanning pore[14,15]. Most AQPs have two highly conserved Asn- Pro-Ala (NPA) motifs located in the pore region of the channel, which play a major role in their transport function[16,17]. And an aromatic/arginine (ar/R) filter consisting of four extraunit residues located approximately 8Å from the NPA region including helix 2 (H2), helix 5 (H5), and ring E (LE1 and LE2), LB and LE are embedded in the membrane in opposite directions and are gathered together at the center of the membrane[18].The ar/R selectivity filter is a size exclusion barrier to regulate the rate and specificity of protein transport[19,20], and to provide key hydrogen bonds and van der Waals contacts for the transported solutes and water molecules[20].
AQPs are reported to be involved in many plant physiological processes. It has been suggested that abiotic stresses, such as drought, salt and cold, lead to transcriptional accumulation of AQPs[21,22]. For example, when common bean (Phaseolusvulgaris) cultivars Pinto Villa (tolerant) and Carioca (susceptible) were subjected to drought stress, and mRNA levels of 18 AQPs in Carioca declined to undetectable levels whereas the levels persisted in Pinto Villa. It was suggested that the higher expression level allowed Pinto Villa to maintain vascular function under drought stress[23]. Aroca et al. (2006) cloned threePIPsfromP.vulgarisand found that drought stress increased their expression levels[24].NtAQP1 overexpression in salt-stressed tobacco led to increased net photosynthesis in leaves,mesophyll CO2and stomatal conductance, whereasNtAQP1 silencing caused reduced root hydraulic conductivity[25]. Moreover, overexpression ofJcPIP2;7 andJcTIP1;3 fromJatrophacurcasinArabidopsisresulted in improved germination in high salt and mannitol treatment conditions compared to seeds of the respective controls[26]. These studies suggested that AQPs play important roles in response to abiotic stress.
Wheat is one of the most important staple food crops globally, feeding over 35% of the world population[27]. Wheat production is significantly challenged by soil salinity and drought[27]. Several wheatAQPs(TaAQPs) were identified and their functions were examined under salt and drought conditions. For example, Forrest and Bhave showed that many PIP and TIP aquaporins in wheat showed differential expression when subjected to salinity and/or drought treatments[28]. Wheat genesTaAQP7 andTaAQP8 were significantly induced by drought and salt treatments and overexpression ofTaAQP7 andTaAQP8 in tobacco enhanced resistance to drought and salt stresses[29,30].TaTIP2 regulated the response of plants to salt and drought stress independently of the abscisic acid (ABA) pathway[31].
Since AQPs play a crucial role in plant growth, development, and stress response this gene family was selected for genome-wide analysis in wheat. Genome identification and functional analysis ofTaAQPsbecame possible with completion of wheat genome sequence. However, the role of manyTaAQPsin response to abiotic stresses (e.g. salt and drought) was unknown. The Blastp program was performed through the wheat database (IWGSC RefSeq v1.1, International Wheat Genome Sequencing Consortium website, https://wheat urgi.versailles.inra.fr/Seq-Repository/Assemblies), and the cutoff value was used to ensure the reliability of the protein sequences. Finally, 127AQPgenes were identified from the wheat database IWGSC v1.1. Structural characteristics, chromosomal distribution, subcellular localization, exon-intron organization, conserved motifs and expression patterns were determined. The identification ofAQPsin wheat and exploration their stress responsive patterns could provide information allowing genetic improvement of wheat and a basis for engineering strategies to improve stress tolerance.
2 Materials and methods
2.1 Identification of AQP genes in the wheat genome
A computer-based approach was used to identify members of the AQP gene family (v1.1, https://wheat-urgi.versailles.inra.fr/Seq-Repository/Assemblies) from the IWGSC RefSeq assembly. Members of the AQP family, including those fromArabidopsisthaliana(http://www.arabidopsis.org/index.jsp)[32],Oryzasativa(http://rice.plantbiology.msu.edu/index.shtml)[33]andZeamaysL. (https://www.maizegdb.org/)[34]were downloaded and used as query sequences for BLASTp analysis. Since XIPs were not detected inArabidopsis, rice, or maize, XIPs identified fromCitrussinensis[35],Phaseolusvulgaris[36],Ricinuscommunis[37]andHeveabrasiliensis[38]were used as query sequences. Successive iterations of the hidden Markov model (HMM) of the Pfam domain, PF00230 (MIP, Major intrinsic protein), were downloaded from HMMER 3.0 as query sequences and the two query sequences obtained were integrated in a search of the wheat IWGSC v1.1 database using BLASTp (Basic Local Alignment Search Tool protein), with a cutoff value (E-value <10-10) set to ensure the reliability of the protein sequence. The combined results were imported into Pfam (v32.0, http://pfam.xfam.org/) and InterProScan (v71.0, http://www.ebi.ac.uk/InterProScan) to eliminate protein sequences that did not belong to MIP.
2.2 Sequence analysis of AQP proteins/genes
The physicochemical characteristics of the AQP proteins, including protein length, molecular weight (MW), isoelectric point (pI), and grand average of hydropathy (GRAVY) values[39], were calculated using the ProtParam tool (web.expasy.org/protparam/). The membrane protein topologies of the AQPs was predicted using TOPCONS (topcons.net/) and their subcellular localization were predicted using the WoLF PSORT tool (https://wolfpsort.hgc.jp/). Phylogenetic relationships were inferred using the maximum likelihood (ML) method, based on the LG model[40]in MEGA6.0. The midpoint rooted base tree was drawn using the Interactive Tree of Life (IToL.V3.2.317.) program. The protein sequences of AQP proteins were scanned for conserved motifs using the MEME suite analysis tool V4.9.1 and the MAST motif search tool (http://meme-suite.org/tools/meme)[41]with the following parameters: each sequence can contain any number of non-overlapping occurrences of each motif; number of different motifs set as 10; and range of motif widths, 6~50 amino acids. The functions of predicted motifs were analyzed using InterPro and drawn using TBtools software (https://github.com/CJ-Chen/TBtools). Genomic annotations ofTaAQPswere extracted from genomic reference GFF files. According to the annotation information ofTaAQPgenes in wheat genome, the gene structures were analyzed using GSDS2.0 (http://gsds.cbi.pku.edu.cn/index.php)[42]. Gene annotations of the AQP proteins were extracted from the genome reference GFF files. MapInspect software was used to draw the physical chromosome maps of start and end position information ofAQPs[43,44].
2.3 Gene synteny analysis
The genome sequences of diploid ancestral species,Triticumurartu,AegilopstauschiiandT.dicoccoideswere downloaded from the EnsemblPlants website (http://plants.ensembl.org/index.html).AQPgenes (E-value<10-10) in the ancestral species were identified by mutual BLASTp analysis. DuplicatedAQPgenes were then identified by BLASTn using the coding sequences (CDS). The criteria used to determine duplicates were: (a) coverage of >80% sequence length, and (b) >90% identity of thealigned region[45].
2.4 Expression profiles of TaAQP genes
Raw RNA-seq data from transcriptomic analyses under multiple conditions were downloaded from the NCBI Short Read Archive (SRA) database and mapped to the wheat reference genome using Hisat2. The genes were then assembled using Cufflinks to determineTaAQPexpression levels that were normalized by fragments per kilobase of exon per million fragments mapped (FPKM models)[46]. The pheatmap package was used to generate a heat map ofTaAQPsshowing varied responses of different genes under different conditions.
2.5 Wheat stress treatment and qRT-PCR
Seeds of the wheat cultivar Emai 170 were surface sterilized with 1% hydrogen peroxide, thoroughly rinsed with distilled water, and germinated for 2 days at 20℃ in a 16h/8h (day/night) incubator. Seedlings were transferred and grown in 1/4 strength continuously aerated Hoagland’s nutrient solution. Three days later, the strength of the Hoagland’s solution was increased to 1/2. After three days, stress treatment was initiated by adding sodium chloride (NaCl, 0.15mol/L), mannitol (0.18mol/L) and PEG (20%) to the nutrient solution. Because expression of someAQPsis under circadian regulation, this research began at 9:00 AM, with sampling after 2, 4, 8, 12, 24h and 72h of treatment. Total RNA was isolated from leaf and root tissues using TRIzolTM reagent (Invitrogen, Carlsbad, CA, USA), and the samples were treated with DNAseI to remove DNA. RNA was reverse transcribed into cDNA using an RT-PCR system (Promega, Madison, WI, USA). Quantification of gene transcription levels was performed using a real-time PCR system (BIO-RAD, U.S.A.). The total volume of the qRT-PCR system was 20μL, containing 10μL of LSEPBR®PremixExTaq (2×), 1μL of each primer (10μmol/L), 2μL of template (about 100ng/μL), and 6μL of ddH2O. The protocol was as follows: pre-denaturation at 95℃ for 30s (step 1), denaturation at 95℃ for 5s (step 2), primer annealing/extension, and collection of fluorescence signal at 60℃ for 20s (step 3), the next 40 loops start at step 2. Three technical replicates were performed for each cDNA, and the house keeping gene wasTa2291[47].
3 Results
3.1 Identification and classification of AQP genes in wheat
The 94 known AQP proteins fromArabidopsis(37)[32], rice (37)[33]and maize (20)[17], and 17 XIPs fromCitrussinensis[35],Phaseolusvulgaris[36],Ricinuscommunis[37]andHeveabrasiliensis[38]. Wheat protein sequences searched using the known AQP proteins as seed sequences were identified with BLASTp. A total of 145AQPgenes were found in the wheat database. After sequence homology analysis and protein domain validation using Pfam one gene (TraesCS4B02G178000.2) lacking MIP protein domains was excluded from further sequence analysis. GenesTaPIP1;01b_2D,TaNIP1;15_3D,TaPIP2;40_4BandTaTIP5;03_2Ddid not have six transmembrane domains;TaNIP1;05c_3AandTaSIP2;03_4Deach had one deletion in two NPA motifs;TaPIP1;17_6B,TaPIP1;02b_2A,TaPIP2;26b_2D,TaTIP4;08_3A,TaNIP1;06b_7B,TaTIP2;03c_7DandTaTIP5;02_2Bhad uncertainties in the transmembrane domains and NPA motifs. These genes were identified as “pseudo-genes” (listed in Table 1) and excluded them from subsequent analysis. Therefore, a total of 121 non-redundant full-length, protein-codingAQPgenes were identified, and four alternatively spliced variants were deleted, for a total of 131TaAQPs. TheTaAQPgenes were renamed according to the format:
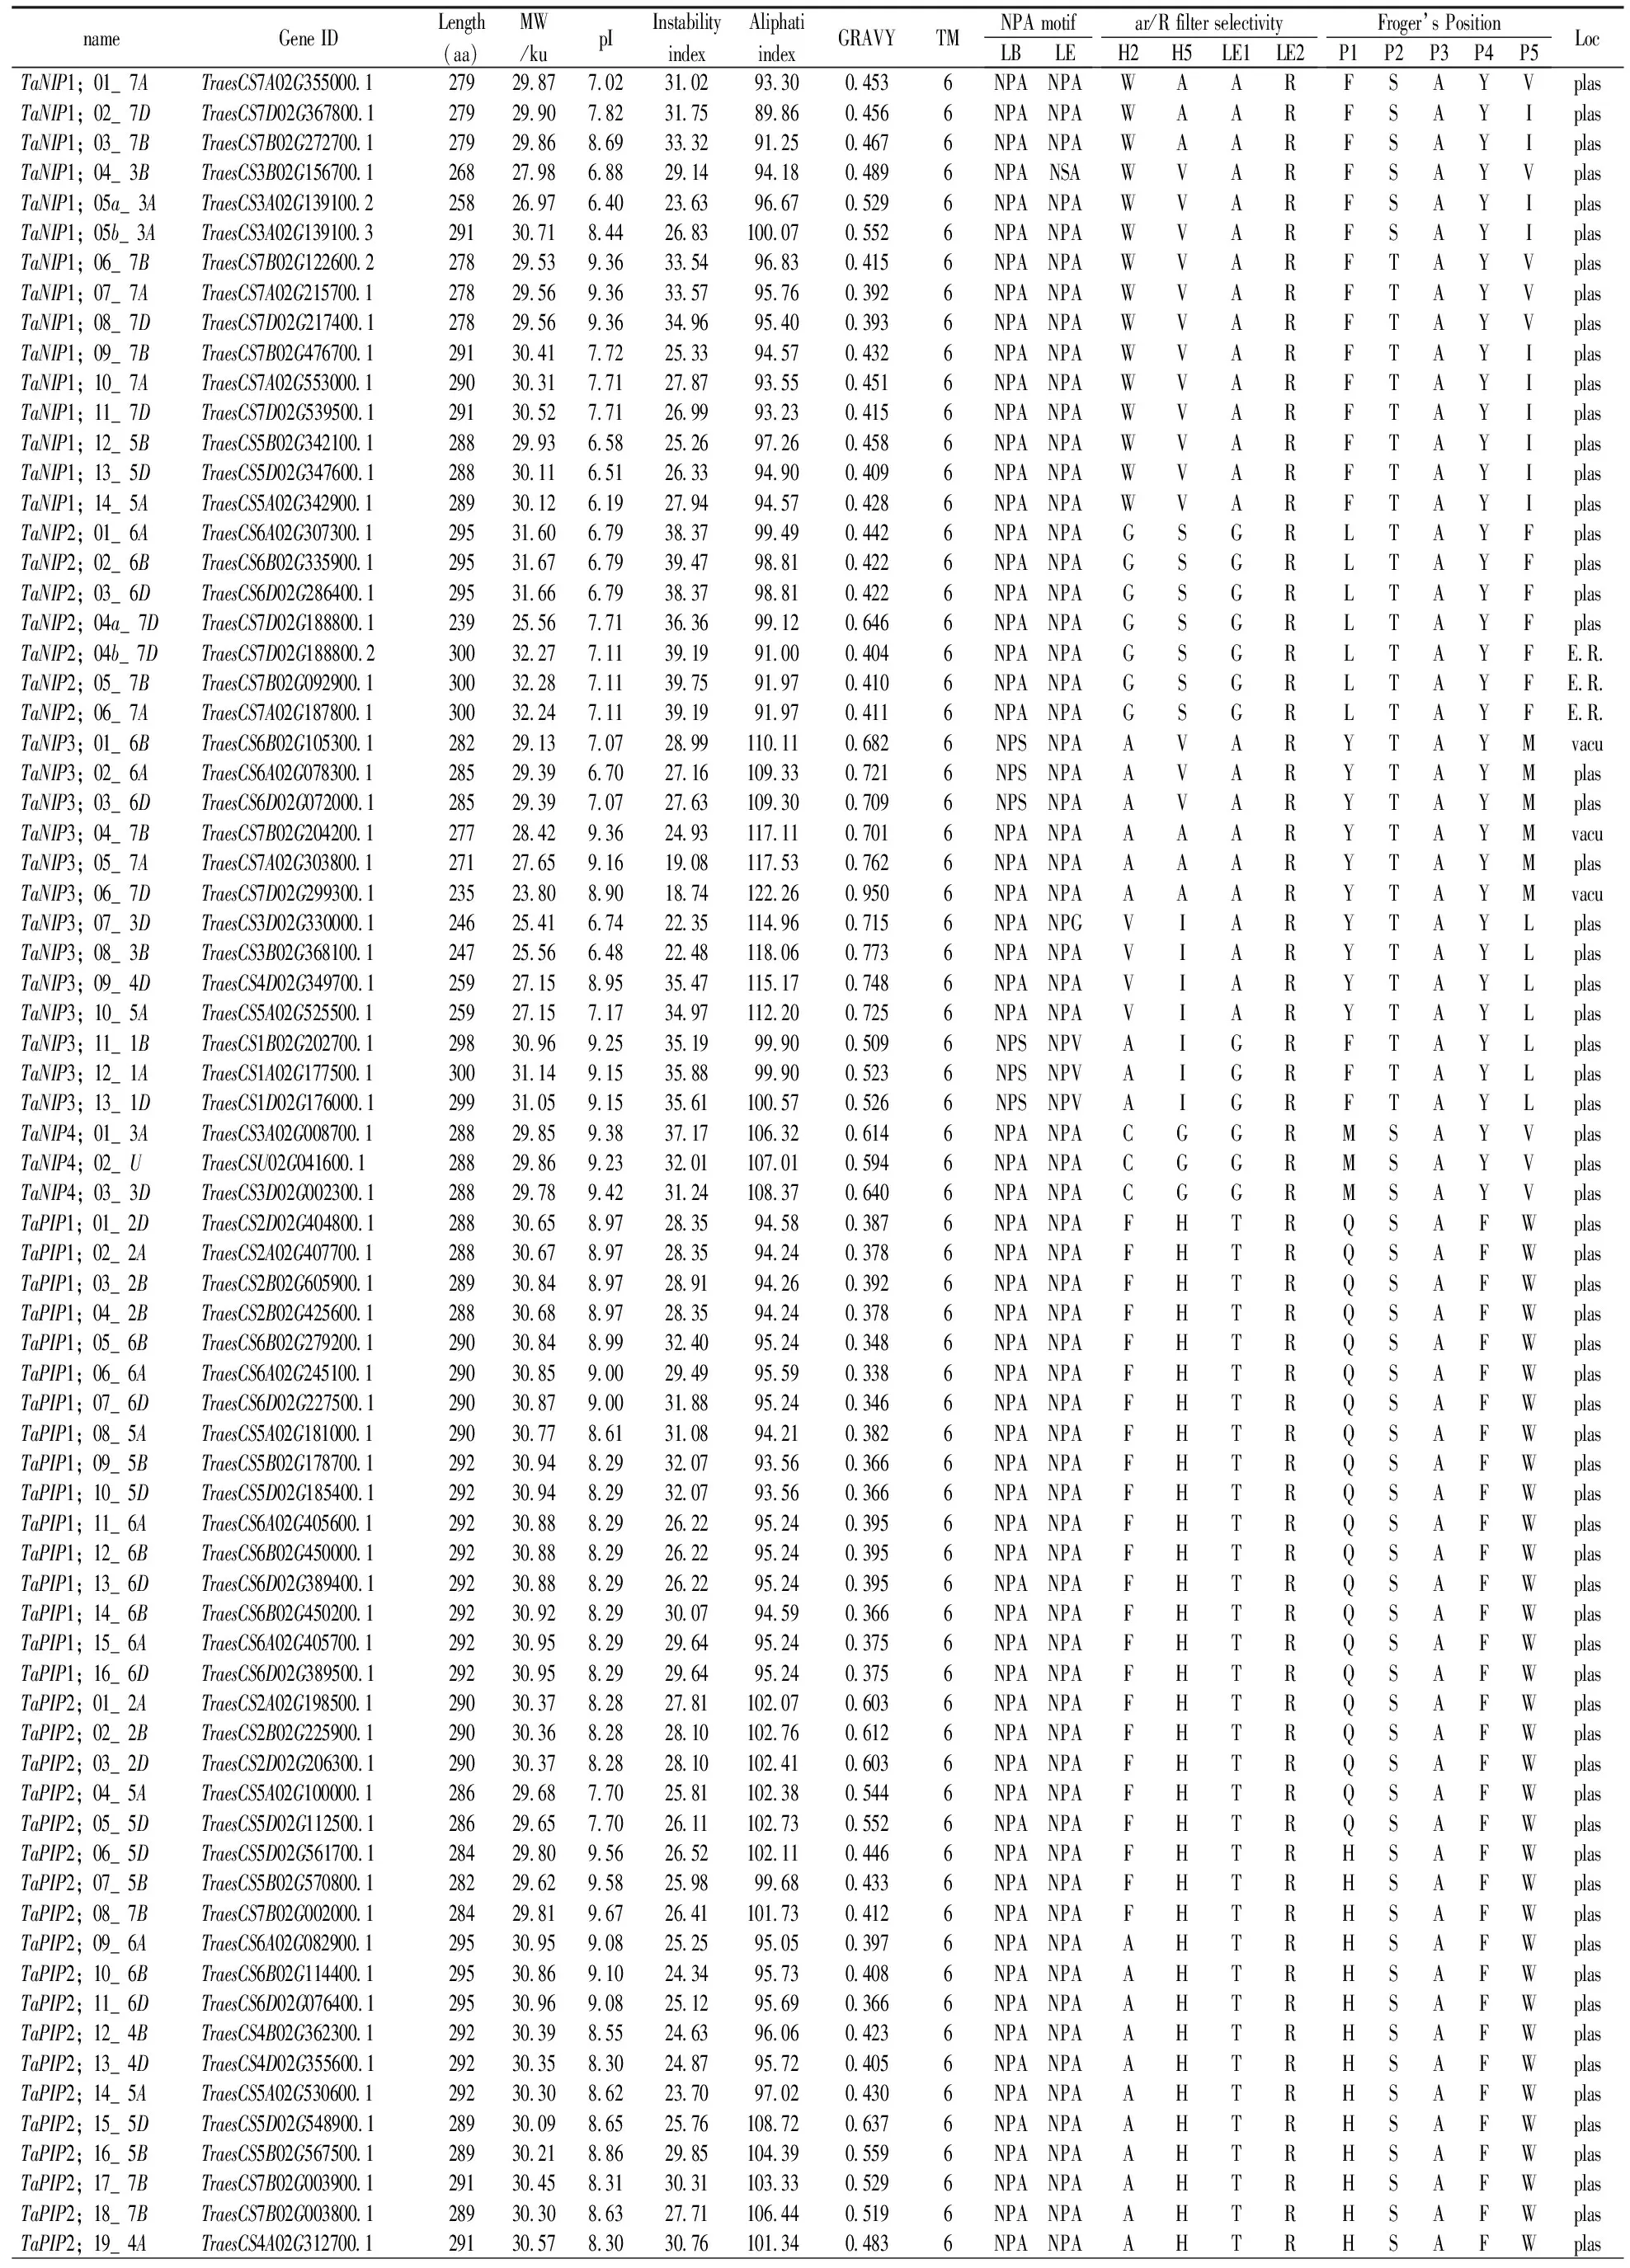
Table 1 Prediction of sequence features of aquaporin proteins

(Continued Table 1)
Notes:Length,Protein length (aa);MW,Protein molecular weight (ku);pI, isoelectric point;GRAVY,Grand average of hydrophobicity;TM,represents for the numbers of Transmembrane helices predicted by TMHMM Server v.2.0 tool;Loc,Best possible cell localization prediction by the WoLF PSORT tool (E.R., Endoplasmic reticulum. Plas, plasma membrane; Vacu, vacuolar membrane).LB, Loop B; LE, Loop E;NPA, Asparagine-Proline-Alanine.H2 represents for Helix 2,H5 represents for Helix 5,LE1 represents for Loop E1,LE2 represents for Loop E2,ar/R represents for Aromatic/Arginine.*“pseudo-gene”and excluded them from subsequent analysis.
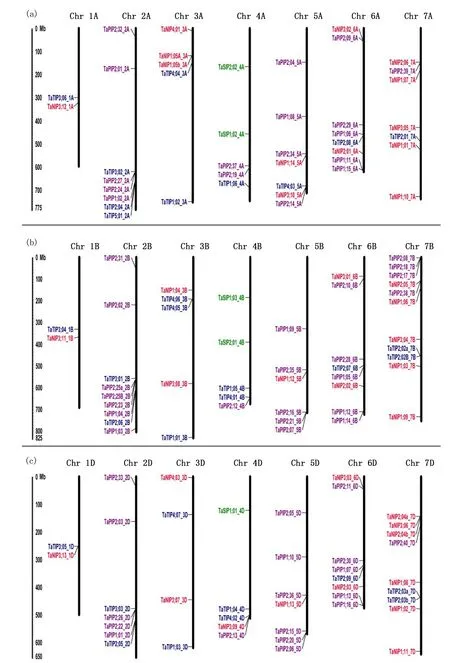
Notes:Position determined in mp. Different classes of aquaporins are represented in different colors. Red, TaNIP; blue, TaTIP; purple, TaPIP; green, TaSIP. Fig.2 Chromosomal localization of the 131 aquaporin genes in the wheat genome图2 小麦基因组中131个水通道蛋白基因的染色体定位
3.2 Features of AQP proteins
Analyses of protein sequences showed that the minimum length of the 131 TaAQPs was 128 amino acids (aa) and the largest was 314 aa. The sizes were estimated to range from 13.51 to 33.74ku, andisoelectric points (pI) ranged from 5.32 to 9.91 (Table 1). The instability index ranged from 18.74 to 47.96, indicating that the majority of wheat AQP were relatively stable, with some exceptions such as TaTIP3;05_1D. GRAVY values that reflect the degree of hydrophobicity or hydrophilicity were positive, ranging from 0.113 to 0.950, and indicating that TaAQPs were hydrophobins (Table 1).
Subcellular localization predictions indicated that all TaPIPs were localized on the plasma membrane (Table 1). TaTIPs, TaNIPs and TaSIPs showed a broad range of subcellular localizations, including the vacuoles, endoplasmic reticulum and plasma membrane (Table 1). Further studies of expression, localization and substrate specificity of TaAQPs are required.
3.3 Motif composition and gene structure
Protein motifs are highly conserved amino acid residues that may have functional and/or structural effects in active proteins[48]. MEME and InterPro Scan 5 were used to detect and annotate motif distributions of TaAQP proteins. Ten conserved motifs were detected (motifs 1 to 10) (Fig.3(a)) and most TaAQP proteins of the same subfamily had similar motifs. Among them, motifs 1, 5 and 7 were present in all TaAQPs. The protein sequences of PIP and TIP subfamily members were highly similar. Different subfamilies contained several specific motifs. For example, motifs 2, 3 and 10 were found only in the TaPIP subfamily. The variably cleaved TaAQP sequences were highly similar, with only the first or last 2 or 3 motifs missing or mutated.
Exon-intron structural diversity often provides additional evidence to support phylogenetic grouping and plays a key role in the evolution of gene families[49]. To further understand the gene structure ofTaAQPs, the intron and exon structures ofTaAQPswere analyzed. The number of introns ranged from 0 to 4; besides 64 members had two introns, 41 members had 3 introns and 23 members had either 1 or 4 introns, while 16 members had no intron (Fig.3(b)). Four introns were present only inTaNIPs. In general, wheatAQPsdisplayed complex gene structures with different intron positions and lengths (Fig.3(b)).
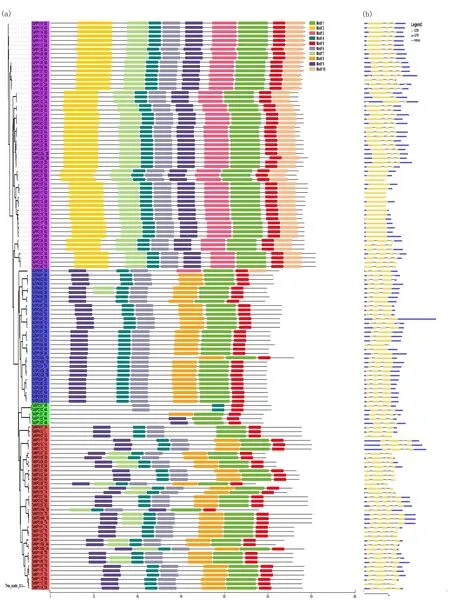
Notes:The tree was created with bootstrap of 1000 by maximum likelihood (ML) method in MEGA6. Model exhibition of motifs composition in aquaporin amino acid sequences using MAST. Fig.3 Analysis of conserved motifs and gene structure of TaAQPs图3 TaAQPs的保守基序和基因结构分析
3.4 Sequence analysis of TaAQP proteins
In general, two highly conserved Asn-Pro-Ala (NPA) motifs generate electrostatic repulsion of protons and form water pores, and ar/R selectivity filters are essential for the selective transport of substrate molecules[50]. Point mutations in NPA positions strongly influence the substrate specificity of AQPs[20]. To understand the possible physiological roles and substrate specificities of wheat AQPs, the NPA motifs, ar/R selectivity filters (H2, H5, LE1 and LE2) and residues at the Froger position (P1 to P5) of TaAQPs were identified and analyzed (Table 1).
3.4.1 Asn-Pro-Ala (NPA) motifs
As shown in Table 1, most TaPIPs and all TaTIPs contained two conserved NPA motifs in LB and LE. TaSIPs showed a conserved second NPA motif, but in all first NPA motifs, alanine (A) was replaced with threonine (T) (TaSIP1;01_4D, TaSIP1;02_4A, TaSIP1;03_4B) or leucine (L) (TaSIP2;01_4B, TaSIP2;02_4A). In six members of the TaNIP subfamily, alanine (A) was replaced by serine (S) in the first NPA motif (TaNIP3;01_6B, TaNIP3;02_6A, TaNIP3;03_6D, TaNIP3;11_1B, TaNIP3;12_1A and TaNIP3;13_1D). In three TaNIPs (TaNIP3;01_6B, TaNIP3;02_6A, TaNIP3;03_6D) the second NPA motif was replaced by valine.
3.4.2 Aromatic/Arg (ar/R) selectivity filter and Froger positions
The ar/R position showed family-specific sequences. TaPIP could represent ancestral aquaporins that were conserved during terrestrial plant evolution (Li et al., 2014). Most of the TaPIPs (43) contained highly conserved amino acids in the ar/R selectivity filter (FHTR). Some H2 positions of phenylalanine (F) were replaced by alanine (A) or serine (S). Fifty nine of the 62 TaPIPs showed the same amino acid (serine-alanine-phenylalanine-tryptophan, S-A-F-W) sequence at the Froger position.
The P3, P4 and P5 positions in TaTIPs are highly conserved in potato, alfalfa and jatropha[37, 51,52].TaTIP results were similar to the TaPIP results. The P1 position in TaTIPs, at which serine (S) and threonine (T) are present, is highly variable; P4-P5 was highly conserved and the expected amino acids tyrosine (Y) and tryptophan (W) were identified, respectively. Selectivity filters (ar/R) vary greatly in plant TIPs. In the TaTIP subfamily, ar/R consisted of histidine/glutamine (H/Q) in H2; isoleucine/valine/threonine in H5 (I/V/T), alanine/glycine (A/G) in LE1, and arginine/valine (R/V) in LE2. TaNIPs and TaSIPs had highly variable ar/R selectivity filters and Froger locations, with the exception of P3 and P4 in TaNIPs and P2-P5 in TaSIPs.
3.4.3 Sub-cellular localization
Subcellular localizations of TaAQPs were predicted (Table 1). All TaPIPs were predicted to be localized to the plasma membrane. Most TaNIPs (32) were predicted to localize to the plasma membrane, with 3 TaNIPs being localized to the vacuole and 3 to the endoplasmic reticulum. Based on sequence similarity and subcellular localization, the aquaporin protein family was divided into 5 subfamilies, including TIPs (tonoplast intrinsic proteins); theoretically, TIPs should be positioned in the tonoplasts. However, in this study most of the TaTIPs (21/31) were located to the plasma membrane based on WoLF PSORT, that predicts protein subcellular localization from amino acid sequences with a prediction accuracy of 86%. It is necessary to experimentally confirm the precise locations of TaAQPs in future studies. TaSIPs were localized to the plasma membrane and vacuoles, and most TaAQP sequences displayed a typical topology of six transmembrane helical domains (TMs) (Table 1).
3.5 Synteny analysis of AQP genes
The donor of common wheat is defined as two genes from two different species, but they are derived from a single gene of the last common ancestor of that species. Paralogs are defined as gene repeats derived from a single gene within a genome. The homologous relationships betweenAQPgenes were analyzed using genomic sequence data fromT.aestivum(AABBDD), the diploid ancestral wheat speciesT.urartu(AA) andAe.tauschii(DD) and tetraploid ancestorT.dicoccoides(AABB). A total of 515 pairs of syntenicAQPparalogs and 1171 pairs of syntenic orthologs were identified in these genomes (Fig.4). Two hundred and nine pairs of syntenic paralogs were observed inT.aestivum, and 173, 278 and 283 syntenic orthologs were found betweenT.aestivumandT.urartu,T.dicoccoidesandAe.tauschii, respectively. Compared with the number of syntenic orthologs inT.urartuandAe.tauschii, there were 90 orthologs genes inT.urartuandT.dicoccoides, and 243 inAe.tauschiiandT.dicoccoides; 104 pairs of syntenic orthologs were present inT.urartuandAe.tauschii.This indicated that some syntenicAQPgenes were replicated multiple times during polyploidization of wheat.
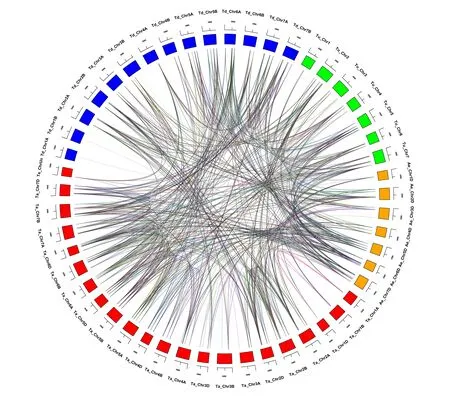
Notes:Paralog groups are displayed in different colors. The different colors on the periphery represents chromosomes of different genomes.Fig.4 Homology analysis of AQPs genes in wheat and its subgenome donors图4 小麦及其亚基因组供体的AQPs基因的同源性分析
3.6 Transcriptomic analysis of the response of wheat AQPs to salt and drought stress
Drought and salinity are major environmental factors that limit crop distribution and productivity[53]. Previous studies have shown that aquaporin expression varies widely under salt stress, depending on the level of stress, aquaporin type, plant tissue and species[54,55]. Whole transcriptome analysis is a useful method for surveying expression responses of a large number of genes[56]. Therefore, the expression patterns of 127TaAQPgenes in different organs under salt and drought stress were constructed.
Two separate heat map panels were generated (Fig.5). In Fig.5 the control (CK) was set at zero and fold changes relative to the CK under processing conditions, and use the numbers to show the multiple in the figure (Fig.5(b)). Twofold increases in expression or higher were regarded as significantly. Expression levels of different subfamilies of the same class ofTaAQPswere different.PIP1 had a higher expression level thanPIP2, and in subfamilyTIPonlyTIP1 was highly expressed. Furthermore in subfamilyNIP,NIP1 andNIP2 were lower expressed in wheat. Multi-conditional transcriptome analysis ofTaAQPsshowed that 34 of 62 TaPIPs displayed higher expression levels after salt and/or drought treatment. Under drought stress, expression ofTaPIP1;11_6A,TaPIP1;12_6B,TaPIP1;13_6D,TaPIP1;14_6B,TaPIP1;15_6AandTaPIP1;16_6Dwas significantly up-regulated.TaNIP2;05_7B,TaNIP2;06_7AandTaNIP1;01_7Ashowed distinct expression differences depending upon treatment; under drought stress, their expression levels were increased compared with the control, but under salt stress, expression levels of these three genes were decreased, with expression levels in seeds decreased the most. Expression ofTaTIPsvaried greatly with different treatments and in different tissues.TaTIP4;06_3BandTaTIP4;07_3Dwere expressed only in the spike under drought and/or salt stress. The expression levels ofTaTIP4;01_4B,TaTIP4;02_4D, andTaTIP4;03_5Awere higher under drought treatment and salt treatments. However, the expression levels ofTaTIP4;04_3AandTaTIP4;05_3Bwere significantly reduced under salt treatment. Expression differences of all TaSIPs under different treatments were not significant (Fig.5).

Notes:TaAQP gene expression patterns under different abiotic stresses, including drought stress (variety: CB037, Luyuan502, TAM107), salt stress (variety: Kharchia Local, Luohan NO. 6, QM-6, Chinese Spring). The gradual change of colorindicates that the expression level of the gene log2 (FPKM+1) transformation is different in fig.5(a).The color blockindicates that the expression level is reduced (blue) or increased (red) (significantly expressed a fold change>2) in fig.5(b).Fig.5 Multi-conditional transcriptome analysis of TaAQPs图5 TaAQPs的多条件转录组分析
3.7 qRT-PCR
Many studies have shown that plantAQPsrespond differently to various stress conditions. Several highly expressed and/or highly unique genes in terms of protein sequence were further analyzed by qRT-PCR, and the primers are listed in Table 2. The expression heat maps of 12TaAQPsin different organs and at different times were drawn, and the expression values of each aquaporin were log2 transformed (Fig.6). Under NaCl stress most genes except forTaNIP2;04a_7DandTaNIP3;03_6Dwere up-regulated in leaves after 2 or 4h.TaSIP2;02_4A,TaNIP4;03_3D,TaTIP2;02b_7BandTaPIP2;25b_2Bwere up-regulated at all time points.TaNIP2;04a_7Dwas significantly up-regulated after 2h of salt treatment, and down-regulated after 4h.TaPIP2;40_7D,TaTIP4;05_3B,TaNIP3;03_6DandTaPIP1;01_2Dwere up-regulated after 2 to 8h of salt stress and down-regulated after 12h. In the roots, all genes exceptTaNIP3;03_6DandTaNIP2;04a_7Dwere up-regulated after 2 and 4h.TaNIP4;03_3D,TaNIP1;08_7D,TaTIP4;03_5A,TaPIP2;40_7DandTaSIP2;02_4Awere up-regulated at all time points.TaTIP2;02b_7Bwas significantly up-regulated after 2h of salt treatment but was down-regulated after 4h. The expression patterns of several genes fluctuated during salt treatment; for example,TaPIP2;25b_2B,TaPIP2;26_2D, andTaPIP1;01_2Dwere up-regulated after 2h and 4h, down-regulated after 8h and 12h, and then up-regulated after 24h.
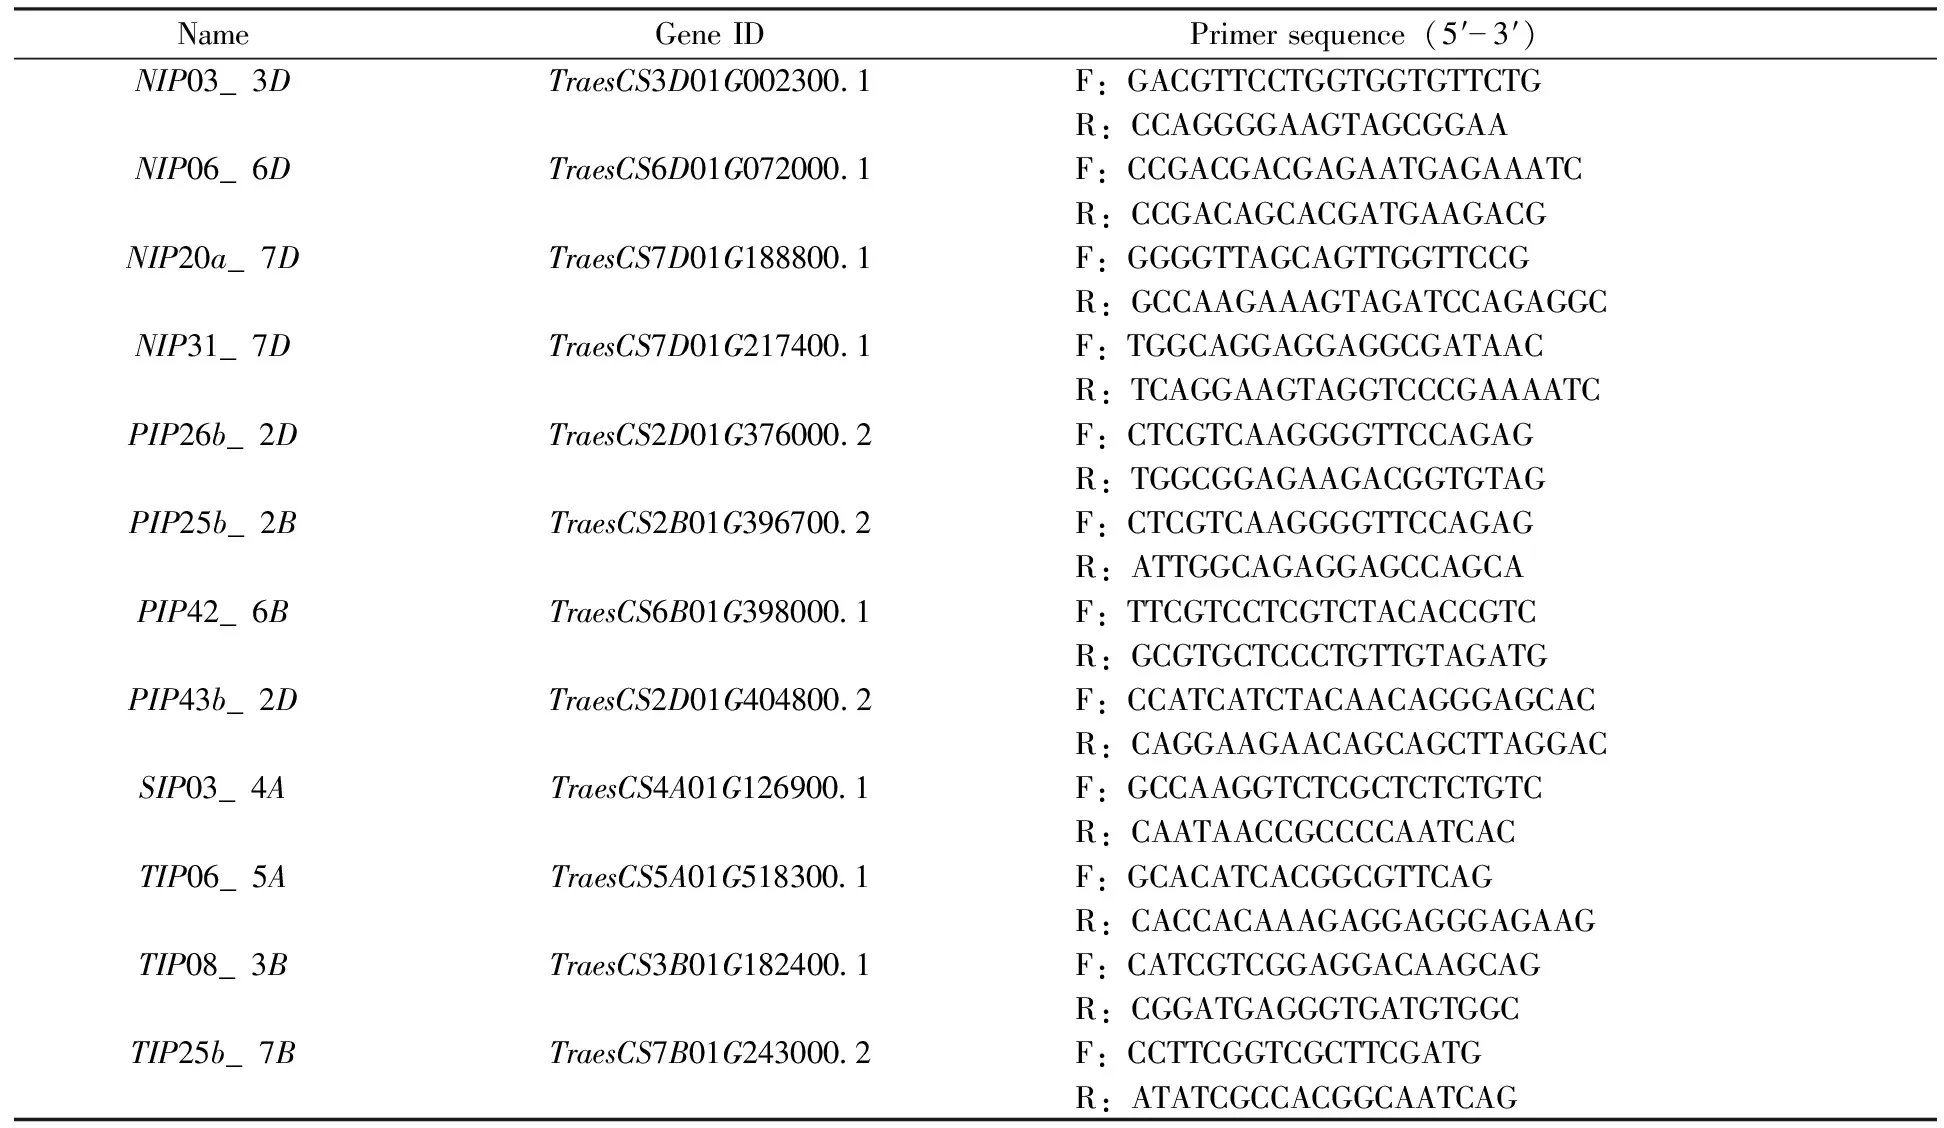
Table 2 Primers used in this study
Under PEG (20%) induced drought stress,TaNIP4;03_3D,TaNIP3;03_6D,TaSIP2;02_4AandTaTIP2;02b_7Bwere up-regulated in leaves at all time points, wherasTaNIP1;08_7Dwas down-regulated at all time points.TaPIP2;25b_2B,TaPIP2;26_2DandTaPIP2;40_7Dwere up-regulated at 2~12h after treatment and then up- or down-regulated at 24h. Expression patterns ofTaNIP2;04a_7D,TaPIP1;01_2DandTaTIP4;05_3Bfluctuated. In the roots, all genes were down-regulated after 8h. The expression levels ofTaNIP4;03_3D,TaNIP3;03_6D,TaNIP2;04a_7DandTaPIP1;01_2Dwere reduced at all time points.TaPIP2;40_7DandTaSIP2;02_4Awere up-regulated after 2h, but down-regulated after 4h.TaPIP2;25b_2B,TaPIP2;26_2DandTaTIP4;05_3Bwere down-regulated after 2~8h and up-regulated after 12h of treatment.
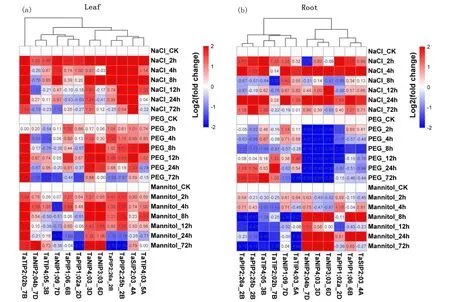
Notes:An expression heatmap in different organs and times. The expression values of each aquaporin are log2 transformed Fig.6 Expression and co-expression profiles of 12 aquaporins in wheat图6 小麦中12个水通道蛋白的表达和共表达谱
Under conditions of drought stress induced by mannitol (0.18mol/L) expression levels ofTaNIP4;03_3D,TaNIP3;03_6D,TaSIP2;02_4A,TaTIP2;02b_7BandTaNIP1;08_7Din leaves were similar to those under PEG-induced drought stress.TaPIP2;25b_2B,TaPIP2;26_2D,TaPIP2;40_7DandTaTIP4;03_5Awere up-regulated after 2~12h and down-regulated after 24h. In roots,TaTIP4;05_3BandTaTIP2;02b_7Bwere down-regulated at all time points, whereasTaNIP2;04a_7Dwas up-regulated at all time points.TaNIP1;08_7D,TaPIP2;25b_2B,TaPIP2;26_2DandTaTIP4;03_5Awere up-regulated after 2 and 4h, and down-regulated after 8h of treatment. In contrast,TaNIP4;03_3DandTaNIP3;03_6Dwere down-regulated after 2 and 4h, and up-regulated after 8h of treatment. Expression levels ofTaNIP4;03_3D,TaNIP3;03_6D,TaNIP2;04a_7D,TaPIP2;40_7DandTaSIP2;02_4Areached maxima at 8 and 24h. Thus aquaporin stress responses were highly variable depending on aquaporin isoform, type and level of treatment and plant tissue.
4 Discussion
4.1 Genome-wide identification and structural characterization of the AQP gene family
In this study, a total of 131TaAQPswere identified, including 127 non-redundant full-length protein-encodingAQPgenes and 11 splice variants (Table 1). The number ofAQPsidentified in wheat was higher than those inArabidopsis(37)[57], maize (20)[34]and rice (37)[33]. The complex polygenic traits of wheat can increase yield and nutrient use efficiency, and thus contribute to the sustainable growth of wheat crop yield. The homology analysis ofTaAQPssuggests that wheat may repeat multiple times during polyploidy. It is speculated that this may make wheat more adapt to the environment and increase yield in the process of evolution. WheatAQPswere classified into four distinct subfamilies:TaPIPs(62),TaTIPs(35),TaNIPs(41) andTaSIPs(6) (Fig.1); noXIPsubfamily members were found. Alternative splicing (AS) events that resulted in the production of iso-transcripts (Fig.3(b)), including 4 pairs ofPIPs, 2 pairs ofTIPsand 3 pairs ofNIPs. SeveralTaAQPs(TaPIP2;40_7D) lacked a transmembrane helix domain (Table 1), that could affect their subcellular localizations and water transport activities. For example, inTriticumturgidum, the truncated form of wheatTdPIP2;1 and AQPTdPIP2;1 had no water channel activity. Nevertheless, the functionalTdPIP2;1 could interact with the truncated form to enable it to reach the plasma membrane.
4.1.1 PIPs and TIPs

4.1.2 NIPs
The nodulin-26-like intrinsic protein (NIP) subfamily shows high sequence diversity[20]. According to the phylogenetic tree, wheat NIPs can be divided into four phylogenetic groups (Fig.1), whereas theArabidopsisand rice NIP families have 7 and 4 subgroups, respectively[57, 61]. Typically, the ar/R selectivity filter of the TaNIP1 group contains tryptophan/valine/alanine/arginine (W/V/A/R) residues (Table 1). Due to these structural similarities, TaNIP1 members might have similar transport specificities compared with other plant species, including low water permeability and ability to transport uncharged solutes, such as formamide and glycerol[20].
Previous studies found that the NIP2 subpopulation is the only AQP subpopulation capable of transporting silicon (Si), the second most abundant element in soil[62,63]. Rice Lsi1 (OsNIP2;1) was the first silicon transporter identified in plants. The ar/R region of OsLsi1 consists of four small-sized residues, glycine, serine, glycine and arginine (GSGR), which form a larger constriction pore, allowing relatively large silicic acid molecules to penetrate[64]. The ar/R region in the NIP2 subpopulation in wheat, a silicon accumulator, is also composed of four residues of glycine/serine/glycine/arginine (G/S/G/R) (Table 1). Deshmukh et al. suggested that the specific length (108 amino acids) of the spacing between the two NPA domains is a necessary and selective feature in Si-transporting plants[65]. For example, there is a spacing of 108 amino acids inOryzasativa,Sorghumbicolor,HelianthusannuusandBrachypodiumdistachyon[66], which accumulate more than 3.5% of silicon in leaves based on dry weight. In wheat (a silicon accumulator), Montpetit et al. cloned silicon transporter[67],Lsi1, which belongs to the NIP2 subfamily, and is annotated as TaNIP2;03_6D in this study. A spacing of 108 amino acids in TaNIP2;03_6D was identified, again indicating that this specific characteristic of AQPs may be important for Si permeability in plants as originally suggested by Deshmukh et al[65].
4.2 Expression of wheat Aquaporins in responding to salt and drought
Previous studies have suggested thatAQPsshow differential expression patterns in response to drought and salinity stress[50, 68]. However, functional studies of wheatAQPswere still insufficient. In the present work, heat maps constructed from known transcriptomics studies provided a better illustration of the transcript abundance pattern ofTaAQPsin different tissues under salt and drought treatments. In this study, it was found thatAQPexpression patterns were highly variable, depending on individualAQPs, specific tissues and stress type and duration. However, qRT-PCR were inconsistent with the transcriptomic results probably possible due to duration of treatment in this study, levels of treatment, wheat genotype and age of the seedlings.
qRT-PCR was also performed to analyze the expression ofTaAQPsin response to salt and drought stress. During drought stress treatment, the 12AQPgenes investigated were down-regulated in roots (Fig.6(b)). Although PEG and mannitol can induce drought stress, the expression of the same genes is different in response to PEG and mannitol stress. For example, the expression of theTaNIP20a7D,TaNIP03_3DandTaNIP06_6Dgenes in roots was completely opposite, in that they were down-regulated following PEG treatment but up-regulated with mannitol. The reasons for these results might be due to the fact that mannitol-induced stress is more severe than that of PEG[69]. Mannitol can adversely affect plants not only from inhibiting water absorption as PEG does, but it can also be absorbed by plant cells due to its small molecular weight and thus could interfere with other metabolism processes[70,71]. During the salt stress treatment, the expression levels of all 12TaAQPs, exceptTaNIP3;03_6DandTaNIP2;04a_7D, in the roots were significantly up-regulated after 2 and 4h, andTaNIP4;03_3D,TaNIP1;08_7D,TaTIP4;03_5A,TaPIP2;40_7DandTaSIP2;02_4Awere up-regulated at all time points. These results indicated thatAQPsmay be involved in early response to salt stress. In contrast, the expression patterns ofTaAQPsin leaves under salt and drought treatments changed in different ways, with all of them showing clear up-regulation after NaCl treatment, especially at 2h post initiation of treatment (Fig.6(a)). Up-regulation of three highly expressed TaAQPs,TaNIP4;03_3D,TaTIP2;02b_7BandTaSIP2;02_4Amight have positive effects on hydraulic conductivity at the cellular level throughout the leaf, but this requires further study.
5 Conclusions
Wheat plays a vital role in global food production. AQPs selectively control the flow of water and other small molecules through biofilms that are essential for several physiological processes in plants. In this study, 127 non-redundant TaAQPs in four subfamilies were identified, and their sequence and phylogenetic relationship were analyzed. Tissue-specific gene expression patterns and expression profiles under abiotic stress were analyzed. The qRT-PCR data showed thatTaNIP4;03_3D,TaNIP3;03_6D,TaNIP2;04a_7D,TaNIP1;08_7D,TaPIP2;25b_2B,TaPIP2;26_2D,TaPIP1;01_2D,TaPIP2;40_7D,TaSIP2;02_4A,TaTIP4;03_5A,TaTIP4;05_3BandTaTIP2;02b_7Bresponded differentially to salt and drought stresses in different tissues. Further molecular studies ofTaAQPsare needed to reveal the function of these genes in plant growth and stress response. These results provide a theoretical basis for future research onTaAQPfamily members and could contribute to genetic engineering of stress tolerance improvement in wheat.