The distribution characteristics of retinal nerve fiber layer thickness in macular area and its relationship with vessel density in highly myopic eyes
2021-08-10HuanChenChenChenQinLong
Huan Chen*, Chen Chen*, Qin Long
(作者单位:1100073中国北京市,中国医学科学院北京协和医院眼科;2100073中国北京市,中国医学科学院北京协和医学院眼底病重点实验室)
Abstract
KEYWORDS:retina; high myopia; optical coherence tomography angiography; retinal nerve fiber layer; macular vessel density
INTRODUCTION
High myopia (HM) refers to refractive errors greater than -6 diopter (D) with an axial length (AL) greater than 26 mm and is often associated with an increased risk of multiple ocular impairments, which may develop into irreversible vision loss, due to various pathologic changes in the choroid and retina, especially the macula area[1]. However, due to the uncertainty of the pathogenesis, the treatment for myopic maculopathy, particularly macular atrophy, remains a major challenge in HM eyes.
The retinal nerve fiber layer (RNFL) consists of ganglion cell axons and plays an important role in the maintenance of physiological function in the retina and choroid[2]. Previous studies have revealed that the peripapillary RNFL thickness decreases and is negatively correlated with the myopic degree in patients with HM[3-5]. However, the characteristics of macular RNFL in HM patients and its relationship with the myopic degree have been poorly studied. Additionally, evidence suggests that the pathogenesis of macular atrophy can be ascribed to choroidal and retinal microcirculation disorders in the posterior pole, accompanied by excessive eye elongation in the HM eye[6-7]. However, the specific mechanism remains to be clarified.
Optical coherence tomography angiography (OCTA) is an advanced, noninvasive imaging technique that is capable of measuring the retinal and choroidal vessel networks in different layers by detecting erythrocytes flowing in blood vessels over time. With OCTA, the RNFL thickness and vessel density (VD) of different layers in the macular area can be obtained, simultaneously. The purpose of our study was to investigate the distribution characteristics of RNFL thickness and VD in the macular area of HM eyes, using OCTA, which may help us to better understand the pathogenesis of macular atrophy due to HM.
SUBJECTS AND METHODS
SubjectsThis study was approved by the Institutional Review Board of Peking Union Medical College Hospital. The methods were performed in accordance with the tenets of the Declaration of Helsinki. Patients with HM were randomly recruited from the Ophthalmology Department of Peking Union Medical College Hospital (Beijing, China), from March 2019 to May 2019. A total of 40 eyes in 20 patients were included in this study. The inclusion criteria were as follows: 1) spherical equivalent (SE) ≤-6.00 D with AL≥26 mm; 2) clear optical media, with good fixation; 3) stable mental health, with the ability to understand the examination. The exclusion criteria were as follows: 1) any type of ocular disorder in either eye, other than HM; 2) a history of intraocular surgery or ocular trauma; 3) a history of hypertension, diabetes mellitus, or other systemic diseases that may affect vessel diameter; 4) mental illness.
Patients underwent a detailed ophthalmic examination, including best-corrected visual acuity (BCVA), intraocular pressure (IOP) measurement, a slit-lamp examination, and dilated fundus examination, by indirect ophthalmoscope. The refractive error value was represented by the spherical equivalent (SE). The AL was measured with a coherence interferometry biometric measurement device (IOL Master; CarlZeiss Meditec, Oberkochen, Germany).
OCTAMeasurementsandDataAnalysisSpectralis OCTA (Version SP 6.9a; Spectralis Heidelberg Engineering, Heidelberg, Germany) was used in this study by the same investigator in every case to eliminate the possible interobserver variability. OCTA images were obtained, following pupil dilation, using a 6 mm×6 mm volume scan pattern centered on the fovea. The automated real-time mode was set to 35 (frames averaged per B-scan), and the scan was repeated twice to acquire the best images. A 6 mm×6 mm volume OCTA scan can provide a macular RNFL thickness map and automatically draw three concentric circles, with radii of 1.0 mm, 3.0 mm, and 6.0 mm relative to the fovea center, and nine subfields were defined using the Early Treatment Diabetic Retinopathy Study (ETDRS) grid: the central region (within the inner circle); the pericentral superior, pericentral nasal, pericentral inferior, and pericentral temporal subfields (between the inner and middle circles); and the peripheral superior, peripheral nasal, peripheral inferior, and peripheral temporal subfields (between the middle and outer circle). The built-in software automatically calculated and generated an average RNFL thickness for each region.
En face images of the superficial retinal capillary plexus (SCP), deep retinal capillary plexuses (DCP), and choroidal capillary (CC) were visualized automatically by segmenting two separate slabs, which were defined by arbitrary segmentation lines created by the device software.VD was expressed as the proportion of the total measured area with a blood flow signal[7]. VDs of the macular SCP, DCP, and CC angiograms were measured by the same doctor, using a binarization technique in ImageJ software (version 1.49, National Institutes of Health, Bethesda, Maryland, USA). Niblick’s autolocal threshold technique was adopted in our study, as previously described[8-9]. Figure 1 shows an example OCTA image and binarized images using Niblick’s autolocal threshold technique in ImageJ software.
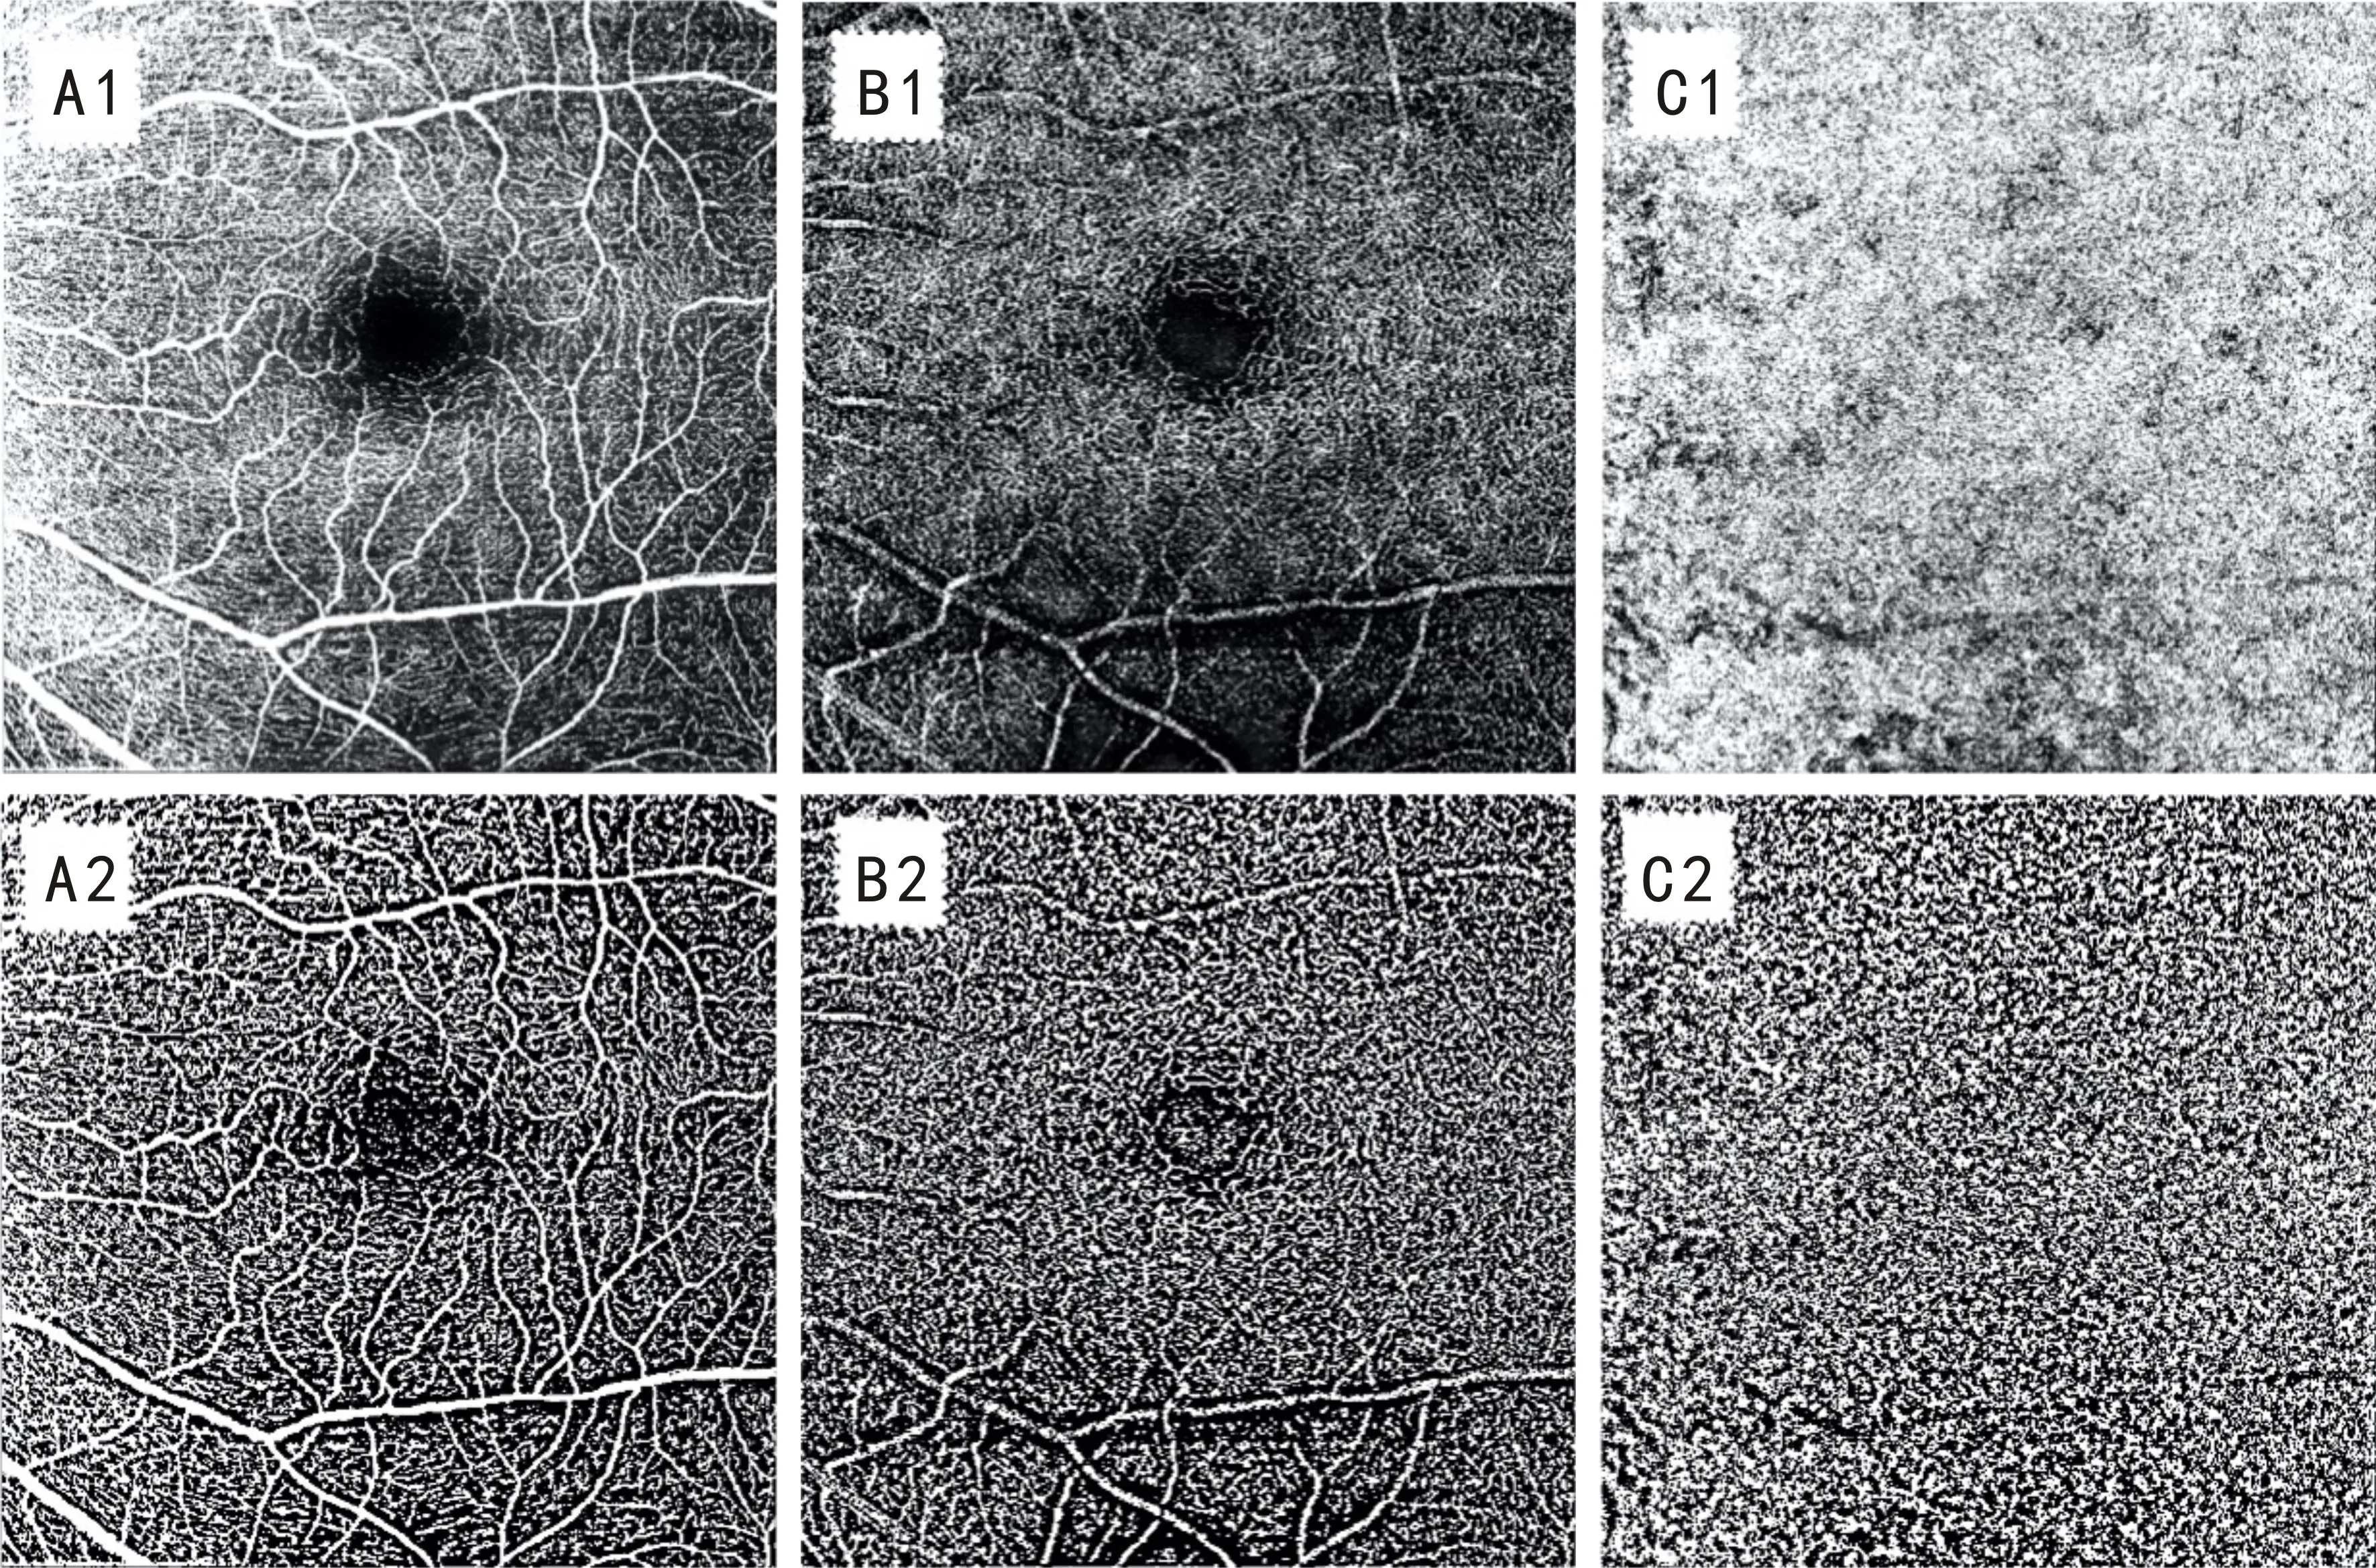
Figure 1 Example OCTA image and binarized images using Niblick’s autolocal threshold technique in ImageJ software Figures A1, B1 and C1 are OCTA images of the SCP, DCP, and CC respectively; Figures A2, B2, and C2 are binarized images of SCP, DCP, and CC using local Niblack respectively.
StatisticalAnalysesData were analyzed using the statistical software IBM SPSS 19.0 for Windows (SPSS, Chicago, IL). The Shapiro-Wilk test was used to determine the normal distribution of the data. Numerical variables with normal distributions were presented as the mean±standard deviation (SD) and were compared using a one-way analysis of variance (ANOVA) and Tukey’s post hoc tests. Numerical variables without normal distributions were presented as the median±quartile spacing, and a Kruskal-Wallis test was used for group comparisons. A Mann-WhitneyUtest was used to determine the differences among quadrants of the pericentral and peripheral regions. To evaluate the relationship between the RNFL thickness and macular VD profiles and between RNFL thickness and AL, Spearman’s correlation analysis was used. AP-value of less than 0.05 was considered to be significant.
RESULTS
DemographicOverall, 20 subjects diagnosed with HM were recruited in this study, including 11 female and 9 male subjects, with a mean age of 29.90±7.92 (range: 21-41) years old, with a mean SE of -8.95±2.01 (range: -6.38 to -14.88) D, and a mean AL of 27.06±0.62 (range: 26.16-28.93) mm.
MacularRNFLThicknessProfilesThe RNFL thicknesses in the central, pericentral, and peripheral regions were significantly different (P<0.001). Pairwise comparisons showed that the RNFL thicknesses of the pericentral (89.50±12.00) μm and peripheral (152.00±30.25) μm regions were thicker than that of the central region (14.00±4.75 μm) (P<0.001) (Figure 2A). Further analysis of the quadrantal partitions showed that all quadrants in the pericentral regions had thinner RNFLs than the corresponding quadrants in the peripheral regions (allP<0.05; Table 1).
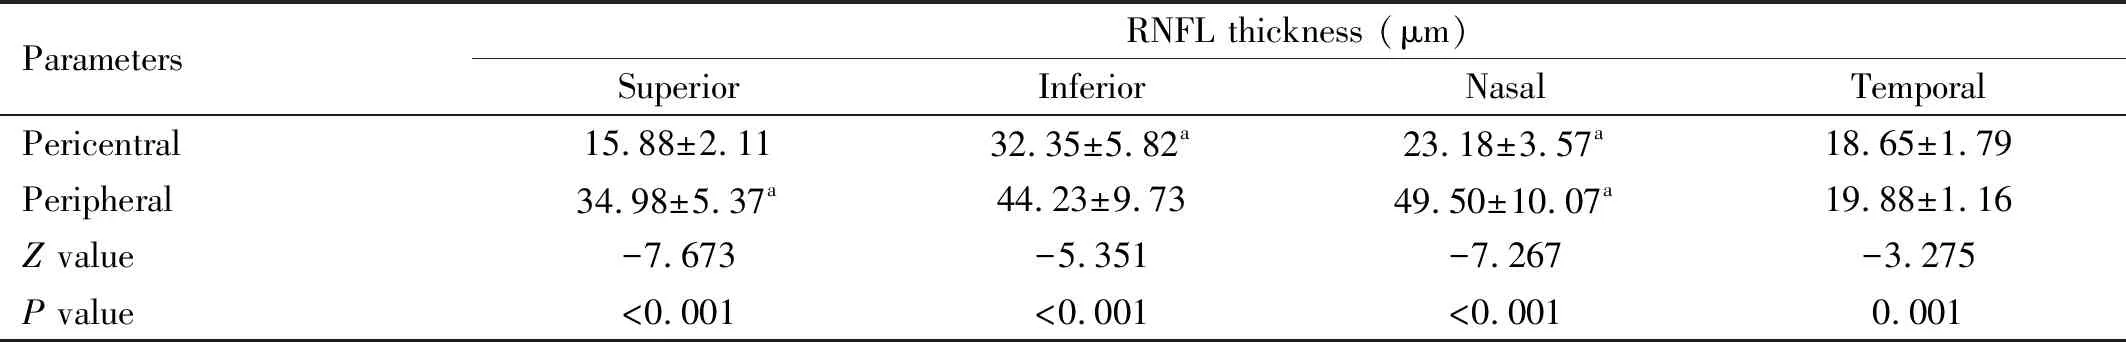
Table 1 Regional RNFL thickness in the pericentral and peripheral areamean±SD
The RNFL thicknesses of the superior, inferior, nasal, and temporal quadrants of the pericentral region were significantly different (allP<0.05), and pairwise comparisons showed that the RNFL thickness of the superior quadrant was the lowest, whereas that in the inferior quadrant was the highest (P<0.05) (Figure 2B). Similarly, significant differences were observed among the RNFL thicknesses of the four quadrants of the peripheral region (P<0.001); pairwise comparisons revealed that the RNFL thickness of the temporal quadrant was the lowest, whereas the RNFL thickness of the nasal quadrant was significantly larger than those of the superior and temporal quadrants (P<0.05) but was not significantly different compared with that of the inferior quadrant (P=0.603) (Figure 2C).
RelationshipsBetweenMacularRNFLThicknessProfilesandSEorALSpearman’s correlation analysis showed that the RNFL thickness of the central region was not correlated with the SE or AL (allP>0.05). Similarly, in the pericentral regions, no correlations were found between RNFL thickness in any quadrant and SE or AL (allP>0.05). In the peripheral region, the RNFL thickness of the superior quadrant was negatively correlated with SE (r= -0.356,P=0.024) (Figure 3), but RNFL thickness was not correlated with the SE or AL in any other quadrant (allP>0.05).

Figure 2 Comparisons of different regions of macular RNFL thickness A: RNFL thickness of the central, pericentral, and peripheral regions. aThe comparison of total RNFL thickness between the central area and the pericentral area, P<0.05. bThe comparison of total RNFL thickness between the central area and the peripheral areas, P<0.05. cThe comparison of total RNFL thickness between the pericentral area and the peripheral area, P<0.05; B: The pericentral RNFL thickness in different quadrants. aPairwise comparisons showed that the RNFL thickness of the inferior quadrant was the highest, P<0.05; bPairwise comparisons showed that the RNFL thickness of the superior quadrant was the lowest, P<0.05; C: The peripheral RNFL thickness in different quadrants. bpairwise comparisons revealed that the RNFL thickness of the temporal quadrant was the lowest, P<0.05.
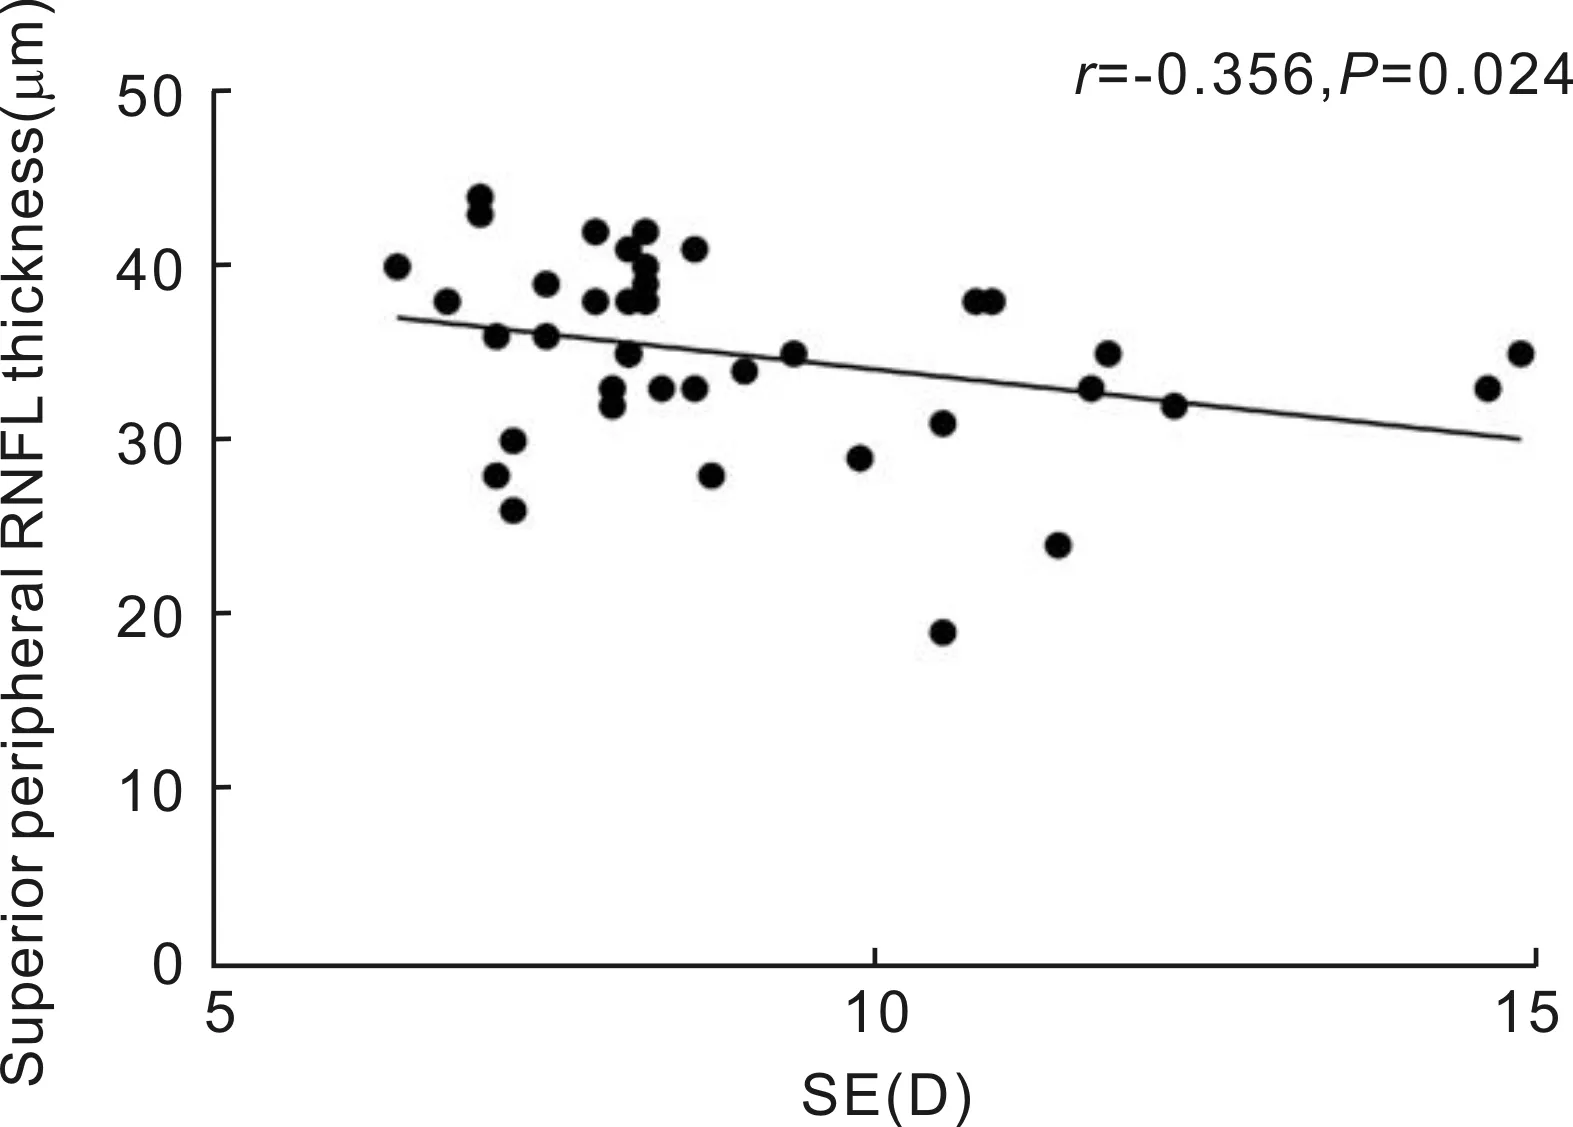
Figure 3 The RNFL thickness of the superior quadrant of the peripheral area was negatively correlated with the SE.
RelationshipsBetweenRNFLThicknessandVDinDifferentLayersIn the central region, no correlations were found between RNFL thickness and the VD of the SCP, DCP, or CC (allP>0.05). In the pericentral region, the VD in the SCP was positively correlated with the RNFL thickness in the nasal and inferior quadrants (r=0.314 and 0.408,P=0.048 and 0.002, respectively). No correlations were found between RNFL thickness and the VD of the DCP in any quadrant. In the peripheral region, correlations were found between the VD of the SCP and RNFL thickness in the superior, nasal, and inferior quadrants (r=0.467, 0.655, and 0.737;P=0.002,P<0.001, andP<0.001, respectively). However, no correlations were found between the RNFL thickness and the VDs for the DCP in any quadrant (allP>0.05) (Table 2). In contrast, a negative correlation was observed between the VD of the CC layer and RNFL thickness in the superior quadrant (r= -0.356,P=0.024).
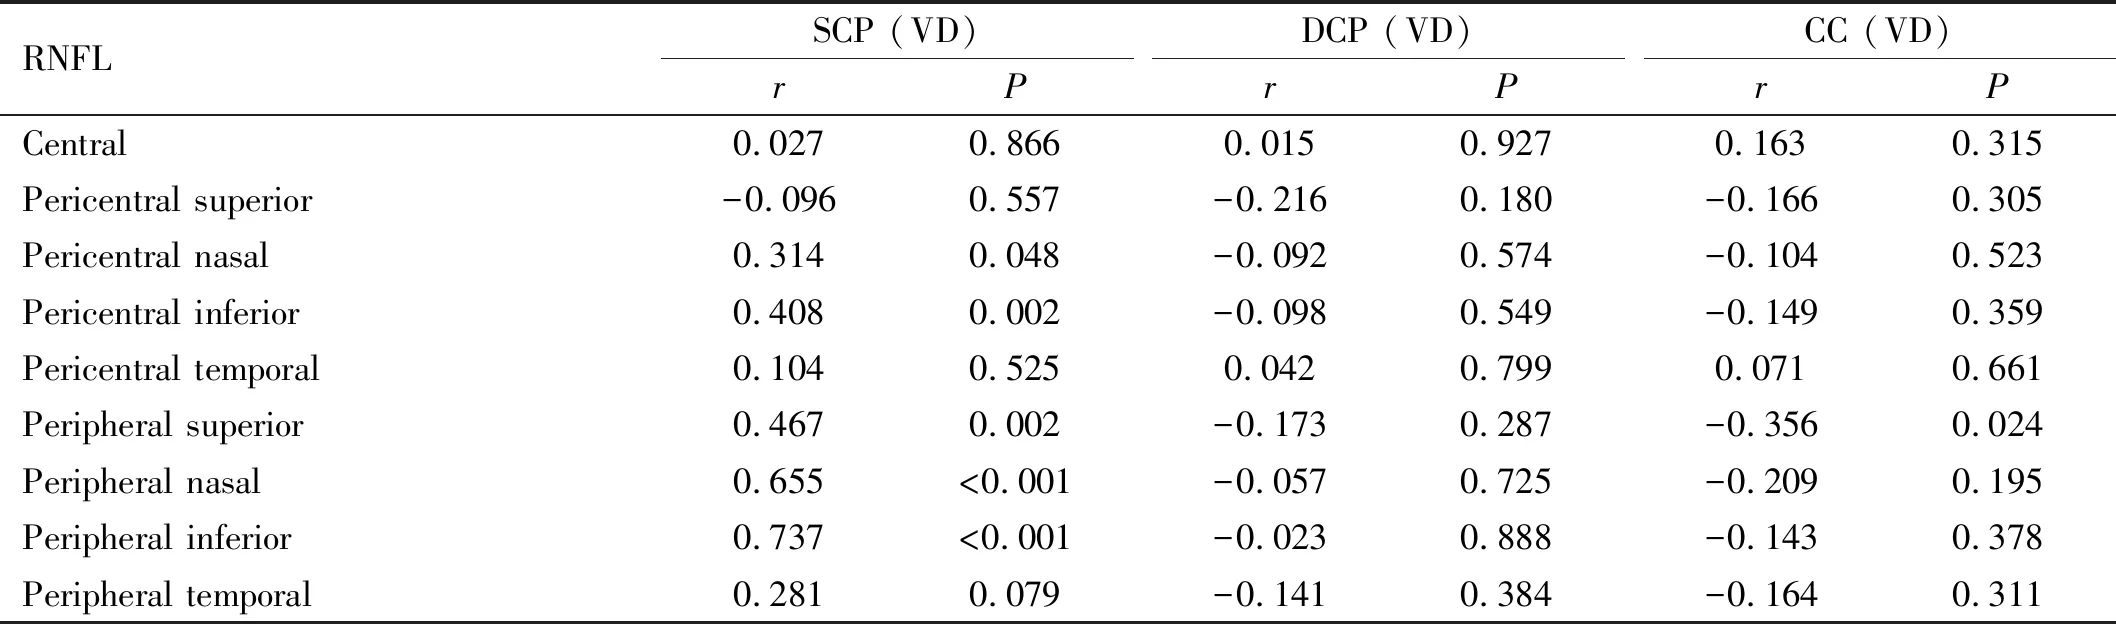
Table 2 Relationship between RNFL thickness and VD in the macular area
DISCUSSION
In the present study, we found out that the RNFL thickness was unevenly distributed in the macular region of HM patients. As the SE increases, the RNFL thickness decreases in the peripheral superior subfield. The VD of SCP was positively correlated with RNFL in nasal and inferior quadrants of pericentral region and in the superior, nasal, and inferior quadrants of the peripheral region whereas the VD of CC was negatively correlated with RNFL thickness in the peripheral superior subfield.
Chorioretinal atrophy, especially in the macular region, is a primary manifestation of myopic maculopathy and is also a major cause of vision loss in HM eyes[10]. With the advantages of ultrahigh-resolution second-generation Spectralis OCTA, macular RNFL thicknesses in different regions and VDs in multiple layers were detected and analyzed in HM eyes to investigate the potential pathomechanisms underlying myopic maculopathy.
Many studies have investigated structural changes in myopic eyes using OCTA, mainly the thinning of the peripapillary RNFL[11], and the impairment of the macular microvascular network[12], while found no correlation between peripapillary RNFL thickness and macular VD in HM eyes[13]. Only one literature addressed the difference of macular RNFL in the pericentral region in HM eyes compared to normal controls[14]. Till now, there is no report addressing the relationship between macular RNFL thickness and macular VD in HM eyes. Using Spectralis OCTA, we focused on macula, simultaneously observed the RNFL thickness profiles of different regions and the VD distribution of different layers, which can provide a more comprehensive picture of macular microstructure and help detecting the potential linkage underling macular neurotrophy and microvascular network in HM eyes. Our results indicated that different quadrants and subfields in macular region have different characteristics in term of RNFL thickness. Based on the subfield, macular RNFL thickness in eyes with HM gradually increased, from the central region to the pericentral and peripheral regions, which was accordant to the results of Liuetal[14], this distribution profile may result in the central region of macula more sensitive to myopic pathological injury, such as ischemia hypoxia induced by AL elongation in HM eyes. As to the quadrant, in the pericentral macula, the RNFL was found to be the thickest in the inferior and the thinnest in the superior quadrant, while in the pericentral macula, the RNFL thickness was the thickest in the nasal quadrant and the thinnest in the temporal quadrant. For the reasons causing the inhomogeneous RNFL thickness distribution, first, the RNFL anatomy may play an important role, in which the axons of retinal ganglion cells in the temporal macula pass through the superior and inferior maculopapular bundle and terminate at the optic disc, therefore, fewer retinal nerve fibers exist in the temporal quadrant than that of other quadrants in peripheral macular subfield as showed in our results. Second, in the HM eye, the unbalanced biomechanical stretching of the posterior sclera may further result in the observed heterogeneous profile of macular RNFL thickness across different quadrants and subfields[15-17]. Further analysis combining with other relative parameters, such as the regional eyeball expansion in HM eyes, are necessary to make more integrate explanation.
Correlation analysis showed that macular RNFL thickness in the superior peripheral region was negatively correlated with the myopic degree, which is in agreement with the results reported by previous studies[13-14]. Evidence has suggested that decreasing SE causes the chorioretinal to become hypoxic, which may cause the degeneration of retinal ganglion cell axons and, consequently, induce the thinning of the RNFL[18]. The thinning of the RNFL in the macula could further lead to myopic maculopathy, due to a lack of local neurotrophy.
In our study, a positive correlation was found between the VD of the SCP and the RNFL thickness in the nasal and inferior pericentral regions, as well as the superior, nasal, and inferior peripheral regions. Evidence showed that, in HM eyes, peripapillary RNFL dysfunction may cause a reduction in the oxygen supply and nutrient demand, resulting in further peripapillary VD loss[19], the macular VD in SCP was significantly lower in the HM eyes compared to normal controls[13,20], however, the relationship between macular RNFL and macular VD still need to be explored previous studies have demonstrated that HM might cause hypoxia and insufficient perfusion as the SE decreases and the AL increases[21], which may lead to the rupture of Bruch’s membrane and changes in the retinal pigment epithelium (RPE)[22-23]. Hence, the elongation of the eye that occurs during HM leads to the thinning of the RNFL, due to the expansion of the posterior sclera, further stretching the capillaries in the macular area[24]and potentially damaging Bruch’s membrane, which may further impair chorioretinal circulation in the posterior pole. A recent study demonstrated that the VD of the SCP and DCP were protective factors for diffused chorioretinal atrophy[25]. Therefore, excessive AL elongation, which mechanically stretches the retinal tissue, may result in decreased retinal thickness and the further degeneration of the retinal vascular endothelium and RPE; this process may also reduce the production of vascular endothelial growth factor (VEGF), resulting in a relative decrease in VD, which may, consequently, induce the progressive thinning of the chorioretinal thickness and macular atrophy in HM eyes.
As mentioned above, we found a positive correlation between macular RNFL thickness and the VD of the SCP, which is consistent with the histopathological changes observed during HM changes. Interestingly, our study showed a negative correlation between the VD of the CC and the RNFL thickness of the superior pericentral area, which may be related to the induction of secondary choroidal neovascularization (CNV) due to disruptions in microcirculation in HM eyes[23].
The primary limitations of our study are as follows: 1) since the main purpose of our study was to investigate the comprehensive distribution characteristics of RNFL and its relationship with VD in macular area focusing on HM patients, thus, we didn’t include normal control group in the current experimental design, further comparative studies involving healthy emmetropic subjects need to be conducted to improve and verify our research findings; 2) the sample size was relatively small; 3) although we found multiple characteristic profiles for macular RNFL, VD, and the relationship between these two factors in eyes with HM, implying a potential maculopathy mechanism that can be attributed to HM, the relationships between either RNFL or VD and concrete types of myopic maculopathy were not investigated in this study due to the small sample size.
In summary, the present study found that in eyes with HM, the RNFL is not equally distributed throughout the macular region. As the SE increases, the thickness of the RNFL decreases in the superior peripheral region, moreover, RNFL thickness was correlated to the macular VD of the SCP and CC layers. These characteristics of eyes with HM improve our understanding of the potential mechanisms that may be involved in the development of maculopathy due to HM, particularly macular atrophy. Further studies with larger sample sizes including emmetropic subjects are necessary before definite conclusions can be drawn.
