全景透视多模态学习分析的数据整合方法
2021-02-26穆肃崔萌黄晓地
穆肃 崔萌 黄晓地

摘要:多模态学习分析被认为是学习分析研究的新生长点,其中,多模态数据如何整合是推进学习分析研究的难点。利用系统文献综述及元分析方法,有助于为研究和实践领域提供全景式的关于多模态数据整合的方法与策略指导。通过对国内外363篇相关文献的系统分析发现:(1)多模态学习分析中的数据类型主要包含数字空间数据、物理空间数据、生理体征数据、心理测量数据和环境场景数据等5类。在技术支持的教与学环境中,高频、精细、微观的多模态学习数据变得可得、易得、准确。(2)多模态学习分析中的学习指标主要有行为、注意、认知、元认知、情感、协作、交互、投入、学习绩效和技能等。随着技术的发展和人们对学习过程的深刻洞察,学习指标也会变得更加精细化。(3)数据与指标之间展现出“一对一”“一对多”和“多对一”三种对应关系。把握数据与指标之间的复杂关系是数据整合的前提,测量学习指标时既要考虑最适合的数据,也要考虑其他模态数据的补充。(4)多模态学习分析中的数据整合方式主要有“多对一”“多对多”和“三角互证”三种,旨在提高测量的准确性、信息的全面性和整合的科学性。总之,多模态数据整合具有数据的多模态、指标的多维度和方法的多样性等三维特性。将多模态数据时间线对齐是实现数据整合的关键环节,综合考虑三维特性提高分析结果的准确性是多模态数据整合未来研究的方向。
关键词:多模态学习分析;数据类型;学习指标;数据整合;系统文献综述
中图分类号:G434 文献标识码:A 文章编号:1009-5195(2021)01-0026-13 doi10.3969/j.issn.1009-5195.2021.01.003
基金项目:2018年度国家社科基金重大项目“信息化促进新时代基础教育公平的研究”(18ZDA334)子课题“面向基础教育精准帮扶的无缝学习体系研究”。
作者简介:穆肃,教授,博士生导师,华南师范大学教育信息技术学院(广东广州 510631);崔萌(通讯作者),博士研究生,华南师范大学教育信息技术学院(广东广州 510631);黄晓地,副教授,澳大利亚查尔斯特大学计算机与数学学院(澳大利亚新南威尔士州奥尔伯里 2640)。
一、研究背景与问题
传统的学习分析数据源通常是单维或单一模态的(Schwendimann et al.,2017),例如学习管理平台(Learning Management System,LMS)记录的学生日志数据。但是,并不是所有的学习过程都发生在LMS中,数据也不都是字符或数字,因而很多LMS之外的学习情况并没有被记录,但它们对于了解学习过程却非常重要。同时,由于单维或单一模态数据仅能提供部分学习过程信息(Eradze et al.,2017),容易产生“路灯效应”,有可能会降低分析结果的准确性。而真实的学习过程往往是复杂多维的(Di Mitri et al.,2018),有可能是多平台、多场所、多方式的混合。因此,为了更全面准确地了解学习过程,研究者必须尽可能收集学习过程中的声音、视频、表情、生理等多模态数据(牟智佳,2020)。
在此背景之下,多模态学习分析(Multimodal Learning Analytics,MMLA)成为学习分析领域新的研究分支(Blikstein,2013;Di Mitri et al.,2018)。多模态学习分析以学习机理为核心,利用多种分析技术对复杂学习过程中的多模态数据进行同步采集和整合处理,旨在全面准确地对学习特点和规律建模,为教与学提供支持(Worsley,2018)。多模态学习分析是典型的交叉学科研究,涉及教育技术、计算机科学、学习科学等多个学科领域(Di Mitri et al.,2018)。数据整合是多模态学习分析的重难点所在(张琪等,2020;Samuelsen et al.,2019),系统地理清数据整合的研究现状具有重要意义。为此,本研究聚焦多模态学习分析中的数据整合问题,用系统文献综述方法进行相关文献综述,聚焦如下三个研究问题:
第一,多模态学习分析中的数据类型有哪些?学习指标有哪些?第二,数据与指标之间的对应关系如何?第三,多模态学习分析中数据整合的主要方式、关键环节以及主要特征有哪些?
二、研究设计与过程
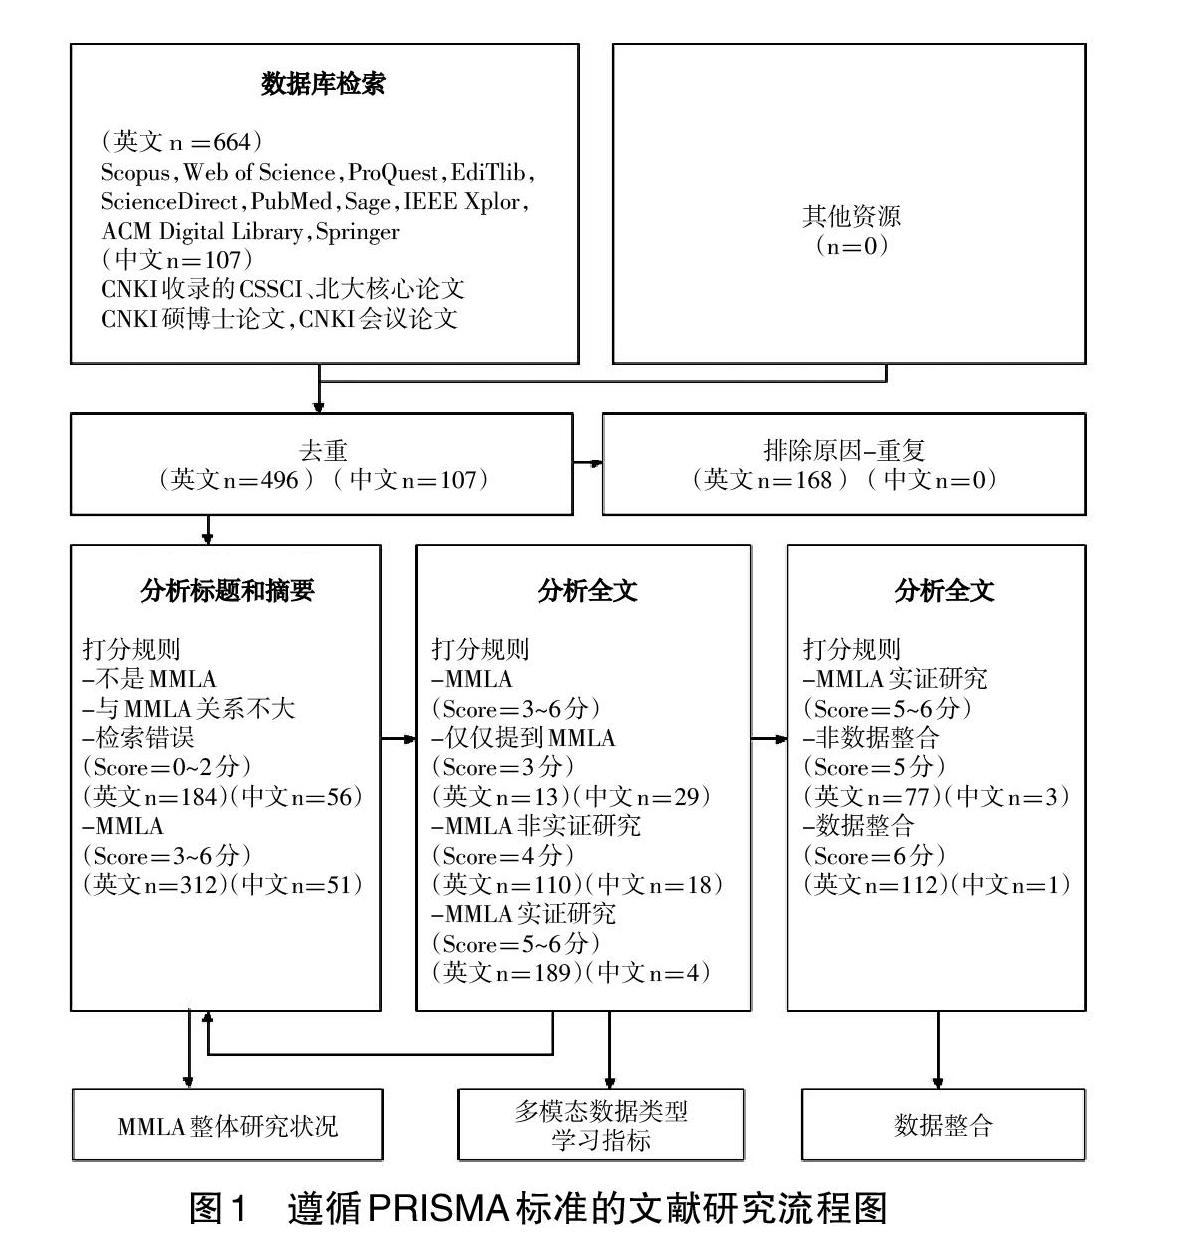
本研究遵循系统文献综述及元分析方法(Preferred Reporting Items for Systematic Reviews and Meta-Analyses,PRISMA)的研究理路进行文献综述。该方法是国际上常用的基于文献证据的系统性综述方法(Moher et al.,2009),其有标准化的文献综述流程和详细的过程审查列表。根据PRISMA的流程和审核要求,本研究制定了如图1所示的文献分析流程。
文献分析过程包括5个阶段。第一是文献检索阶段,即检索与多模态学习分析相关的中英文文献。第二是内容相关度评分阶段,即运用制定的评分策略对文献进行评分,将与多模态学习分析不相关文献赋分为0~2分,将相关文献赋分为3~6分。第三是初步分类阶段,该阶段将相关文献分成三类:(1)提及多模态学习分析,(2)多模态学习分析的理论探讨,(3)多模态学习分析的实证研究。第四是实证类研究分析阶段,即通过对实证研究论文的分析找出多模态学习分析中的数据类型和学习指标,同时辨别出进行数据整合的论文。第五是数据整合情况的综合分析阶段,即聚焦数据整合的实证研究论文,整理其数据整合的方法和方案。
多模态学习分析整体研究现状如图2所示。图中数据显示,中文文献(不限年份且相关度≥3的文献有51篇)远少于英文文献(限定年份2017年之后且相关度≥3的文献有312篇)。在“提及多模态学习分析”“多模态学习分析的理论研究”“多模态学习分析的实证研究”三类文献的数量分布上,中文文献分别有29篇、18篇和4篇,英文文献分别有13篇、110篇和189篇。这表明国内多模态学习分析的研究更关注引介和理论探讨;而国外对多模态学习分析的理论探讨和实证研究都很重视。在研究內容方面,多模态学习分析的实证研究涉及“数据整合”与“非数据整合”的数量分别为:中文1篇与3篇、英文112篇与77篇,可见当前国际研究更加关注多模态学习分析中的数据整合。从检索到的文献来看,目前不论国内还是国外都没有关于多模态数据整合分析的综述文章,为此,为了给正在进行或有兴趣开展这一领域研究的同行提供一个全面、有深度的全景分析,本研究对多模态数据整合分析的文献进行系统分析并形成了元分析报告。
三、多模态学习分析中的数据类型、学习指 标及其对应关系
1.多模态学习分析中的数据类型
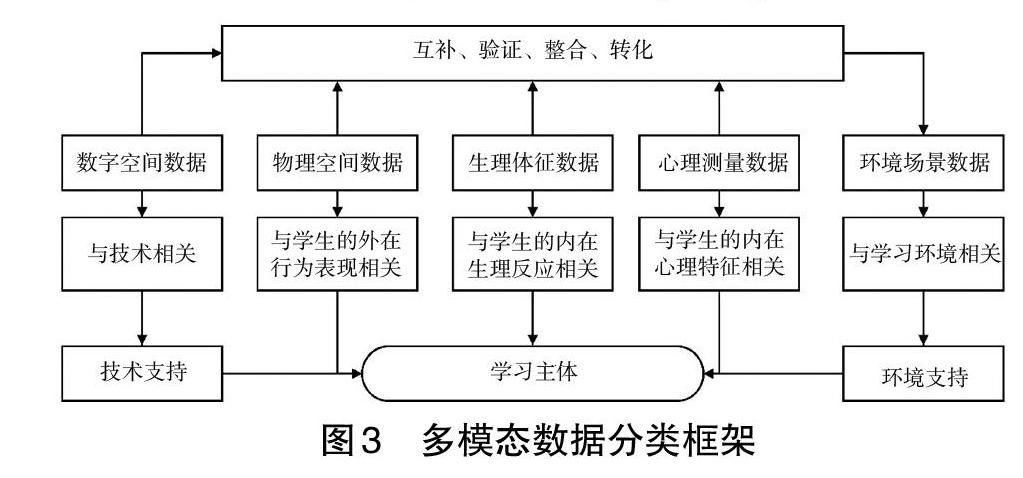
现有的多模态学习分析研究大都关注到“多模态数据类型”,但数据分类不尽相同。比较典型的数据分类有:(1)行为数据(如运动模态、生理模态)和情景数据(Di Mitri et al.,2018);(2)学习体征数据、人机交互数据、学习资源数据和学习情境数据(牟智佳,2020);(3)外显数据、心理数据、生理数据和基础数据(陈凯泉等,2019);(4)生理层数据、心理层数据、行为层数据和基本信息数据(钟薇等,2018)。现有的数据分类结果各有优劣,大多数属于理论总结。本研究尝试从现有的实证研究中总结数据类型,并结合理论上的分类总结最终形成了如图3所示的多模态数据分类框架。同时,本研究也列出了多模态数据分类编码及其对应的实证研究文献支撑(见表1)。为便于编码分析,本研究除使用各类数据名称常规的英文缩写外,对没有常规缩写的数据名称采用英文单词首字母缩写方式。例如,Electroencephalogram的常规缩写为EEG,Body Language没有常规缩写,故将其缩写为BL。
该分类框架根据数据产生的场域将多模态数据分为数字空间数据(Di Mitri et al.,2018)、物理空间数据(Martinez-Maldonado et al.,2018)、生理体征数据(Yin et al.,2017)、心理测量数据、环境场景数据(Di Mitri et al.,2019)5类。其中,(1)数字空间数据是指由技术平台记录的、在学习中产生的各类数字痕迹,如在线学习平台(Monkaresi et al.,2017)、虚拟实验平台(Liu et al.,2019)、STEAM教育软件(Spikol et al.,2018)平台上学生进行操作的行为数据。(2)物理空间数据是指由各类传感器获得的、与人的外在可见行为表现相关的数据,如身体各部分在物理空间中的运动变化和位置等。伴随传感器技术的发展,能够获得且被应用到学习分析中的身体数据越来越细化,如头部移动的角度(Cukurova et al.,2020)和手指在平板电脑上的移动数据等(Duijzer et al.,2017)。物理空间数据感知与分析对学习过程的解读具有重要意义(刘智等,2018;Martinez-Maldonado et al.,2018),现已形成重要的研究分支,如具身认知理论与行为研究(Ibrahim-Didi et al.,2017)。(3)生理体征数据是指反映人的内在生理体征的数据,包括眼动、脑电、皮电、心电等,能够更加客观地反映在线学习的状态(Yin et al.,2017)。(4)心理测量数据是指各类自我报告数据,能够主观反映学习者的心理状态,是比较传统的学习状态数据来源。(5)环境场景数据是指学习者所处学习场景的环境数据,如温度、天气等。已有研究表明,学习环境对学习有不同程度的影响(Di Mitri et al.,2018),增加环境数据分析是多模态学习分析的趋势之一。因此,如何获取以上类型的多模态数据、合理利用这些数据、解释描述学习状态、根据分析结果为学习者提供相应学习服务已成为研究者面临的现实问题(刘智等,2018)。
得益于物联网、传感器、可穿戴设备、云存储以及大数据高性能计算等的发展,分布在每个空间里的各类高频、精细、微观的学习过程数据将得以准确获取。由于多模态数据更能反映学生真实的学习状态(Di Mitri et al.,2018),因此在进行多模态数据分析时,更应考虑多空间或单个空间里的多种模态数据,尤其在一些实践性强的课程中更是如此。例如在教学过程中,学生通过表情、语言、肢体动作等多种方式与教学内容、学习同伴、教师和媒体平台等进行交互,各类交互的数据对学习过程分析至关重要,需要全方位的有效获取并整合。
各種类型数据可以实现互补、验证、整合和转化。数据互补性是多模态数据很重要的一个特性。任何一种模态的数据都能提供关于某一现象或过程的部分解释,而这些解释从其他模态的数据中可能无法获得(钟薇等,2018)。数据互补可通过不同数据来说明、描述或解释同一研究对象和内容,有利于交互证实所得出的结果(Di Mitri et al.,2018)。除此之外,多模态数据整合可以充分利用各类数据的特点对学习过程或学习状态进行更加全面而准确的分析,如将身体的移动、手势等物理空间里的数据与数字平台中的日志数据进行同步存储,以便用于对学习过程的分析(Di Mitri et al.,2018)。数据转化是指将一种空间中的数据转化为另一空间的数据,如将物理空间数据转化为数字空间数据(牟智佳,2020)。典型的研究有通过智能书写笔技术将学生真实的书写过程数字化,通过动态书写特征数据预测学习绩效(Oviatt et al.,2018);还有研究将学生复习纸质试卷的过程数字化,形成数字痕迹和数字脚注,以便用于分析真实的复习行为(Paredes et al.,2018)。这类研究的优势在于能够将学生学习最为真实的行为和状态数据进行技术化处理,从而帮助人们更加深入地认识复杂的学习过程。
2.多模态学习分析中的学习指标
研究发现,多模态学习分析中所应用的学习指标主要包括行为、注意、认知、元认知、情感、协作(Cukurova et al.,2017)、交互(Schneider et al.,2018)、投入(张琪等,2019)、学习绩效和技能等。部分学习指标还可进一步细化分类。例如,行为指标可分为在线学习行为(Oviatt et al.,2018;Paredes et al.,2018)、课堂学习行为(Watanabe et al.,2018)、具身学习行为(Gorham et al.,2019)、教师教学行为(Watanabe et al.,2018)等。注意指标可分为个人注意(Mudrick et al.,2019)和联合注意(Sharma et al.,2019)。情感指标可分为自主学习中的情感(Munshi et al.,2019)和协作学习中的情感(Martin et al.,2019)。协作指标可分为面对面协作(Ding et al.,2017)和远程协作(Andrade et al.,2019)。投入指标可分为在线自主学习投入(Monkaresi et al.,2017)和课堂学习投入(Aslan et al.,2019)。学习绩效指标可分为结果性绩效和过程性绩效,既可涉及考试成绩(Sriramulu et al.,2019;Dindar et al.,2020)、游戏得分(Giannakos et al.,2019)等较为简单的数据,还可涉及协作学习质量、任务得分和学习效果(Dich et al.,2018)等复杂多元的数据。
从已有研究对学习指标的分析可知,学习指标的种类繁多证实了学习过程的复杂性。部分学习指标之间含义重叠交叉,如既可单独分析协作(Reilly et al.,2018)和投入(Monkaresi et al.,2017),也可分析协作学习中的投入(Kim et al.,2020)。值得注意的是,学习指标的选择也有一些规律可循,如协作学习的指标多关注协作特征(Cukurova et al.,2020)和协作交互(Malmberg et al.,2019),而自主学习指标则多关注注意、认知(Abdelrahman et al.,2017)和投入(Fwa et al.,2018);面对面协作的指标较多(Ding et al.,2017),而远程协作的指标相对较少(DAngelo et al.,2017)。随着学习过程洞察研究愈加深入,学习指标也会更加细致。例如针对在线学习,有研究者深入到微观角度,利用眼动数据关注学习者在每个学习页面中的学习路径(Mu et al.,2019)。
3.多模态数据与学习指标的对应关系
多模态数据指向复杂的学习过程,能够揭示数据和指标之间的复杂关系(Oviatt,2018)。从前文分析可知,数据与指标之间存在三种对应关系:一对一、多对一和一对多。“一对一”是指一类数据只适合度量一个学习指标,此类对应最为简单且应用较为普遍。随着研究的深入和技术的发展,数据分析的细粒度逐步增加(张琪等,2020),每一类数据的测量潜力被逐步挖掘,一对一的情况将越来越少。例如,传统的认知过程测量方法是访谈和量表,而当生理测量技术发展起来之后,生理数据如脑电也被用于认知测量(Mills et al.,2017),由此便产生了第二类对应关系。“多对一”是指多个数据均可度量同一指标。例如,眼动、脑电和皮电都可用于测量学习投入(Sharmaet al.,2019)。“一对多”是指一类数据可度量多个学习指标。例如,眼动可以测量注意、认知(Sommer et al.,2017)、情感(Zheng et al.,2019)、协作和投入(Thomas,2018)等。
在数据和指标的对应关系中,一对多和多对一的情况已较为普遍。数据与指标之间对应关系多样化的本质原因在于,在技术条件和相关理论的支持下,数据的测量范围、测量准确性和对指标的表征能力有所差别。例如,眼动数据用于学习内容关注焦点的挖掘效果较好(Mu et al.,2018),在量化学习者认知状态、注意力水平、信息加工过程(Minematsu et al.,2019)等方面具有优势。表情数据对情感(Tzirakis et al.,2017)和投入(Thomas,2018)的测量效果较好,它对强烈的情感(如“喜悦”和“生气”)有较好的测量效果。生理数据对微妙情感有较好的测量效果(Pham et al.,2018)。已有研究明确指出,一个学习指标既可用单一数据测量,也可用多模态数据测量(张琪等,2020;Pham et al.,2018)。因此,学习指标测量既要考虑到最优数据,也要考虑到其他数据的补充,这正是数据整合的意义所在。
四、多模态学习分析中的数据整合
为了进一步挖掘学习分析层面的数据融合情况,本研究从数据整合方式、数据类型、学习指标三方面对多模态数据整合分析的研究文獻进行了归纳。由表2可知,已有文献中的数据整合方式既有跨类型的多模态数据整合,例如跨越数字空间数据和物理空间数据整合(Alyuz et al.,2017),跨越心理测量数据和生理体征数据整合(Dindar et al.,2020);也有非跨类型的多模态数据整合,例如生理体征数据类型中对具体数据的整合(Yin et al.,2017)。对于学习指标,数据整合既有关注单一指标的,如学习投入度(Thomas,2018);也有同时关注多个指标的,如同时关注协作、投入和学习绩效(Worsley et al.,2018)。现有的数据整合方式主要有三类(见图4):(1)多对一,即用多维度、多模态数据测量一个学习指标,以提高测量的准确性;(2)多对多,即用多维度、多模态数据测量多个学习指标,以提高信息的全面性;(3)三角互证,即通过多方数据互相印证来提高对某一问题阐释的合理性,是进行整合研究的实证基础。对比三类整合研究可发现,与单模态数据相比,数据整合的价值体现在整合能够提高测量的准确性和信息的全面性,并带来更有意义的研究结论,从而起到“1+1>2”的效果。只有做到“多对一”分析才算真正走向了数据整合。
1. “多对一”:提高测量的准确性
此类数据整合主要有两大特点:一是有明确的数据整合算法模型,多模态数据(两类以上)是模型输入,学习指标(通常只有一个)是模型输出。二是数据整合有助于提高学习指标测量的准确性。例如,声音数据可以测情感(Cukurova et al.,2019),表情数据也可以测情感(Martin et al.,2019)。有研究用深度神经网络算法将两类数据进行整合,用以提高情感测量的准确性(Ez-zaouia et al.,2017)。
此类研究中,数据模态的增加、数据特征的选择、数据整合比例划分以及算法模型的选择都会影响测量的准确性。有研究对比了单模态数据和多模态数据的研究效果,结果证明多模态数据的研究准确性较高(Cukurova et al.,2019)。在选择用于分析的数据方面,有研究者直接选用原始数据进行分析(Tzirakis et al.,2017),也有研究者通过在原始数据基础上筛选(Thomas et al.,2018)或构造与学习相关的数据进行分析,以期增加分析结果的教学可解释性。值得注意的是,不同数据对同一学习指标测量的准确性有可能存在差异,例如有研究者证实了眼动和脑电数据在预测情感的准确性上就存在差异(Zheng et al.,2019)。总之,当采用“多对一”方式进行数据整合时,不是简单的1:1整合,而是要根据各类数据的测量准确性、数据与学习指标的相关性等因素综合采用数据和算法。高效的算法模型是此类研究的关注点(Tzirakis et al.,2017),大部分研究通常会对比几种不同算法模型的应用效果,从而确定最优的算法模型。
2. “多对多”:提高信息的全面性
此类数据整合具有如下特点:一是包括多维度学习指标(两个以上),二是数据与学习指标一一对应,三是没有数据整合算法,四是数据整合能提高信息的全面性。例如,有研究者同时用眼动数据来测注意,用脑电数据来测认知(Tamura et al.,2019)。
多对多的数据整合分析需要多个学习指标,同时利用多方面的多模态数据进行整合分析,以期全面、准确地反映学习过程。当前能够支持数据整合的分析系统有演讲训练系统(Schneider et al.,2019)、书写训练系统(Limbu et al.,2019)、医学训练系统(Di Mitri et al.,2019)、自然情景下的学习分析系统(Okada et al.,2020)、课堂监控整合系统(Anh et al.,2019)、跳舞训练系统(Romano et al.,2019)等。现有研究中有不少是用一种数据来测量和分析多个学习指标,如用眼动数据来测量注意、期望和疲倦三个指标,用脑电数据来测量认知负荷、心理负荷和记忆负荷三个指标(Sharmaet al.,2019)。顯然,只用一种数据来同时测量多个指标会过于夸大单一数据的作用,在一定程度上也会降低结果解释的准确性。因此,在条件允许的情况下,应尽量为每一个学习指标选择最适合的数据。
3.三角互证:提高整合的科学性
数据整合的三角互证研究旨在通过多模态数据之间的互证分析来获得更多有价值的结论。在已有研究中,对各种数据的分析是单独和平行的,即用不同数据同时测量同一指标,通过对比分析不同数据对同一学习指标的测量效能,为“多对一”和“多对多”的数据整合研究提供实证依据。例如,有研究者收集了多模态数据进行协作学习分析(Starr et al.,2018),单独分析了每一类数据对协作的测量情况,包括语言数据如何反应协作情况(Reilly et al.,2019),人体姿态中哪些数据能够体现协作(Reilly et al.,2018),眼动数据如何测量协作(Schneider et al.,2019),生理数据如何反应协作时的状态变化(Schneider et al.,2020)。也有研究者单独分析了自我报告数据和眼动数据对学习投入的测量情况(Limbu et al.,2019)。还有研究者注重分析各类数据之间的互证关系(J?rvel? et al.,2019),如有研究重点分析生理数据和表情数据之间的互证关系;还有研究关注协作学习中生理数据与情绪数据之间的互证关系,即当由生理数据得到的觉醒发生时,学生情绪(通过表情数据测量得到)是如何变化的(Malmberg et al.,2019)。
4.整合方式的补充
以上是目前已开展的多模态数据整合的主要方式,随着研究的深入和技术的发展,未来数据整合的方式将会更加丰富多样。例如,在对学习过程进行分析时,可以根据不同的学习环境、阶段和学习内容,选择不同维度和类型的数据进行分析,然后整合形成完整的学习过程分析,这也是一种数据整合分析的思路(Mu et al.,2018)。在对在线学习过程进行分析时,有研究者先用日志数据对整体学习轨迹的时间线进行分析,根据具体学习阶段确定需要深入分析的焦点时刻,然后用学习过程的录屏视频数据和语音数据对焦点时刻进行详细分析(Liu et al.,2019)。再如,有研究者先用日志数据对整体学习路径进行描述,然后用眼动数据和记录学习过程的视频数据对学习者观看教学视频和在线练习两个关键学习环节进行微观分析,从而实现对学习者学习过程的细致画像(Mu et al.,2019)。
需要说明的是,同步采集不同时间和不同粒度的多模态数据是有效开展数据整合的前提,这就需要通过部署数据同步采集系统来实现。数据整合系统通常包含表情分析模块(Thomas,2018)、VR模块(Schneider et al.,2019)、人体姿态模块(Zaletelj et al.,2017)和自我报告模块等。如果在采集数据时没能实现多模态数据的同步采集,则需要在数据清理时以时间为基线对各类数据进行时间线对齐处理。例如,STREAMS系统可将符合格式要求的日志数据与其他多模态数据进行整合处理(Liu et al.,2019)。可见,“时间线对齐”是数据整合的关键环节之一,也是数据清洗和整理的重点。
总之,数据整合分析既是多模态学习分析的核心,也是难点。多模态数据获取相对容易,但真正整合起来进行分析则存在较多困难,而且费时费力(Liu et al.,2019)。另外,数据的整合采集也并不意味着一定存在整合分析,有些研究虽然利用了数据整合采集系统,如演讲训练系统(Schneider et al.,2019),但在具体分析中也只选择了单一维度的数据进行分析,而并未做到基于多模态数据的整合分析。
五、总结与展望
多模态数据整合分析研究的特点可归纳为三点:数据的多模态、指标的多维度和方法的多样性,如图5所示。数据的多模态是最直观的外在表现(X轴),指标的多维度体现了学习过程的复杂性(Y轴),方法的多样性体现了分析技术的特点(Z轴)。现有的数据整合研究或考虑数据的准确性(A点),或考虑信息的全面性(B点),但最理想的应是准确性、全面性和多样性共同作用下的分析,即C点。本研究认为,未来的数据整合需要不断提高测量准确性和信息全面性,不断建立有效的分析方法,以更智能、高效、准确、全面地反映学习者的学习过程,呈现学习者的学习状态和规律,进而改进教与学的效果。例如,可以用眼动和行为数据共同测量认知,用表情数据且通过人工判断和机器识别两种方法整合测量情感,用访谈获取元认知自省数据和用自我报告测量动机水平(Munshi et al.,2019)。
总体而言,多模态学习分析不仅关注收集各种类型的数据,而且注重对各类数据的整合分析,以期更准确、全面地体现学习过程的复杂性(钟薇等,2018)。各类感知设备和技术将在无感情况下,获取更多学习数据,丰富数据类型;对学习发生机理、脑科学和学习科学最新研究进展的教育追问将促进学习指标的持续更新;同时随着指向学习指标的多模态数据整合分析技术的不断发展,人工智能技术将为数据分析提供技术支撑(牟智佳,2020),并不断提升数据整合分析的能力。因此,未来多模态学习分析如能紧紧把握数据整合这一难点问题并不断尝试新的解决方法和技术,将能凸显数据多维整体、真实境脉、实时连续的优势,实现对教学过程和教学效果更加即时、多维、直观、全面的分析。
参考文献:
[1]陈凯泉,张春雪,吴玥玥等(2019). 教育人工智能(EAI)中的多模态学习分析、适应性反馈及人机协同[J]. 远程教育杂志, 37(5):24-34.
[2]刘智,刘三
[3]牟智佳(2020). 多模态学习分析:学习分析研究新生长点[J]. 电化教育研究, 41(5):27-32,51.
[4]张琪,王红梅(2019). 学习投入的多模态数据表征:支撑理论、研究框架与关键技术[J]. 电化教育研究, 40(12):21-28.
[5]张琪,武法提,许文静(2020). 多模态数据支持的学习投入评测:现状、启示与研究趋向[J]. 远程教育杂志, 38(1):76-86.
[6]鐘薇,李若晨,马晓玲等(2018). 学习分析技术发展趋向——多模态数据环境下的研究与探索[J]. 中国远程教育, (11):41-49,79-80.
[7]Abdelrahman, Y., Velloso, E., & Dingler, T. et al. (2017). Cognitive Heat: Exploring the Usage of Thermal Imaging to Unobtrusively Estimate Cognitive Load[J]. Proceedings of the ACM on Interactive, Mobile, Wearable and Ubiquitous Technologies, 1(3):1-20.
[8]Ahonen, L., Cowley, B. U., & Hellas, A. et al. (2018). Biosignals Reflect Pair-Dynamics in Collaborative Work: EDA and ECG Study of Pair-Programming in a Classroom Environment[J]. Scientific Reports, 8(1):1-16.
[9]Alyuz, N., Okur, E., & Genc, U. et al. (2017). An Unobtrusive and Multimodal Approach for Behavioral Engagement Detection of Students[C]// Proceedings of the 1st ACM SIGCHI International Workshop on Multimodal Interaction for Education. UK, Glasgow:26-32.
[10]An, P., Bakker, S., & Ordanovski, S. et al. (2020). Dandelion Diagram: Aggregating Positioning and Orientation Data in the Visualization of Classroom Proxemics[C]// Proceedings of the Extended Abstracts of the 2020 CHI Conference on Human Factors in Computing Systems. Honolulu, HI:1-8.
[11]Andrade, A., Maddox, B., & Edwards, D. et al. (2019). Quantitative Multimodal Interaction Analysis for the Assessment of Problem-Solving Skills in a Collaborative Online Game[C]// Eagan, B., Misfeldt, M., & Siebert-Evenstone, A. (Eds.). Proceedings of the Advances in Quantitative Ethnography. Madison, WI:281-290.
[12]Anh, B. N., Son, N. T., & Lam, P. T. et al. (2019). A Computer-Vision Based Application for Student Behavior Monitoring in Classroom[J]. Applied Sciences, 9(22):4729.
[13]Aslan, S., Alyuz, N., & Tanriover, C. et al. (2019). Investigating the Impact of a Real-time, Multimodal Student Engagement Analytics Technology in Authentic Classrooms[C]// Proceedings of the 2019 CHI Conference on Human Factors in Computing Systems(CHI19). UK, Glasgow:1-12.
[14]Asadipour, A., Debattista, K., & Chalmers, A. (2017). Visuohaptic Augmented Feedback for Enhancing Motor Skills Acquisition[J]. The Visual Computer, 33(4):401-411.
[15]Blikstein, P. (2013). Multimodal Learning Analytics[C]// Proceedings of the Third International Conference on Learning Analytics and Knowledge. Leuven, Belgium:102-106.
[16]Burnik, U., Zaletelj, J., & Ko?ir, A. (2018). Video-Based Learners Observed Attention Estimates for Lecture Learning Gain Evaluation[J]. Multimedia Tools and Applications, 77(13):16903-16926.
[17]Cukurova, M., Kent, C., & Luckin, R. (2019). Artificial Intelligence and Multimodal Data in the Service of Human Decision-Making: A Case Study in Debate Tutoring[J]. British Journal of Educational Technology, 50(6):3032-3046.
[18]Cukurova, M., Luckin, R., & Millán, E. et al. (2017). The NISPI Framework: Analysing Collaborative Problem-Solving from Students Physical Interactions[J]. Computers & Education, 116:93-109.
[19]Cukurova, M., Zhou, Q., & Spikol, D. et al. (2020). Modelling Collaborative Problem-Solving Competence with Transparent Learning Analytics: Is Video Data Enough?[C]// Proceedings of the Tenth International Conference on Learning Analytics & Knowledge.Germany,Frankfurt:270-275.
[20]DAngelo, S., & Begel, A. (2017). Improving Communication Between Pair Programmers Using Shared Gaze Awareness[C]// Proceedings of the 2017 CHI Conference on Human Factors in Computing Systems. Denver, CO:6245-6290.
[21]Davidsen, J., & Ryberg, T. (2017). “This Is the Size of One Meter”: Childrens Bodily-Material Collaboration[J]. International Journal of Computer-Supported Collaborative Learning, 12:65-90.
[22]Di Mitri, D., Schneider, J., & Specht, M. et al. (2018). From Signals to Knowledge: A Conceptual Model for Multimodal Learning Analytics[J]. Journal of Computer Assisted Learning, 34(4):338-349.
[23]Di Mitri, D., Schneider, J., & Specht, M. et al. (2019). Detecting Mistakes in CPR Training with Multimodal Data and Neural Networks[J]. Sensors, 19(14):3099.
[24]Dich, Y., Reilly, J., & Schneider, B. (2018). Using Physiological Synchrony as an Indicator of Collaboration Quality, Task Performance and Learning[M]// Penstein-Rosé C. et al. (Eds.). Artificial Intelligence in Education. Switzerland,Cham, Springer International Publishing. 10947:98-110
[25]Dindar, M., Malmberg, J., & J?rvel?, S. et al. (2020). Matching Self-Reports with Electrodermal Activity Data: Investigating Temporal Changes in Self-Regulated Learning[J]. Education and Information Technologies, 25(3):1785-1802.
[26]Ding, Y., Zhang, Y., & Xiao, M. et al. (2017). A Multifaceted Study on Eye Contact Based Speaker Identification in Three-party Conversations[C]// Proceedings of the 2017 CHI Conference on Human Factors in Computing Systems. Denver, CO:3011-3021.
[27]Duijzer, C. A. C. G., Shayan, S., & Bakker, A. et al. (2017). Touchscreen Tablets: Coordinating Action and Perception for Mathematical Cognition[J]. Frontiers in Psychology, 8:144.
[28]Edwards, A. A., Massicci, A., & Sridharan, S. et al. (2017). Sensor-Based Methodological Observations for Studying Online Learning[C]// Proceedings of the 2017 ACM Workshop on Intelligent Interfaces for Ubiquitous and Smart Learning. Limassol, Cyprus:25-30.
[29]Eradze, M., & Laanpere, M. (2017). Lesson Observation Data in Learning Analytics Datasets: Observata[C]// Proceedings of the 12th European Conference on Technology-Enhanced Learning (EC-TEL 2017). Tallinn, Estonia:504-508.
[30]Ez-zaouia, M., & Lavoué, E. (2017). EMODA: A Tutor Oriented Multimodal and Contextual Emotional Dashboard[C]// Proceedings of the Seventh International Learning Analytics & Knowledge Conference (LAK17). Canada, Vancouver:429-438.
[31]Fwa, H. L., & Marshall, L. (2018). Modeling Engagement of Programming Students Using Unsupervised Machine Learning Technique[J]. GSTF Journal on Computing, 6(1):1-6.
[32]Gan, T., Li, J., & Wong, Y. et al. (2019). A Multi-sensor Framework for Personal Presentation Analytics[J]. ACM Transactions on Multimedia Computing, Communications, and Applications, 15(2):1-21.
[33]Giannakos, M. N., Sharma, K., & Pappas, I. O. et al. (2019). Multimodal Data as a Means to Understand the Learning Experience[J]. International Journal of Information Management, 48:108-119.
[34]Gorham, T., Jubaed, S., & Sanyal, T. et al. (2019). Assessing the Efficacy of VR for Foreign Language Learning Using Multimodal Learning Analytics[M]// Giannikas, C. N., Kakoulli-Constantinou, E., & Papadima-Sophocleous, S. (Eds.). Professional Development in CALL: ASelection of Papers. France, Voillans: Research-publishing.Net:101-116.
[35]Hassib, M., Khamis, M., & Friedl, S. et al. (2017). Brainatwork: Logging Cognitive Engagement and Tasks in the Workplace Using Electroencephalography[C]// Proceedings of the 16th International Conference on Mobile and Ubiquitous Multimedia. Germany, Stuttgart:305-310.
[36]Healion, D., Russell, S., & Cukurova, M. et al. (2017). Tracing Physical Movement During Practice-Based Learning Through Multimodal Learning Analytics[C]// Proceedings of the Seventh International Learning Analytics & Knowledge Conference (LAK17). Vancouver, BC:588-589.
[37]Henrie, C. R., Bodily, R., & Larsen, R. et al. (2018). Exploring the Potential of LMS Log Data as a Proxy Measure of Student Engagement[J]. Journal of Computing in Higher Education, 30:344-362.
[38]J?rvel?, S., Malmberg, J., & Haataja, E. et al. (2019). What Multimodal Data Can Tell Us about the Students Regulation of Their Learning Process?[J]. Learning and Instruction, 101203.
[39]Junokas, M. J., Lindgren, R., & Kang, J. et al. (2018). Enhancing Multimodal Learning Through Personalized Gesture Recognition[J]. Journal of Computer Assisted Learning, 34(4):350-357.
[40]Kim, Y., Butail, S., & Tscholl, M. et al. (2020). An Exploratory Approach to Measuring Collaborative Engagement in Child Robot Interaction[C]// Proceedings of the Tenth International Conference on Learning Analytics & Knowledge. Germany, Frankfurt:209-217.
[41]Larmuseau, C., Vanneste, P., & Cornelis, J. et al. (2019). Combining Physiological Data and Subjective Measurements to Investigate Cognitive Load During Complex Learning[J]. Frontline Learning Research, 7(2):57-74.
[42]Ibrahim-Didi, K., Hackling, M. W., & Ramseger, J. et al. (2017). Embodied Strategies in the Teaching and Learning of Science[M]// Hackling, M. W., Ramseger, J., & Chen, H.-L.S. (Eds.). Quality Teaching in Primary Science Education: Cross-Cultural Perspectives.Cham, Switzerland,Springer International Publishing:181-221.
[43]Limbu, B. H., Jarodzka, H., & Klemke, R. et al. (2019). Can You Ink While You Blink? Assessing Mental Effort in a Sensor-Based Calligraphy Trainer[J]. Sensors, 19(14):3244.
[44]Liu, R., Stamper, J., & Davenport, J. et al. (2019). Learning Linkages: Integrating Data Streams of Multiple Modalities and Timescales[J]. Journal of Computer Assisted Learning, 35(1):99-109.
[45]Loup-Escande, E., Frenoy, R., & Poplimont, G. et al. (2017). Contributions of Mixed Reality in a Calligraphy Learning Task: Effects of Supplementary Visual Feedback and Expertise on Cognitive Load, User Experience and Gestural Performance[J]. Computers in Human Behavior, 75:42-49.
[46]Malmberg, J., J?rvel?, S., & Holappa, J. et al. (2019). Going Beyond What Is Visible: What Multichannel Data Can Reveal about Interaction in the Context of Collaborative Learning?[J]. Computers in Human Behavior, 96:235-245.
[47]Martin, K., Wang, E. Q., & Bain, C. et al. (2019). Computationally Augmented Ethnography: Emotion Tracking and Learning in Museum Games[C]// Eagan, B., Misfeldt, M., & Siebert-Evenstone, A. (Eds.). Proceedings of the Advances in Quantitative Ethnography. Madison, WI: Springer International Publishing:141-153.
[48]Martinez-Maldonado, R., Echeverria, V., & Fernandez Nieto, G. et al. (2020). From Data to Insights: A Layered Storytelling Approach for Multimodal Learning Analytics[C]// Proceedings of the 2020 CHI Conference on Human Factors in Computing Systems. Honolulu, HI:1-15.
[49]Martinez-Maldonado, R., Echeverria, V., & Santos, O. C. et al. (2018). Physical Learning Analytics: A Multimodal Perspective[C]// Proceedings of the 8th International Conference on Learning Analytics and Knowledge (LAK18). Australia, Sydney:375-379.
[50]Mills, C., Fridman, I., & Soussou, W. et al. (2017). Put Your Thinking Cap on: Detecting Cognitive Load Using EEG During Learning[C]// Proceedings of the Seventh International Learning Analytics & Knowledge Conference (LAK17). Vancouver, BC:80-89.
[51]Minematsu, T., Tamura, K., & Shimada, A. et al. (2019). Analytics of Reading Patterns Based on Eye Movements in an e-Learning System[C]// Proceedings of the Society for Information Technology & Teacher Education International Conference.Waynesville,NC:1054-1059.
[52]Moher, D., Liberati, A., & Tetzlaff, J. et al. (2009). Preferred Reporting Items for Systematic Reviews and Meta-Analyses: The PRISMA Statement[J]. Open Medicine,3(2):123-130.
[53]Monkaresi, H., Bosch, N., & Calvo, R. A. et al. (2017). Automated Detection of Engagement Using Video-Based Estimation of Facial Expressions and Heart Rate[J]. IEEE Transactions on Affective Computing, 8(1):5-8.
[54]Mu, S., Cui, M., & Wang, X. J. et al. (2018). Learners Attention Preferences and Learning Paths on Online Learning Content: An Empirical Study Based on Eye Movement[C]// Proceedings of the 2018 Seventh International Conference of Educational Innovation Through Technology (EITT). New Zealand, Auckland:32-35.
[55]Mu, S., Cui, M., & Wang, X. J. et al. (2019). Learners Attention Preferences of Information in Online Learning: An Empirical Study Based on Eye-Tracking[J]. Interactive Technology and Smart Education,16(3):186-203.
[56]Munshi, A., & Biswas, G. (2019). Personalization in OELEs: Developing a Data-Driven Framework to Model and Scaffold SRL Processes[M]// Isotani, S., Millán, E., & Ogan, A. et al. (Eds.). Artificial Intelligence in Education. Switzerland, Cham: Springer International Publishing:354-358.
[57]Noel, R., Riquelme, F., & Lean, R. M. et al. (2018). Exploring Collaborative Writing of User Stories with Multimodal Learning Analytics: A Case Study on a Software Engineering Course[J]. IEEE Access.
[58]Okada, M., Kuroki, Y., & Tada, M. (2020). Multimodal Analytics to Understand Self-regulation Process of Cognitive and Behavioral Strategies in Real-world Learning[J]. IEICE Transactions on Information and Systems, E103.D(5):1039-1054.
[59]Ou, L., Andrade, A., & Alberto, R. et al. (2020). Using a Cluster-Based Regime-Switching Dynamic Model to Understand Embodied Mathematical Learning[C]// Proceedings of the Tenth International Conference on Learning Analytics & Knowledge. Germany, Frankfurt:496-501.
[60]Oviatt, S. (2018). Ten Opportunities and Challenges for Advancing Student-Centered Multimodal Learning Analytics[C]// Proceedings of the 20th ACM International Conference on Multimodal Interaction. Boulder, CO:87-94.
[61]Oviatt, S., Hang, K., & Zhou, J. et al. (2018). Dynamic Handwriting Signal Features Predict Domain Expertise[J]. ACM Transactions on Interactive Intelligent Systems, 8(3):1-21.
[62]Paredes, Y. V., Azcona, D., & Hsiao, I.-H. et al. (2018). Learning by Reviewing Paper-Based Programming Assessments[C]// Pammer-Schindler, V., Pérez-Sanagustín, M., & Drachsler, H. et al. (Eds.). Proceedings of the Lifelong Technology-Enhanced Learning. Switzerland, Cham: Springer International Publishing:510-523.
[63]Pham, P., & Wang, J. (2018). Predicting Learners Emotions in Mobile MOOC Learning via a Multimodal Intelligent Tutor[C]// Nkambou, R., Azevedo, R., & Vassileva, J. (Eds.). Proceedings of the Intelligent Tutoring Systems. Switzerland, Cham: Springer International Publishing:150-159.
[64]Pijeira-Díaz, H. J., Drachsler, H., & Kirschner, P. A. et al. (2018). Profiling Sympathetic Arousal in a Physics Course: How Active Are Students?[J]. Journal of Computer Assisted Learning,34(4):397-408.
[65]Paans, C., Molenaar, I., & Segers, E. et al. (2019). Temporal Variation in Childrens Self-Regulated Hypermedia Learning[J]. Computers in Human Behavior, 96:246-258.
[66]Praharaj, S., Scheffel, M., & Drachsler, H. et al. (2019). Group Coach for Co-located Collaboration[C]// Proceedings of the Transforming Learning with Meaningful Technologies. Netherlands, Delft:732-736.
[67]Prieto, L. P., Sharma, K., & Kidzinski, ?. et al. (2018). Multimodal Teaching Analytics: Automated Extraction of Orchestration Graphs from Wearable Sensor Data[J]. Journal of Computer Assisted Learning,34(2):193-203.
[68]Reilly, J. M., & Schneider, B. (2019). Predicting the Quality of Collaborative Problem Solving Through Linguistic Analysis of Discourse[C]// Proceedings of the 12th International Conference on Educational Data Mining (EDM 2019). Montréal, QC:149-157.
[69]Reilly, J. M., Ravenell, M., & Schneider, B. (2018). Exploring Collaboration Using Motion Sensors and Multi-Modal Learning Analytics[C]// Proceedings of the 11th International Conference on Educational Data Mining (EDM 2018). Buffalo, NY.
[70]Romano, G., Schneider, J., & Drachsler, H. (2019). Dancing Salsa with Machines-Filling the Gap of Dancing Learning Solutions[J]. Sensors, 19(17):3661.
[71]Rosen, D., Palatnik, A., & Abrahamson, D. (2018). A Better Story: An Embodied-Design Argument for Generic Manipulatives[M]// Calder, N., Larkin, K., & Sinclair, N. (Eds.). Using Mobile Technologies in the Teaching and Learning of Mathematics. Switzerland, Cham: Springer International Publishing:189-211.
[72]Samuelsen, J., Chen, W., & Wasson, B. (2019). Integrating Multiple Data Sources for Learning Analytics - Review of Literature[J]. Research and Practice in Technology Enhanced Learning, 14(1):11.
[73]Schneider, B., Dich, Y., & Radu, I. (2020). Unpacking the Relationship Between Existing and New Measures of Physiological Synchrony and Collaborative Learning: A Mixed Methods Study[J]. International Journal of Computer-Supported Collaborative Learning, 15(1):89-113.
[74]Schneider, B., Sharma, K., & Cuendet, S. et al. (2018). Leveraging Mobile Eye-Trackers to Capture Joint Visual Attention in Co-located Collaborative Learning Groups[J]. International Journal of Computer-Supported Collaborative Learning, 13(3):241-261.
[75]Schneider, J., Romano, G., & Drachsler, H. (2019). Beyond Reality - Extending a Presentation Trainer with an Immersive VR Module[J]. Sensors, 19(16):3457.
[76]Schwendimann, B. A., Rodríguez-Triana, M. J., & Vozniuk, A. et al. (2017). Perceiving Learning at a Glance: A Systematic Literature Review of Learning Dashboard Research[J]. IEEE Transactions on Learning Technologies, 10(1):30-41.
[77]Sharma, K., Papamitsiou, Z., & Giannakos, M. (2019). Building Pipelines for Educational Data Using AI and Multimodal Analytics: A “Grey-Box” Approach[J]. British Journal of Educational Technology, 50(6):3004-3031.
[78]Sommer, S., Hinojosa, L., & Traut, H. et al. (2017). Integrating Eye-Tracking Activities Into a Learning Environment to Promote Collaborative Meta-Semiotic Reflection and Discourse[C]// Proceedings of the 12th International Conference on Computer Supported Collaborative Learning. Philadelphia, PA:1-4.
[79]Spikol, D., Ruffaldi, E., & Dabisias, G. et al. (2018). Supervised Machine Learning in Multimodal Learning Analytics for Estimating Success in Project-Based Learning[J]. Journal of Computer Assisted Learning, 34(4):366-377.
[80]Sriramulu, A., Lin, J., & Oviatt, S. (2019). Dynamic Adaptive Gesturing Predicts Domain Expertise in Mathematics[C]// Proceedings of the 2019 International Conference on Multimodal Interaction (ICMI19). China, Suzhou:105-113.
[81]Montero, C. S., & Suhonen, J. (2014). Emotion Analysis Meets Learning Analytics: Online Learner Profiling Beyond Numerical Data[C]// Proceedings of the 14th Koli Calling International Conference on Computing Education Research. Koli, Finland:165-169.
[82]Tamura, K., Lu, M., & Konomi, S. et al. (2019). Integrating Multimodal Learning Analytics and Inclusive Learning Support Systems for People of All Ages[C]// Proceedings of the Cross-Cultural Design. Orlando, FL: 469-481.
[83]Thomas, C. (2018). Multimodal Teaching and Learning Analytics for Classroom and Online Educational Settings[C]// Proceedings of the 20th ACM International Conference on Multimodal Interaction. Boulder, CO:542-545.
[84]Tzirakis, P., Trigeorgis, G., & Nicolaou, M. A. et al. (2017). End-to-End Multimodal Emotion Recognition Using Deep Neural Networks[J]. IEEE Journal of Selected Topics in Signal Processing,11(8):1301-1309.
[85]Vrzakova, H., Amon, M. J., & Stewart, A. et al. (2020). Focused or Stuck Together: Multimodal Patterns Reveal Triads Performance in Collaborative Problem Solving[C]// Proceedings of the Tenth International Conference on Learning Analytics & Knowledge. Germany,Frankfurt:295-304.
[86]Watanabe, E., Ozeki, T., & Kohama, T. (2018). Analysis of Interactions Between Lecturers and Students[C]// Proceedings of the 8th International Conference on Learning Analytics and Knowledge (LAK18). Australia, Sydney:370-374.
[87]Worsley, M. (2018). Multimodal Learning Analytics Past, Present, and Potential Futures[C]// Proceedings of the 8th International Conference on Learning Analytics & Knowledge (LAK18). Australia, Sydney.
[88]Worsley, M., & Blikstein, P. (2018). A Multimodal Analysis of Making[J]. International Journal of Artificial Intelligence in Education, 28(3):385-419.
[89]Yin, Z., Zhao, M., & Wang, Y. et al. (2017). Recognition of Emotions Using Multimodal Physiological Signals and an Ensemble Deep Learning Model[J]. Computer Methods & Programs in Biomedicine, 140:93-10.
[90]Zaletelj, J., & Ko?ir, A. (2017). Predicting Students Attention in the Classroom from Kinect Facial and Body Features[J]. EURASIP Journal on Image and Video Processing, 2017:80.
[91]Zheng, W. L., Liu, W., & Lu, Y. et al. (2019). EmotionMeter: A Multimodal Framework for Recognizing Human Emotions[J]. IEEE Transactions on Cybernetics, 49(3):1110-1122.
收稿日期 2020-11-20 責任编辑 刘选
Data Fusion Method in Multimodal Learning Analytics: From a Panoramic Perspective
MU Su, CUI Meng, HUANG Xiaodi
Abstract: Multimodal data analysis helps us to understand the learning processes accurately. This paper systematically surveyed 312 articles in English and 51 articles in Chinese on multimodal data analysis and the findings show as follows. The analysis stages are collecting multimodal data in the learning process, converting multimodal data into learning indicators, and applying learning indicators to teaching and learning. High-frequency, fine-grained and micro-level multidimensional data in the learning processes are available, convenient and accurate, including digital data, physical data, physiological data, psychometric data and environment data. The learning indicators include behavior, cognition, emotion, collaboration and so on. The corresponding relationships between learning data and learning indicators are classified into one-to-one, one-to-many, and many-to-one. The complex relationship between learning data and learning indicators is the premise of data fusion. When measuring a learning indicator, two issues need to be considered: which type of data is the most effective one in measuring the indicator and whether there are any other types of data that contribute to more accurate measurements. Aligning the timeline of multimodal data is the key to data integration. In a word, the main characteristics of multimodal data analysis are characterized as multimodality of learning data, multi-dimension of learning indicators and diversity of analysis methods. Comprehensive consideration of the three-dimensional characteristics to improve the accuracy of analysis results is the direction of future research on multimodal data integration.
Keywords: Multimodal Learning Analytics; Types of Data; Learning Indicators; Data Fusion; Systematic Review