Performance Analysis of Cushioned Sport Soles with Plantar Pressure Test
2020-06-04LIJingYUHaibin于海滨CUILina崔丽娜ZHANGRuiQIUYiping邱夷平
LI Jing(李 静), YU Haibin(于海滨), CUI Lina(崔丽娜), ZHANG Rui(张 锐), QIU Yiping(邱夷平), 3*
1 College of Textiles and Apparel, Quanzhou Normal University, Quanzhou 362000, China 2 School of Physical Education, Quanzhou Normal University, Quanzhou 362000, China 3 Department of High-Tech Textiles, College of Textiles, Donghua University, Shanghai 201620, China
Abstract: Plantar pressure distribution of the designed cushioned soles was studied and compared with that of the commercially available sport shoes. A three-dimensional motion measurement system was used to obtain the peak plantar force, the peak plantar pressure, force-time integrals and pressure-time integrals, and one-way analysis of variance was used to analyze the performance of the designed cushioned shoes. The results revealed that in normal walking and jogging states, compared with the commercially available sport shoes, the peak plantar pressure in the heel region decreased by 13.65% and 6.05%, respectively. The peak plantar force decreased by 15.98% and 15.32%, respectively. The force-time integral decreased by 4.36% and 6.83%, respectively, and the pressure-time integral decreased by 10.58% and 11.00%, respectively. In conclusion, the cushioning performance of shoes is related to the exercise mode. For normal walking, the designed cushioned soles absorbed greater impact in the heel region, which was effectively cushioned, whereas in the jogging state, the designed cushioned soles exhibited a favorable cushioning effect in the forefoot region. The designed cushioned soles exhibited cushioning performance through the coupling design of material and structure, which effectively reduced impact force when landing and could optimize plantar pressure distribution.
Key words: bionic structure midsole; plantar pressure distribution; peak plantar
Introduction
Plantar pressure measurement is effective on the study of plantar pressure distribution[1]. Plantar pressure measurement during different kinds of sports, can assist in sport shoes design for more comfortable and functional shoes[2]. As a medium between the ground and human feet, the sole has a three-layer structure, namely the insole, the midsole[3-4], and the outsole. The material and the structure of midsoles are critical to cushioning performance. Improving midsole cushioning performance[2, 5]is a popular topic for sport shoes. The sole structure and the material of sport shoes affect the pressure distribution during walking and running[6].
At present, most cushioning performance of sport shoes is evaluated through the impact force on the soles[7-9]. However, it cannot accurately simulate the entire action of feet on the ground during exercise. Moreover, studies on the cushioning performance of sport shoes have mainly focused on the entire foot[10]. Few studies have emphasized the regions where strong cushioning is needed, such as the forefoot and the heel.
In this study, plantar pressure distributions on the forefoot and the heel in normal walking and jogging states were analyzed for designed shoes with a bionic design cushioning midsole and control shoes with a normal midsole to test whether peak plantar pressures, peak plantar forces, pressure-time integrals, and force-time integrals were optimized.
1 Experiments
1.1 Experimental shoes
The designed shoes tested in this study had cushioning midsoles with a bionic ostrich foot structure and texture[11], and won the footwear group award of 2018 “Channel Cup” Industrial Design Contest. Commercial shoes from a well-known listed company were used as control samples. For both designed shoes and control shoes, the outsoles are non-slip rubber, and the midsoles are made of ethylene-vinyl acetate(EVA) copolymer. The appearance and the size of the shoes are similar as shown in Fig. 1. The differences between designed shoes and control shoes are shown in Table 1.
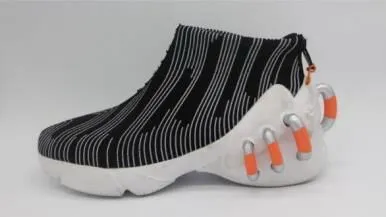
(a)
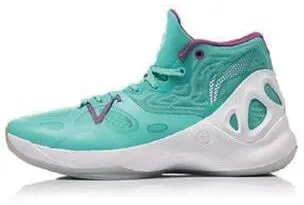
(b)Fig. 1 Appearance of shoes: (a) designed shoes;(b) control shoes

Table 1 Difference between designed shoes and control shoes
The bionic sole, as shown in Fig. 2, is composed of a bionic outsole, a bionic midsole, and an elastic annulus[12-14]. The sole has an elastic annulus, a mastoid air column on the bionic outsole, a bionic groove that enables the fitting of a column-bottom transitioning groove and the bionic midsole, and a ventilation cushioning unit composed of numerous air inlets[11].
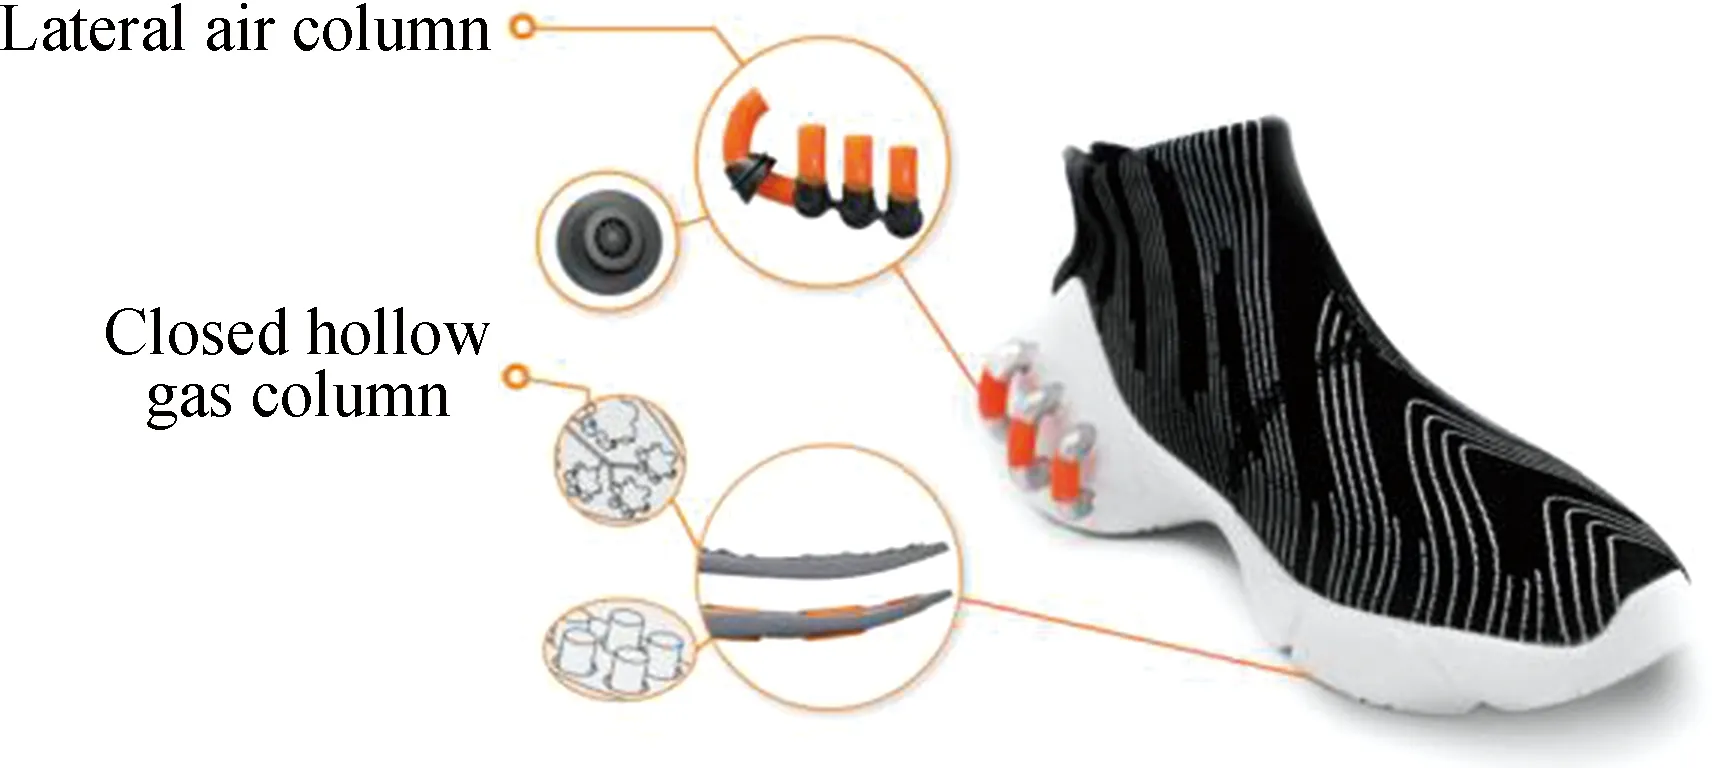
(a)
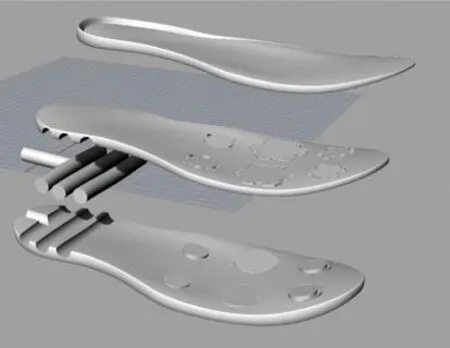
(b)Fig. 2 Designed shoes with a bionic sole structure:(a) shoe structure; (b) bionic sole structure
1.2 Experimental setup
This study used the foot-scan in-shoe plantar pressure measurement system developed by Tekscan (South Boston, MA, USA) as the main experimental equipment to collect the dynamic indices of the plantar during exercise. The measurement system has a sensor that obtains variables during human movement, including contact area, peak plantar forces, peak plantar pressures, contact time, force-time integrals, and pressure-time integrals. The variables were transmitted through the Bluetooth wireless real-time transmission system to the computer’s built-in flash memory. The data were imported into the computer for sorting and analysis after measurement.
In this study, the plantar regions were divided into four regions: the phalanges region, the forefoot region, the arch region and the heel region[15-16]. The entire plantar pressure data distribution characteristics of these four regions are displayed in Fig. 3.
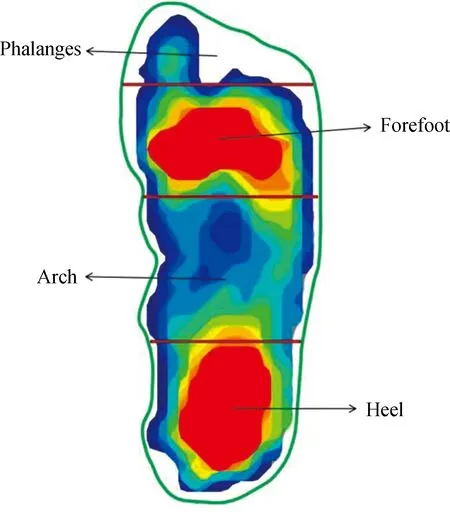
Fig. 3 Plantar region division
1.3 Experimental participants
A total of 12 male college students majoring in physical education were selected to participate in this experiment. The physical requirements for participants included normal foot types without walking obstacles or previous foot injuries, normal arches (no high arches or flatfeet) and normal body movement, perception and expressiveness. The basic information of participants is listed in Table 2, where the body mass index (BMI) is the ratio of mass in kilograms to the square of body height in meters, and the shoe size is in the European system. Mean values and standard deviations (SD) are given for the variables except the number of participants and the shoe size. The participants were trained before the experiment to ensure safety during the experiment.
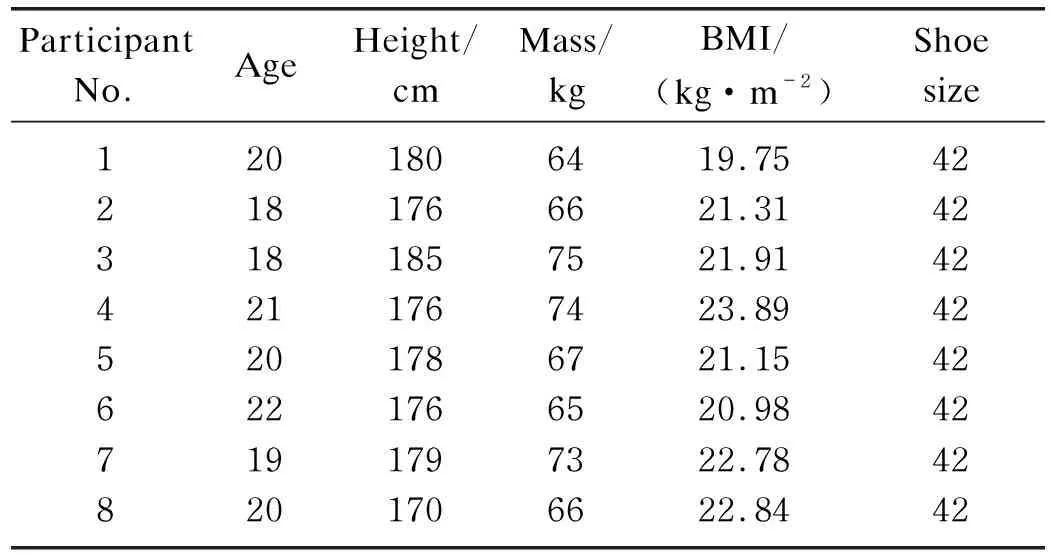
Table 2 Basic information of participants
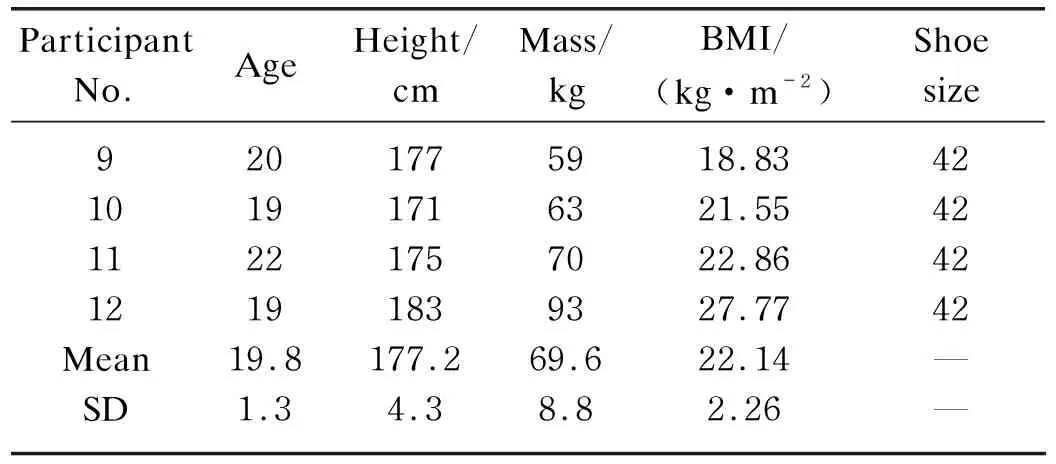
(Table 2 continued)
1.4 Experimental procedures
All participants wore both designed shoes and control shoes when performing two exercise tests (normal walking at 2 km/h and jogging at 4 km/h). An experimental insole was placed in the shoes and participants were required to tie shoe laces moderately tightly. The test indices included peak plantar pressures, peak plantar forces, force-time integrals, and pressure-time integrals. During the experiment, at least three valid data were collected for each sample. Under the same exercise conditions, the average pressure on the right foot was higher than that on the left foot (the right foot was the dominant foot), and thus the right foot was selected for data analysis.
Test procedures are as follows.
(1) Check the inner length of the shoes, create an insole, and ensure that the insole is placed flat inside the shoes without creasing, bending, and moving back and forth.
(2) Tie the insole plantar pressure measurement system to the waist of participants and connect it to the insole through a cable.
(3) Adopt a gait calibration method to calibrate left and right insole test systems.
(4) Arrange an appropriate amount of rest time before each test to ensure participants perform the test favorably in order to reduce test errors, unplug the data acquisition plug, and switch off the data acquisition system when changing shoes.
(5) Use the foot-scan measurement system to analyze and save the obtained plantar pressure data.
1. 5 Data analysis
In this study, the source data were logged according to the format required by the statistical software. Then, the information obtained from the tests was analyzed using the SPSS 21.0 software. The student’s pairedt-test was applied to all foot pressure variables (peak plantar pressures, peak plantar forces, force-time integrals and pressure-time integrals) to determine any significant difference between the designed shoes and the control ones in two states(the normal walking state and the jogging state).
2 Results
2.1 Peak plantar pressure comparison
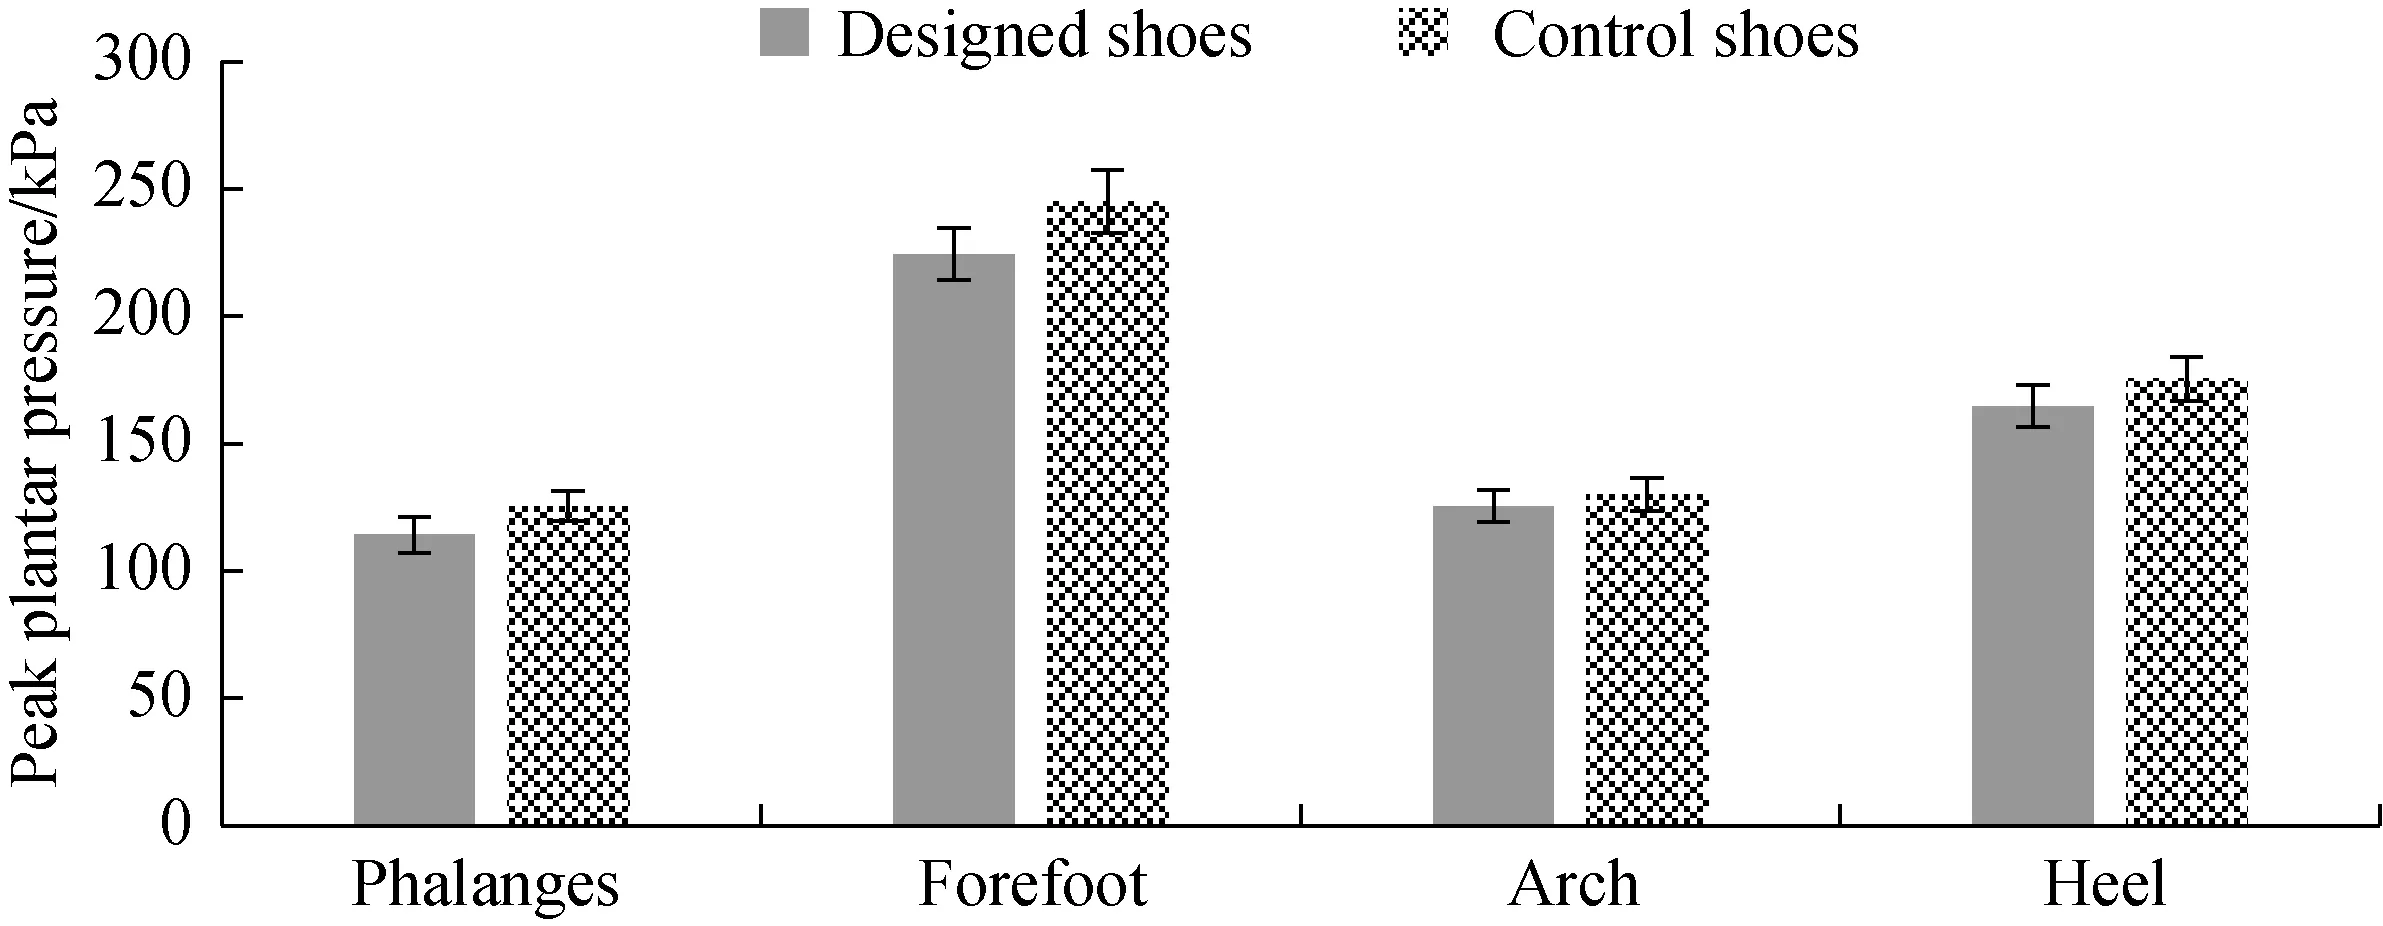
The peak plantar pressure refers to the maximum pressure experienced by each anatomical region of the sole during exercise, and reflects the stress situation of a specific part of the sole. It is an important index to measure the pressure distribution and the cushioning performance of the soles during exercise. Under the same sport conditions, better cushioned soles can reduce the peak pressure and the impact force, which is better for lower limb[15].
The peak plantar pressure was the highest in the forefoot region as displayed in Fig. 4.
(b)Fig. 4 Comparison of peak plantar pressures: (a) walking; (b) jogging
When walking, the peak plantar pressure in the forefoot region of the designed shoes decreased by 11.48% compared with that of the control shoes, and the peak pressure in the heel region of the designed shoes decreased by 13.65% compared with that of the control shoes. When jogging, the peak plantar pressure in the forefoot region of designed shoes decreased by 8.42% compared with that of the control shoes, and the peak plantar pressure in the heel region of the designed shoes decreased by 6.05% compared with that of the control shoes.
2.2 Peak plantar force comparison
Statistical analyses of the peak plantar force helped to compare the plantar force generated in each plantar region and provide a valid scientific basis for the soles. The human body has a self-regulating function, in which the instep structure is a horizontal bow forming an extremely stable triangular support together with the heel bones. The human musculoskeletal system absorbs impact forces to form a cushioning effect during exercises. Nonetheless, because the heel is connected to the main bones of the human body, it directly transmits vibration to the brain, and the shock waves generated by the excessive peak plantar force on the human body cause great damage to feet, knees, and the head[15]. The peak plantar force can be used as a crucial index for evaluating the cushioning performance of sport shoes[16-17]. The effects of different gaits and the physical stimulation differences confirm that soles designed with cushioning performance can adjust peak plantar forces when landing and prevent sport injuries[18].
According to the average peak plantar force in the four plantar regions obtained from the insole force measurement system(shown in Fig. 5), the highest peak plantar force appeared in the forefoot region, followed by the heel region. When walking, the peak plantar force in the forefoot region of the designed shoes decreased by 11.45% compared with that of the control shoes, and the peak plantar force in the heel region of the designed shoes decreased by 15.98% compared with that of the control shoes. When jogging, the peak plantar force in the forefoot region of the designed shoes decreased by 8.54% compared with that of the control shoes, and the peak plantar force in the heel region of the designed shoes decreased by 15.32% compared with that of the control shoes. In both exercise states, the peak plantar force in the forefoot and the heel regions of designed shoes was significantly lower than the control shoes.
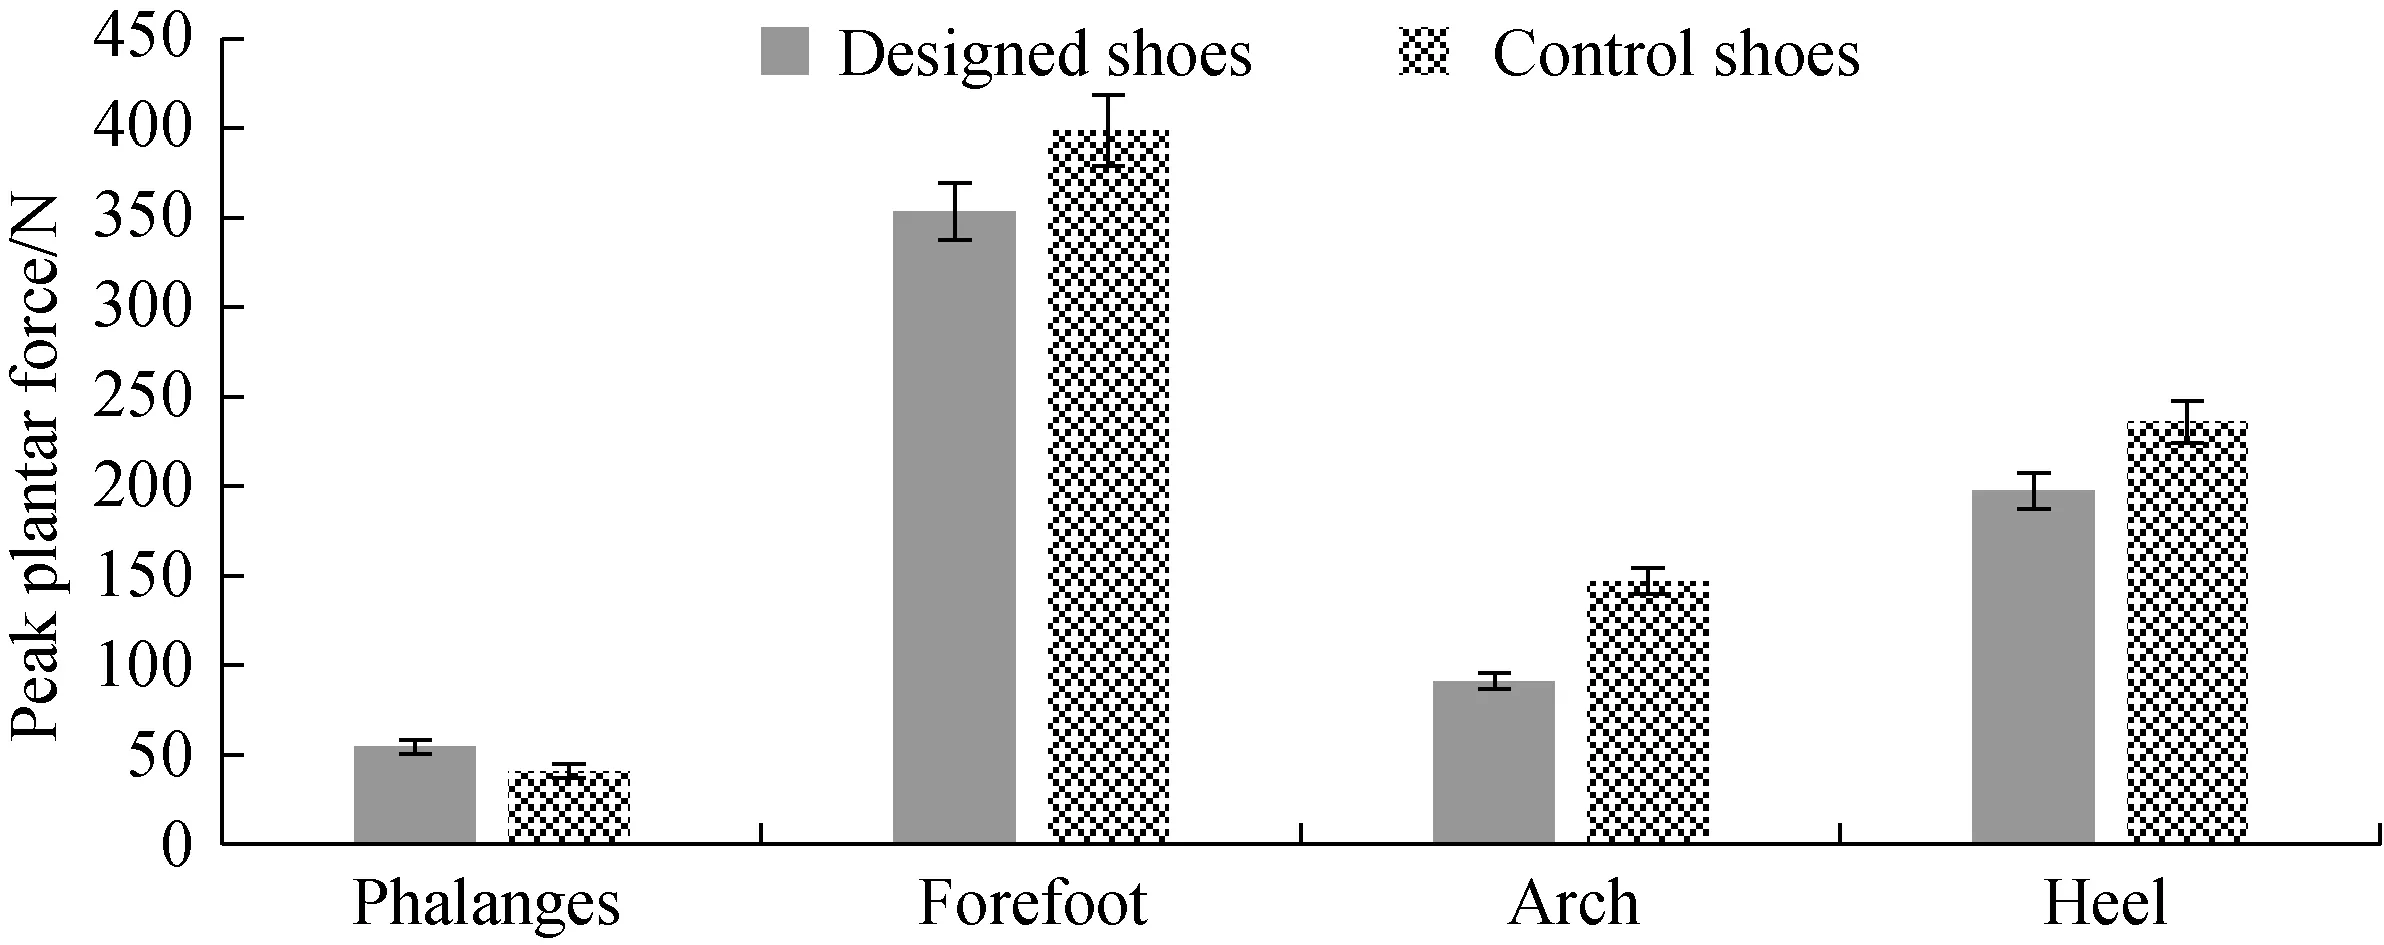
(a)
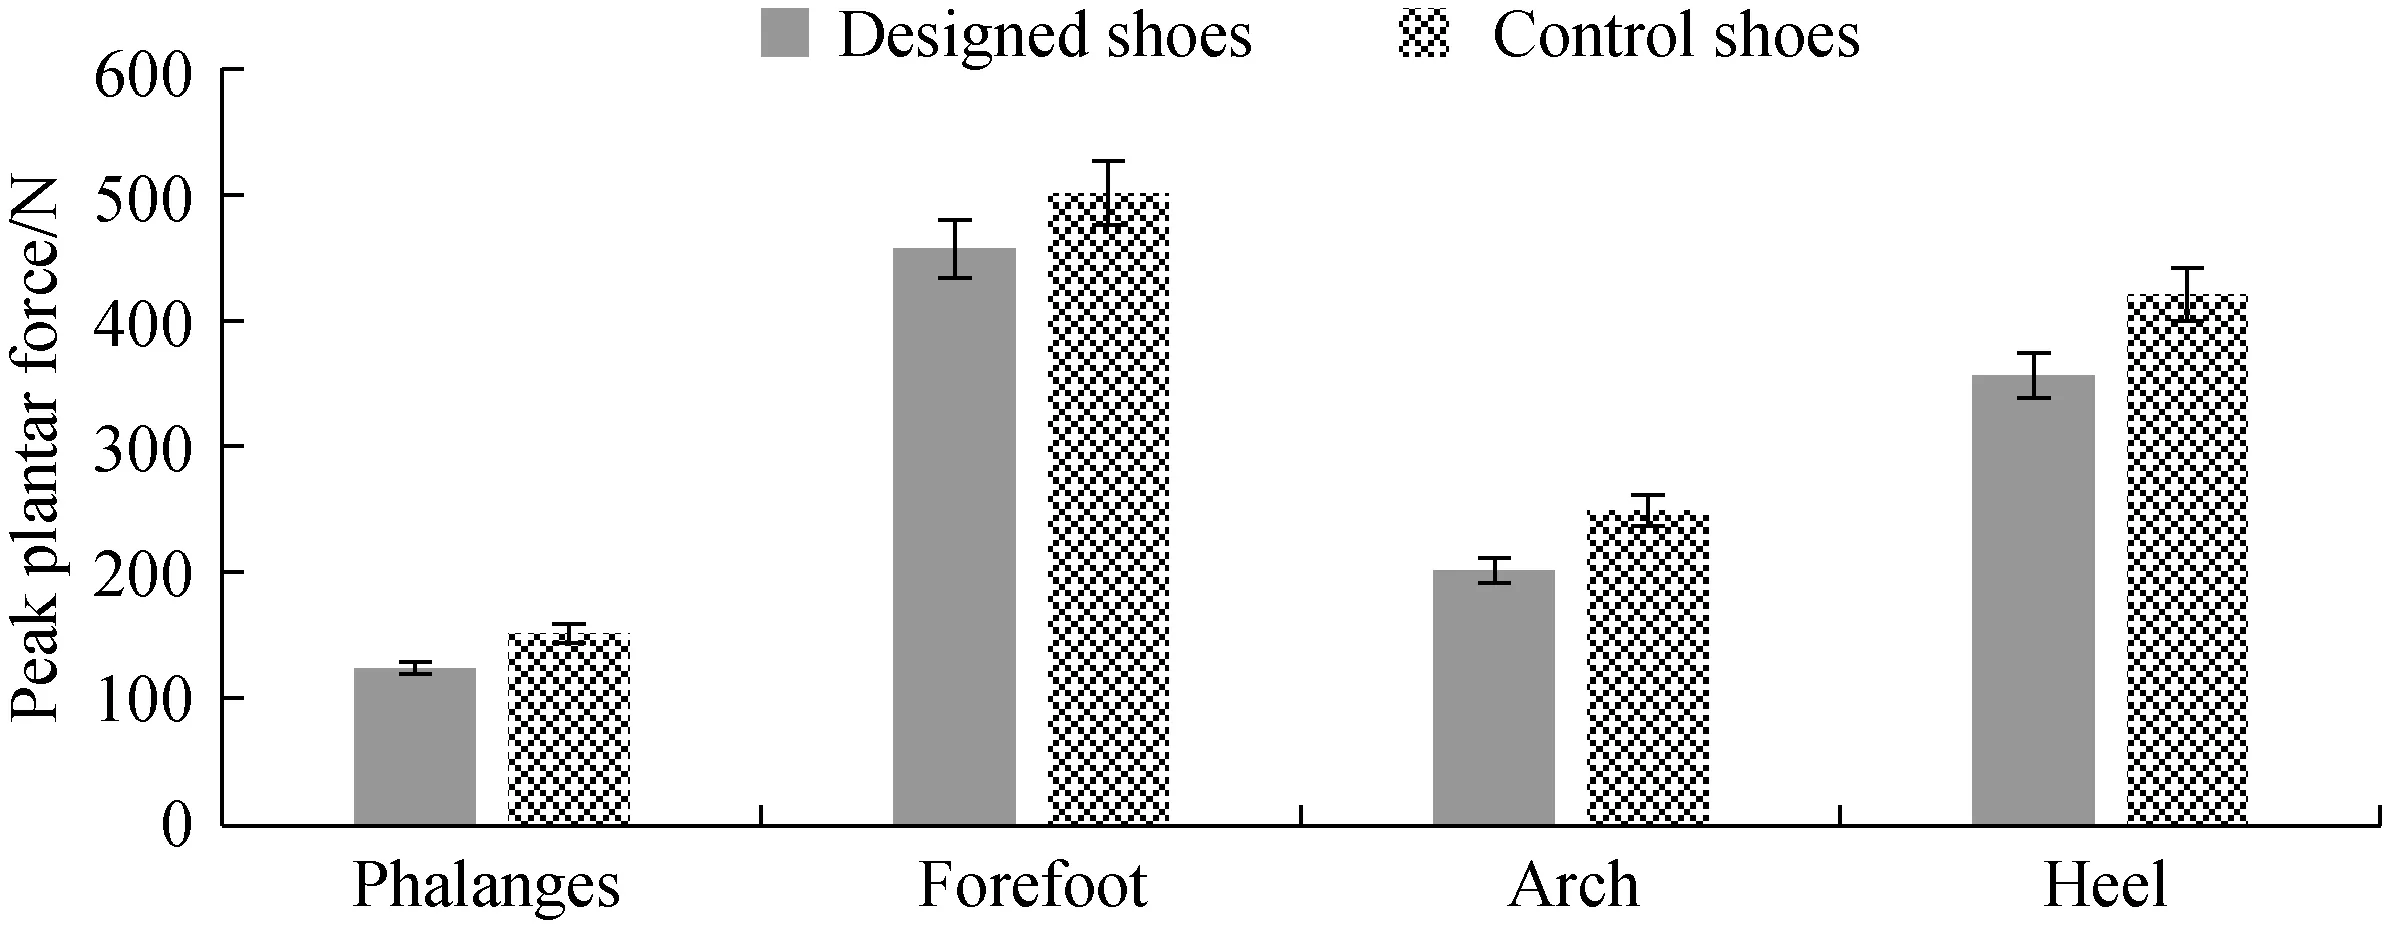
(b)Fig. 5 Comparison of peak plantar forces: (a) walking; (b) jogging
2.3 Plantar force-time integrals
The force-time integral refers to the time required when feet attach the ground to reach the peak plantar force across plantar regions. Plantar force-time integrals represent the energy that feet endure during exercise. This index can evaluate cushioning performance. Lower values of force-time integrals mean more energy saved during walking. Higher values of force-time integrals result in greater foot injury rates.
Figure 6 displays the average force-time integrals in the four regions. The results revealed that the forces were focused at the forefoot and the heel regions. When walking, the force-time integral in the forefoot region of the designed shoes decreased by 11.86% compared with that of the control shoes, and the force-time integral in the heel region of designed shoes decreased by 4.36% compared with that of the control shoes. When jogging, the force-time integral in the forefoot region of the designed shoes decreased by 7.02% compared with that of the control shoes, and that in the heel region of the designed shoes decreased by 6.83%.
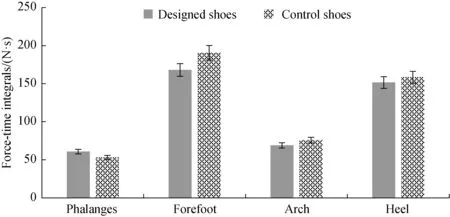
(a)

(b)Fig. 6 Comparison of force-time integrals: (a) walking; (b) jogging
2.4 Plantar pressure-time integrals
The plantar pressure-time integral is the time cumulative effect of the pressure in various plantar regions measured by all sensors, and the unit is kPa·s[19-20]. Some of the literature note that the influence of peak plantar pressures should consider the time parameter[21]. High pressure-time integrals can lead to foot structure problems or cause sport injuries[22-23]. Therefore, the plantar pressure-time integral can reveal the movement mechanism and functional characteristics of the foot.
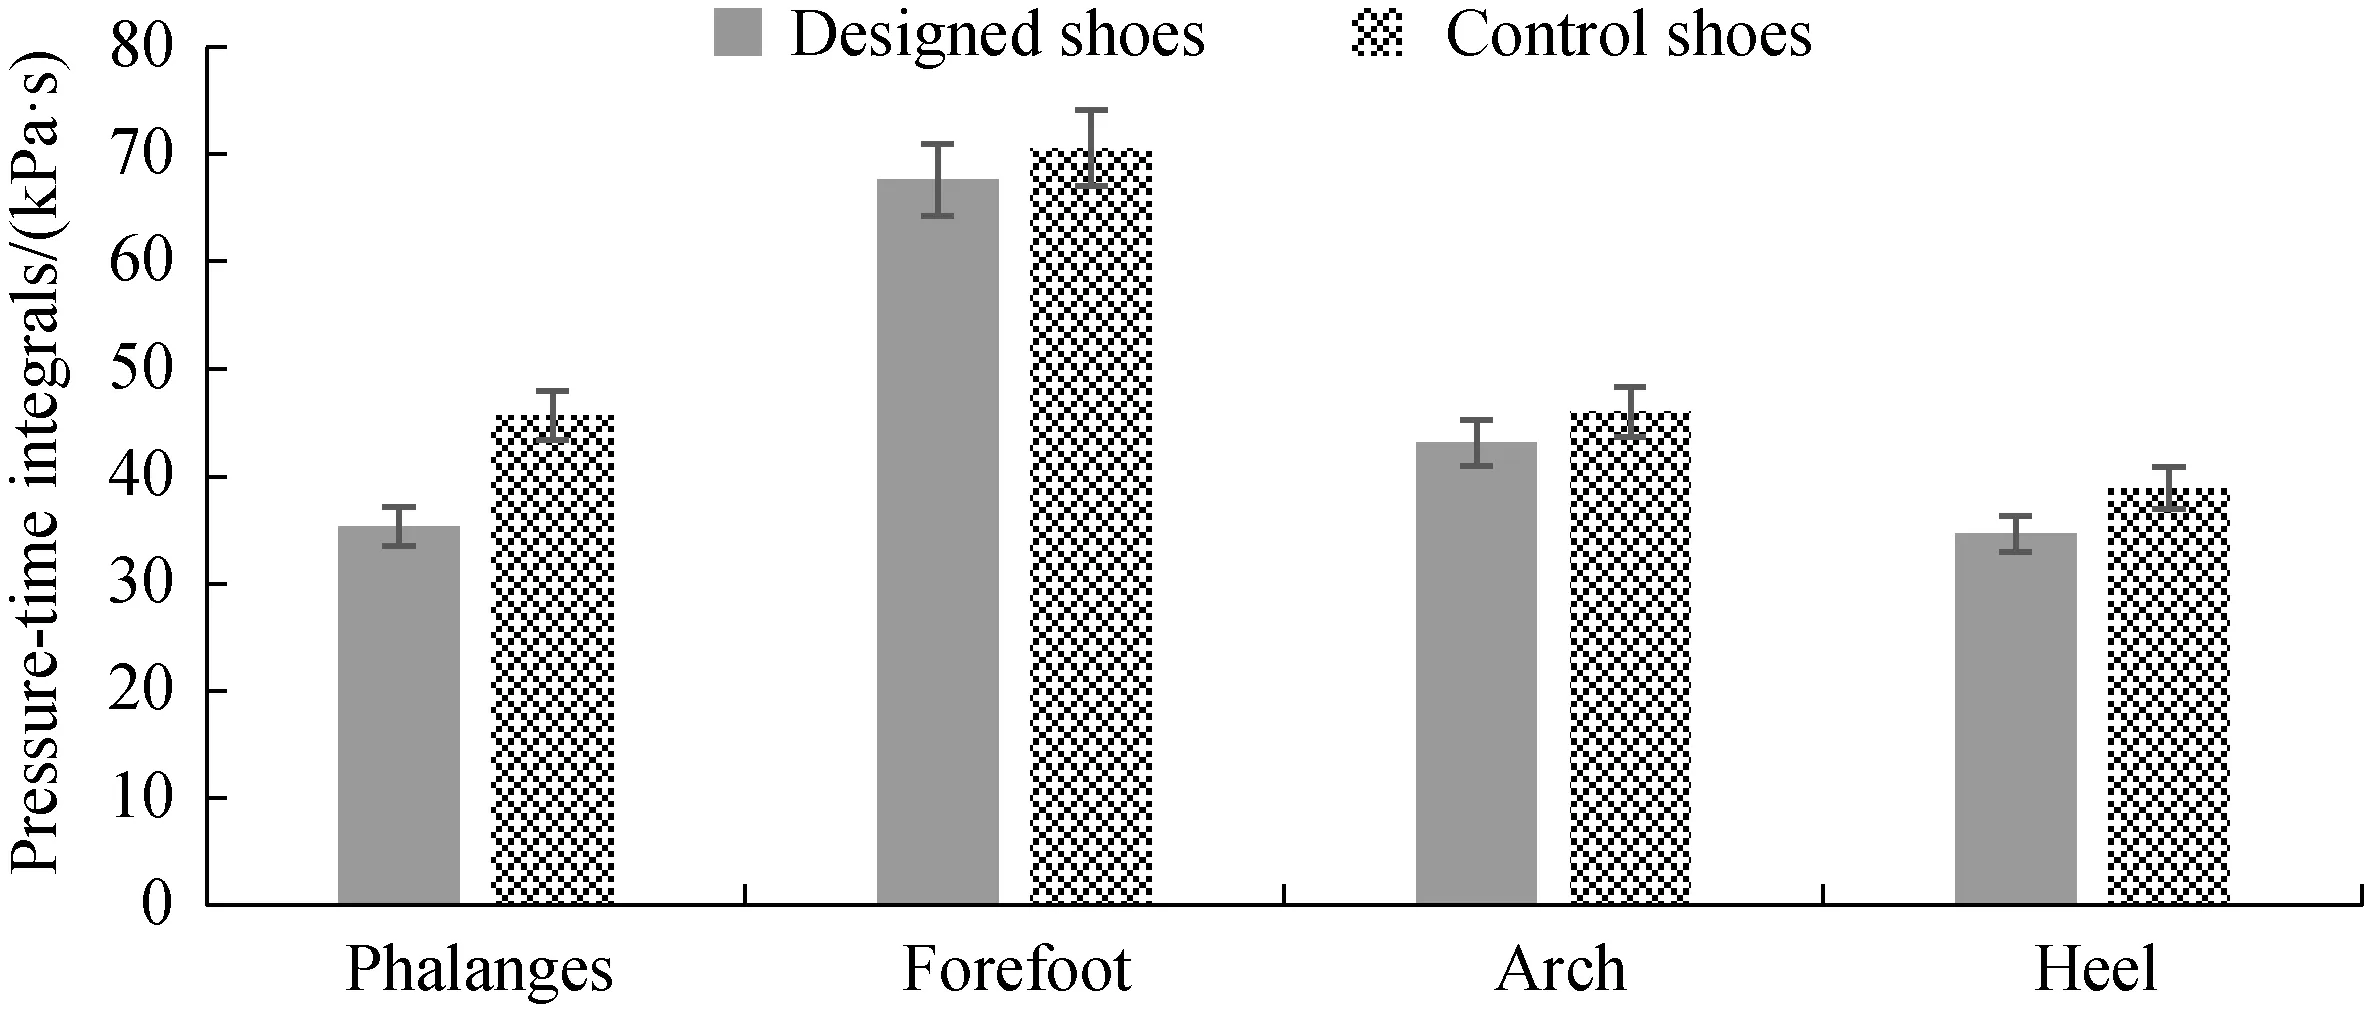
The plantar pressure-time integrals in the four plantar regions obtained from the plantar pressure measurement system are displayed in Fig. 7. When walking, plantar pressure-time integrals in the forefoot region of designed shoes decreased insignificantly by 4.19% compared with those of the control shoes, and plantar pressure-time integrals in the heel region of the designed shoes decreased by 10.58% compared with those of the control shoes. When jogging, plantar pressure-time integrals in the forefoot region of the designed shoes decreased by 4.25% compared with those of the control shoes, and plantar pressure-time integrals in the heel region of the designed shoes decreased by 11.00% compared with those of the control shoes.
The changes in pressure-time integrals in walking and jogging states were mostly consistent with those in the peak plantar pressure. Local pressure on the foot is the main cause of damage to the foot structure. In addition to considering pressure value, contact time differential effects between the plantar and ground should be measured.
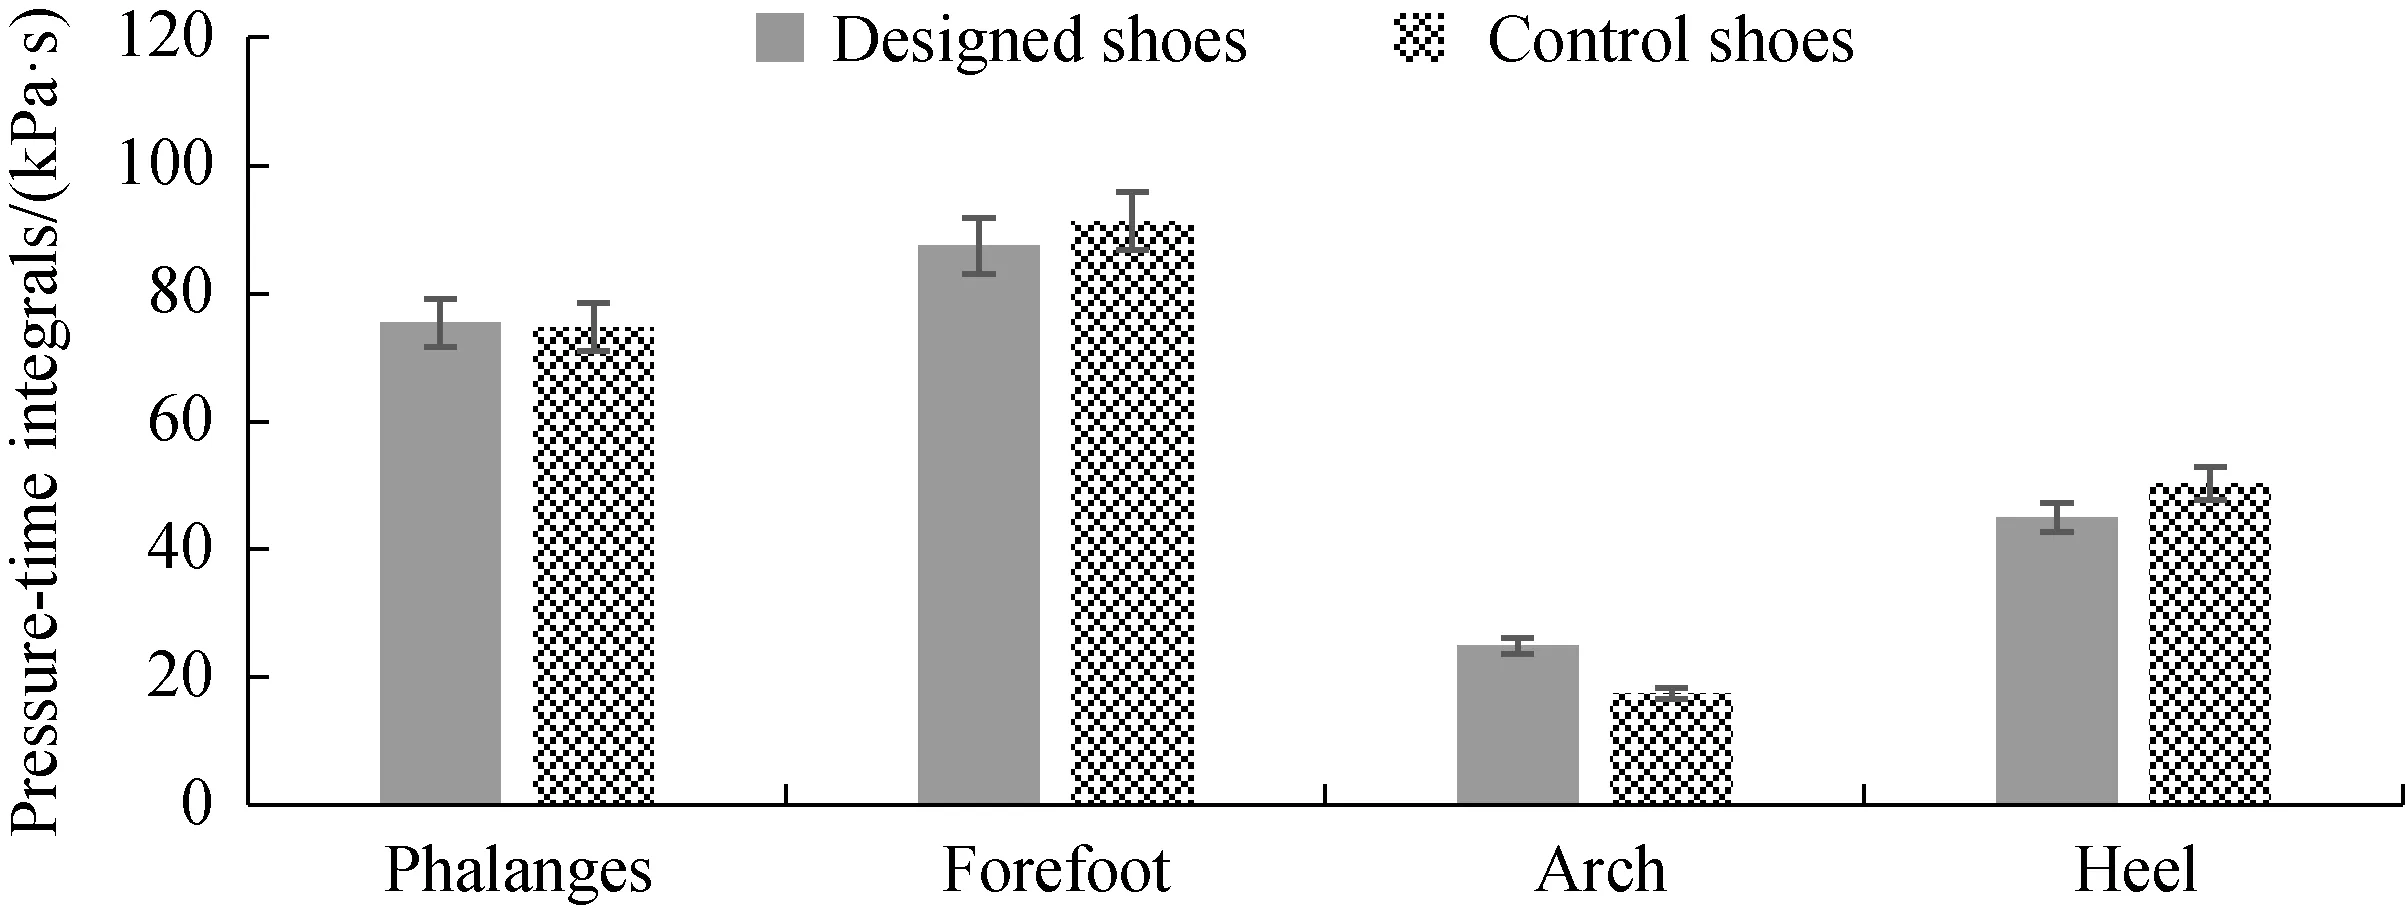
(a)
(b)Fig. 7 Comparison of pressure-time integrals: (a) walking; (b) jogging
3 Discussion
In the walking state, the arch can maintain the stiffness of the tarsus, provide power to the plantar flexion, and absorb some impact forces on the heel. The process from contacting to touching down converts kinetic energy into gravitational potential energy, and the gravitational potential energy is converted into kinetic energy when feet take off the ground. In the jogging state, the arch with an elastic structure can return some energy. Assuming that the pressure of the entire foot is taken as a whole (i.e., 100%), the percentages of pressure and force distributions of each plantar region in the entire shoes can be calculated, as presented in Table 3 and Table 4.
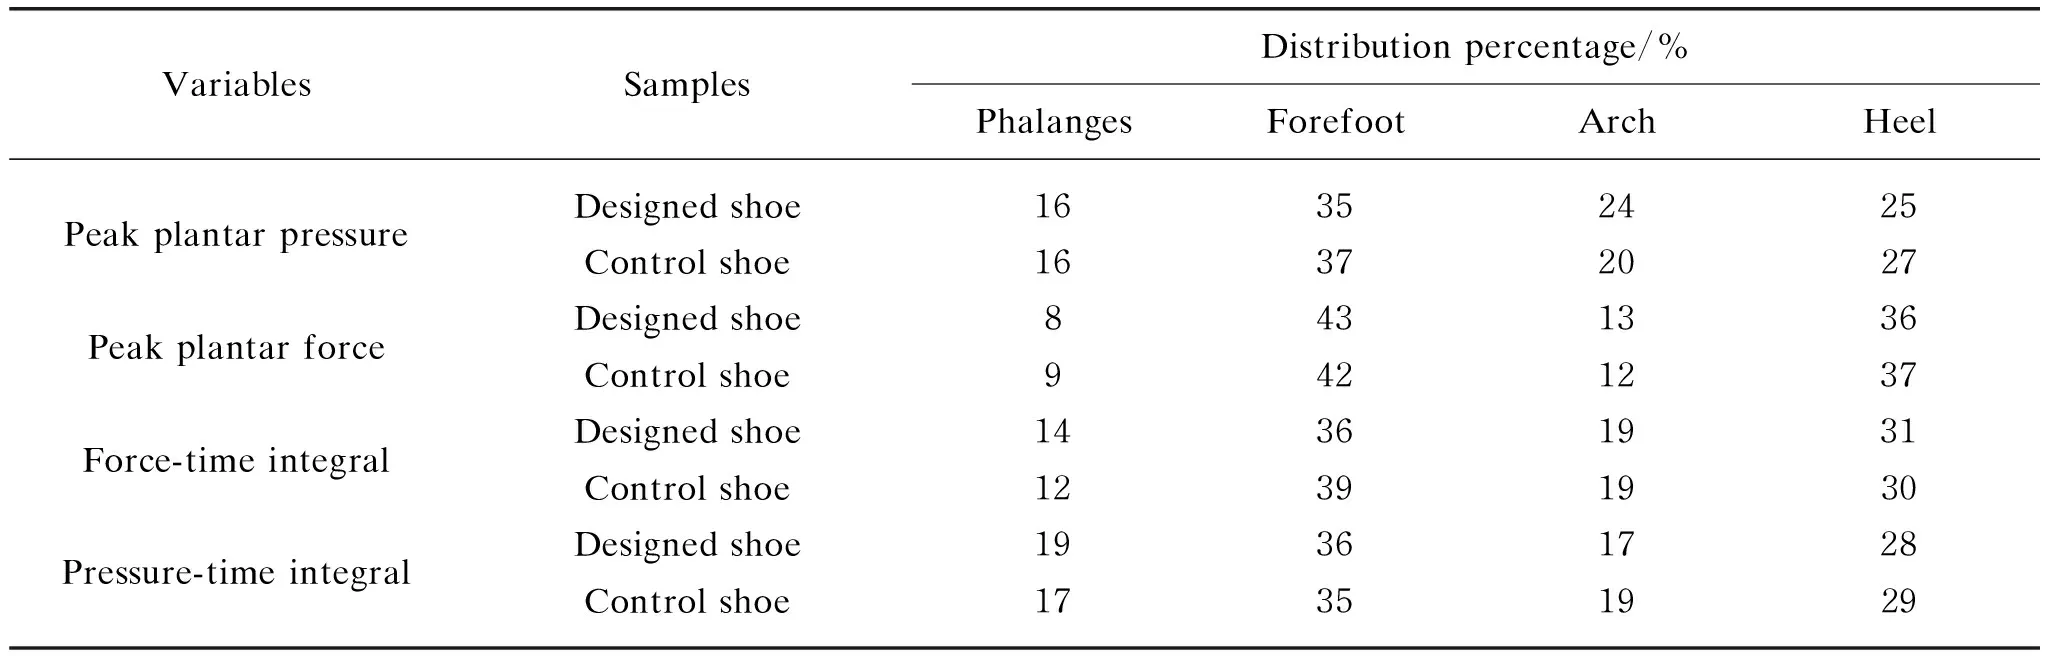
Table 3 Plantar variable distribution percentage in the entire shoe in the walking state

Table 4 Plantar variable distribution percentage in the entire shoe in the jogging state
3.1 Plantar variable distribution in the walking state
In the walking state, compared with those of the control shoes, the peak plantar pressure, the peak plantar force, the force-time integral and the pressure-time integral in the forefoot region of designed shoes were reduced by 11.48%, 11.45%, 11.86% and 4.19%, respectively. In the heel region, they were reduced by 13.65%, 15.98%, 4.36% and 10.58%, respectively.
In the walking state, although the designed shoes in the forefoot region could not optimize the proportion distribution of the peak plantar pressure, it could effectively relieve pressure in the heel region to prevent excessive local pressure and reduce the risk of injury in the lower limb, which effectively optimizes cushioning performance of the shoes.
3.2 Plantar variable distribution in the jogging state
In the jogging state, compared with those of the control shoes, the peak plantar pressure, the peak plantar force, the force-time integral and the pressure-time integral in the forefoot region of designed shoes were reduced by 8.42%, 8.54%, 7.02% and 4.25%, respectively. In the heel region, they decreased by 6.05%, 15.32 %, 6.83% and 11.00%, respectively. In the jogging state, the designed shoes could effectively optimize the proportional distributions of the peak plantar pressure and the force-time integral.
For the designed shoes, the contact area between the plantar and the ground increased, which effectively extended exercise time and prevented premature fatigue. Regarding material performance, the designed shoes optimized the plantar pressure distribution and prevented local high pressure regions better than control shoes in the jogging state. The plantar protection performance of the designed shoes was more efficient than that of control shoes, and the sole of the designed shoes had more elastic potential energy stored during walking or jogging.
4 Conclusions
The results showed that the bionic midsole could effectively reduce the local pressure in the forefoot and the heel regions. Designed shoes have excellent shock resistance. It can not only improve the comfort of the foot, but also effectively reduce the risk of foot injury during exercises. The cushioning performance of sport shoes is highly correlated with exercise modes. In the normal walking state, designed shoes absorbed greater impact force in the heel region, whereas in the jogging state, the designed shoes had a more satisfactory cushioning effect in the forefoot region. Through coupling design of material and structure, the bionic cushioned midsole of the designed shoes exhibited cushioning performance, which effectively reduced impact force when landing. This study provided a theoretical basis for subsequent researches and the development of cushioning sport shoes. In the future, the new designed bionic structure shoes with better cushioning performance will be comprehensively evaluated.
杂志排行

Journal of Donghua University(English Edition)的其它文章
- Acoustic Performance of Green Composites for Chinese Traditional Percussion Drums
- Fabrication and Characterization of Polypyrrole/Polyurethane/Polyamide/Polyamide Yarn-Based Strain Sensor
- Friction and Wear Behaviors of C/C-SiC Composites under Water Lubricated Conditions
- Existence Criterion of Three-Dimensional Regular Copper-1, 3, 5-Phenyltricarboxylate (Cu-BTC) Microparticles
- Combining User-Driven Social Marketing with System-Driven Personalized Recommendation for Student Finding
- Generative Adversarial Network with Separate Learning Rule for Image Generation