Maximum Likelihood Identification of Flow Instabilities in Cavitating Inducers*
2020-02-26
(Department of Civil&Industrial Engineering,Pisa University,8 Via Gerolamo Caruso)
Abstract:The article illustrates the application of Bayesian estimation to the identification of flow instabilities,with special reference to rotating cavitation,in a three-bladed axial inducer using the unsteady pressure readings of a single transducer mounted on the casing just behind the leading edges of the impeller blades.The typical trapezoidal pressure distribution in the blade channels is parametrized and modulated in time and space for theoretically reproducing the expected pressure generated by known forms of cavitation instabilities(cavitation auto-oscillations and higher-order surge cavitation modes,n-lobed subsynchronous/synchronous/super-synchronous rotating cavitation).The Fourier spectra of the theoretical pressure so obtained in the rotating frame are transformed in the stationary frame,frequency broadened to better approximate the experimental results,and parametrically fitted by maximum likelihood estimation to the measured auto-correlation spectra. Each form of instability generates a characteristic distribution of sidebands in addition to its fundamental frequency.The identification makes use of this information for effective detection and characterization of multiple simultaneous flow instabilities with intensities spanning over about 20 db down to about 4 db signal-to-noise ratios.The same information also allows for effectively bypassing the aliasing limitations of traditional cross-correlation methods in the discrimination of multiple-lobed azimuthal instabilities from the measurements returned by arrays of equally spaced sensors.The method returns both the estimates of the model parameters and their standard deviations,providing the information needed for the assessment of the statistical significance of the results.The proposed approach represents therefore a promising tool for experimental research on flow instabilities in high-performance turbopumps.
Keywords:Rocket Propulsion,Liquid Propellant Rocket Engines,Turbomachinery,Turbopumps,Turbopump Cavitation Instabilities,Parametric Identification.
Nomenclature
avector of parametersa1,a2,...aR
NBnumber of blades
NRCnumber of rotating cavitation lobes
p,ptstatic and total pressures
Ppressure oscillation amplitude
p1,pVinlet and vapor pressures
rcorrelation coefficient
rTtip radius
ttime
Ttemperature,period
Sexp(ω)experimental pressure autocorrelation spectrum
Sth(ω)theoretical pressure autocorrelation spectrum
δdelta-function
Δpttotal pressure rise
εerror
ϑ,ϑ′absolute and relative azimuthal coordinates
ρflow density,correlation coefficient
σstandard deviation,cavitation no.,
Φflow coefficient,
Ψhead coefficient,
χ2figure-of-merit of the maximum likelihood estimation
ωangular frequency
Ωrotational speed
ΩSinducer specific speed,
Subscripts
BPblade passage
RCrotating cavitation
ref reference value
SCsurge cavitation
Tblade tip
0 Introduction
Cavitation represents the main fluid dynamic phenomenon limiting the power density of hydraulic turbomachinery.For this reason,in the quest for optimum weight efficiency,liquid-propellant rocket engine turbopumps are usually designed for operation under partial cavitation conditions and are therefore subject to the onset of cavitation-induced flow instabilities(Bhattacharyya et al.,1997[1];Natanzon et al.,1974[18];Kamjio et al.,1977[13];Hashimoto et al.,1997a,1997b[10];Shimura et al.,2002,2003[26][20];Tsujimoto et al.,1997[29];Coutier-Delgosha et al.,2012[4];Brennen,2012[2];d’Agostino,2013[5];Pace et al.,2015[20];Lettieri et al.,2017[15]).Historically,cavitation-auto-oscillations,partial cavitation instabilities,sub/super-synchronous rotating cavitation and,more recently,higher-order surge and rotating cavitation modes have been recognized as the origin of potentially catastrophic failures,ranging from the onset of fluid/structure POGO oscillations of the propulsion system(Rubin,1966[25];Oppenheim and Rubin 1993[19],Larsen,2008[14];Hori and Brennen,2011[12]),to the dynamic excitation of the impeller blades and the rotor shaft(Bhattacharyya et al.,1997[1];Goirand et al.,1992[9];Pasini et al.,2011[23]),and finally to the development of coupled blade flutter/cavitation oscillations(NASDA2000a,2000b)[16-17].
Effective identification,discrimination,and characterization of unsteady cavitation phenomena is therefore a crucial aspect in the development of high-performance liquid propellant rocket propulsion systems for space applications and represents the main focus of the present work.Spectral analysis of the unsteady flow pressure measured in the stationary(laboratory)or,more recently,in the rotating(impeller)frames have traditionally been used for this purpose(Tsujimoto,2006;Pace et al.,2017,2019)[30,21-22].However,visual interpretation of the measured pressure spectra according to this approach is primarily based on consideration of what appears to be the fundamental frequencies of the flow oscillations.It becomes therefore increasingly difficult and uncertain when multiple instabilities are simultaneously present with different intensities and significant side-bands,especially in measurements with low signal-to-noise ratios.
The present activity aims at demonstrating the possibility of effectively using maximum likelihood identification to reduce the impact of these limitations by improving the dynamic range and resolution of the spectral analysis of flow instabilities and eliminating its dependence on the subjective interpretation by the observer.The prediction of the power spectra of surge and rotating cavitation instabilities yields the following distinct advantages:
1)Provides the information needed for improving the visual interpretation of the pressure spectra from characterization experiments of cavitating inducers and,in particular,for eliminating the possibility of misinterpreting relatively intense side-bands of already identified phenomena as additional distinct instabilities;
2)Provides a very powerful means for effectively detecting and discriminating different flow oscillation modes even in measurements with relatively low signal-to-noise ratio;
3)Opens the possibility of characterizing the nature,spatial structure,and rotational speed of multi-lobed azimuthal flow instabilities using just one single sensor and eliminating the need to cross-correlate the signals from multiple transducers for dealing with aliasing limitations,thus significantly simplifying the acquisition and reduction of the experimental data.
Specifically,this article illustrates the results of the application of maximum likelihood estimation to the systematic discrimination of the various forms of cavitation instabilities occurring in inducers and turbopumps from the unsteady pressure readings measured on the impeller casing just downstream of the leading edges.The typical trapezoidal pressure distribution in the blade channels is parametrized and modulated in time and space for modeling the expected pressure generated by known forms of cavitation instabilities(cavitation auto-oscillations,n-lobed rotating cavitation,higher-order surge/rotating cavitation modes).The discrete Fourier spectrum so obtained in the rotating frame is transformed in the stationary frame and filtered to account for frequency broadening effects.Following the classical maximum likelihood approach with Gaussian errors,the predicted auto-correlation of the flow pressure is fitted to the measurements by minimizing its quadratic deviation from the experimental results.The identification makes use of the information provided by both the fundamental frequency of each instability as well as its side-band spectrum,allowing for increased sensitivity and resolution of multiple simultaneous unsteady flow phenomena.The method returns the estimates of the model parameters as well as their standard errors,which provide the necessary information for effective diagnostic identification and characterization of the instabilities and quantitative assessment of the statistical significance and accuracy of the results.
1 Experimental Apparatus and Procedure
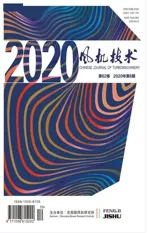
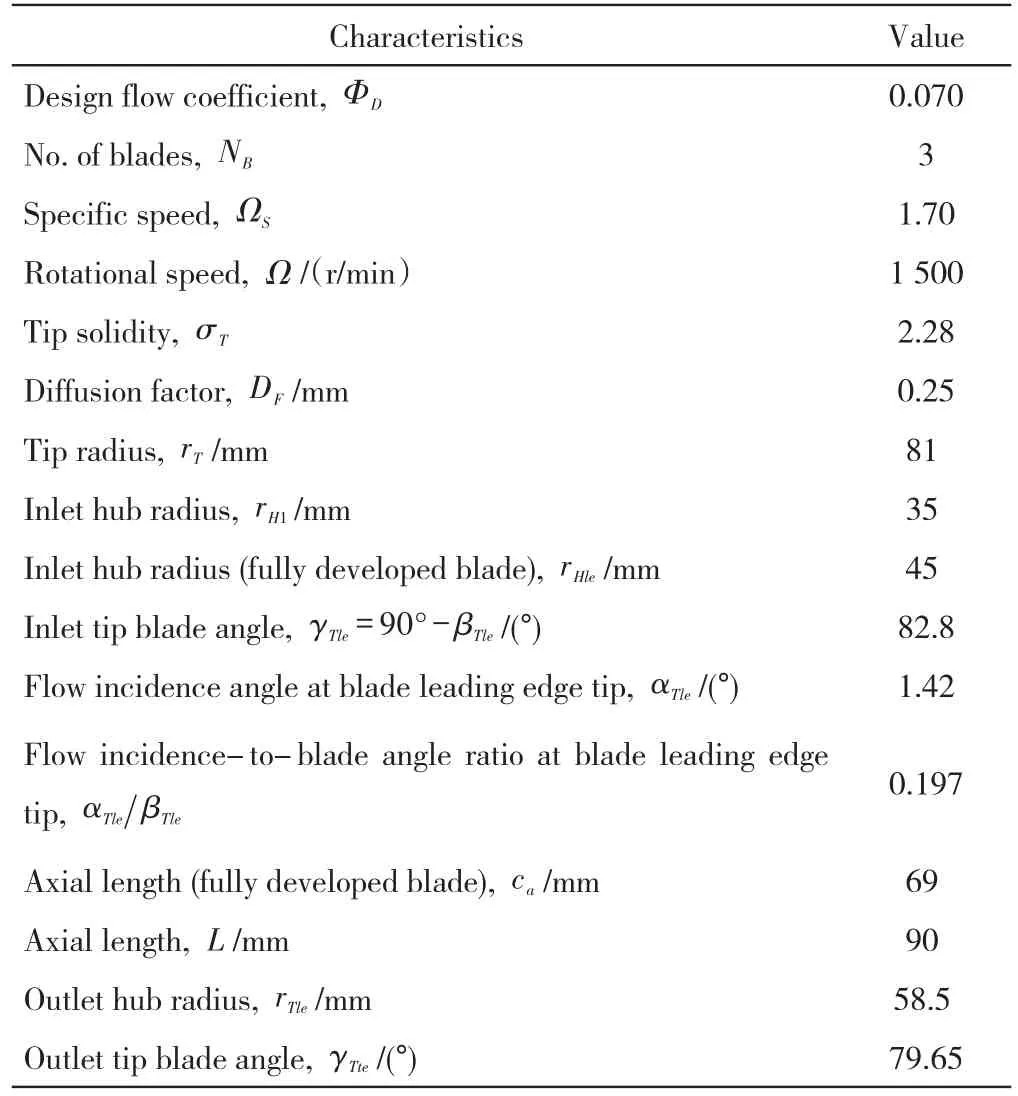
The three-bladed RAPDUD inducer(Figure 1)used in the present activity,whose main characteristics are illustrated in Table 1 and more extensively in d’Agostino(2017)[6],has been designed as proposed by some of the authors(d’Agostino et al.,2008a,2008b)[7-8]and tested in a series of cavitation experiments(Pace et al.,2019[22])in the Cavitating Pump Rotordynamic Test Facility(CPRTF,Cervone et al.,2007[3]).Its pumping and suction performance are shown in Figure 2.The unsteady pressure in the blade channels has been measured by PCB S112A22 piezoelectric transducers(0 to 345 kPa pressure range,7 Pa resolution,14.5 mV/kPa sensitivity,-73 to+135℃ temperature range)flush-mounted on the inducer casing as shown in Figure 1.
1.1 Blade Channel Pressure Profile
Consideration of the unsteady pressure measured by the PCB transducers flush-mounted on the inducer casing in the blade channels of the RAPDUD inducer just behind the tips of the blade leading edges(Figure 3,on the left)confirms that the expected azimuthal profile of the pressurepj(ϑ′,t)generated by the j-th blade of azimuthal spacingθ=2π/Ncan be modeled as a sequence ofNtrapezoidal waves with peak-to-peak amplitude 2Pj(t),as illustrated on the right in Figure 3 where:
Tab.1 Characteristics of the RAPDUD inducer
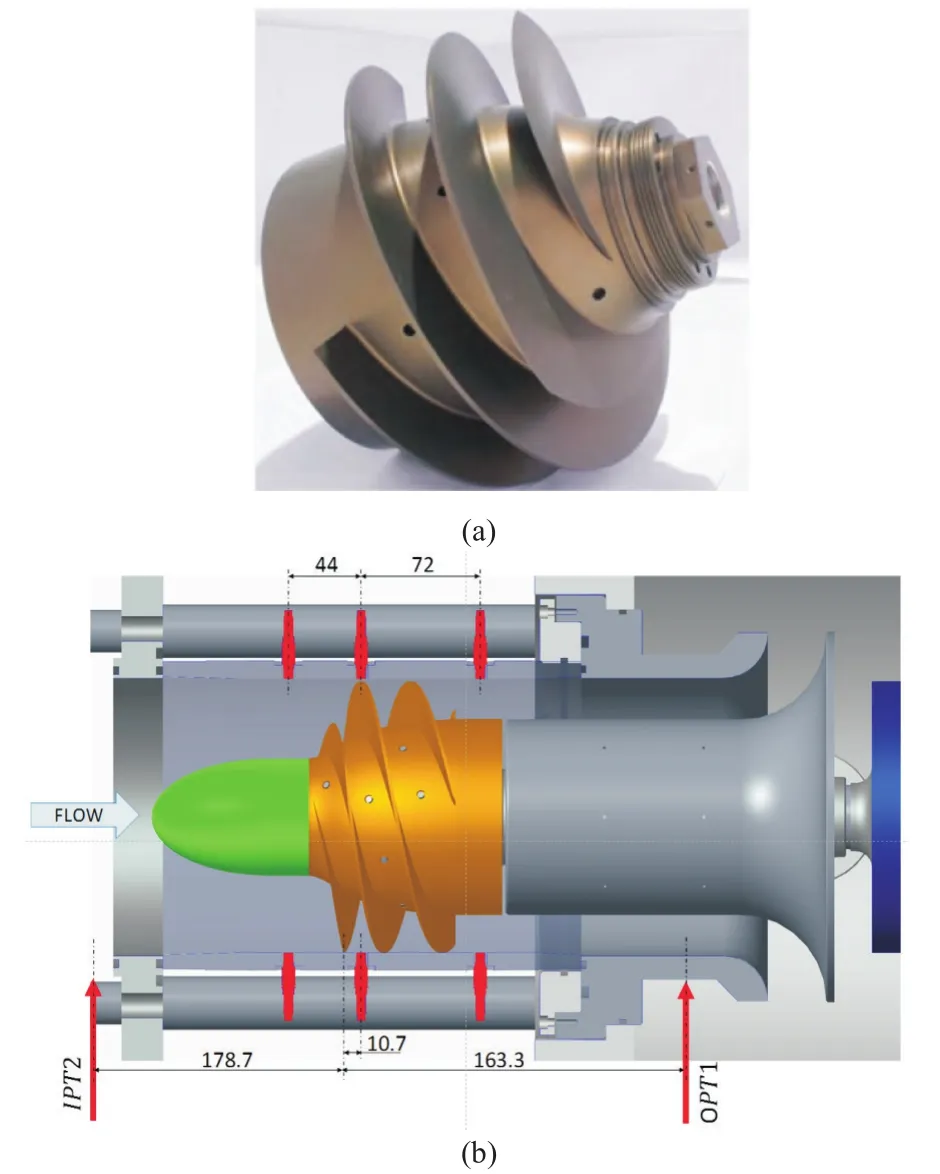
Fig.1 The RAPDUD inducer(a)mounted in the CPRTF test section(b)with the positions of the statoric pressure taps(Pace et al.,2019).The measurements from the second series of transducers mounted just downstream of the fullblade cross-section have been used in the present identification.
Fig.2 Pumping(a)and suction characteristics(b)of the RAPDUD inducer for operation in water at T=20℃ and Ω=3 000r/min(Pace et al.,2019).
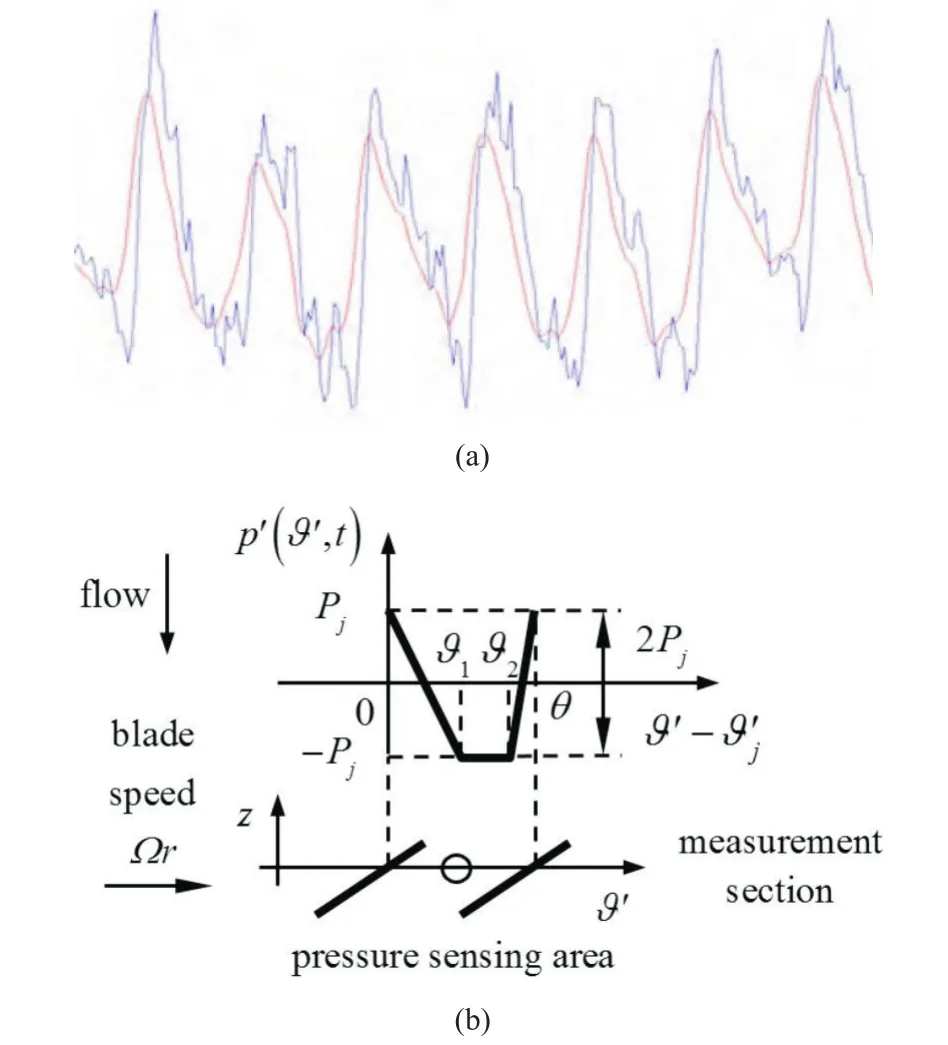
Fig.3 Typical pressure history(a)measured in the blade channels of the RAPDUD inducer(blue line)and its low-pass filtered value(red line).Trapezoidal pressure profile assumed in the blade channels for the development of the parametric model(b).
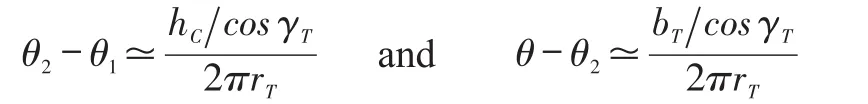
are the rotations for the transit of a blade of thicknessbT,tip radiusrT,axial staggerγTand its cavitating layer of thicknesshCover the pressure transducer,respectively.
1.2 Surge and Rotating Cavitation Pressure Spectra
The unsteady pressure field generated by surge cavitation in the blade channels is represented by a synchronous harmonic modulation of the lift on the blades.If surge cavitation occurs with equal intensity in all blades with peak-to-peak amplitude 2PSCangular frequencyωSCand phaseφSCin the rotating frame,the resulting modulation of the blade pressure peaks is.
Pj(t)=PSCcos(ωSCt+φSC)
Similarly,the unsteady pressure field generated byNRC-lobed cavitation rotating with frequencyωRCin the impeller eye is represented by an harmonic modulation with amplitudePRCof the form:
p(ϑ,t)=PRCcos(NRCϑ-ωRCt+φRC)
The corresponding unsteady pressure field in the rotating frameϑ′=ϑ-Ωtgenerates at the locations of the bladesϑ′=ϑ′j=(j-1)θan harmonic modulation of the pressure on the blades of the form:
Pj(t)=PRCcos[NRCϑ′j-(ωRC-NRCΩ)t+φRC]
with equal peak-to-peak amplitude 2PRCon all blades.
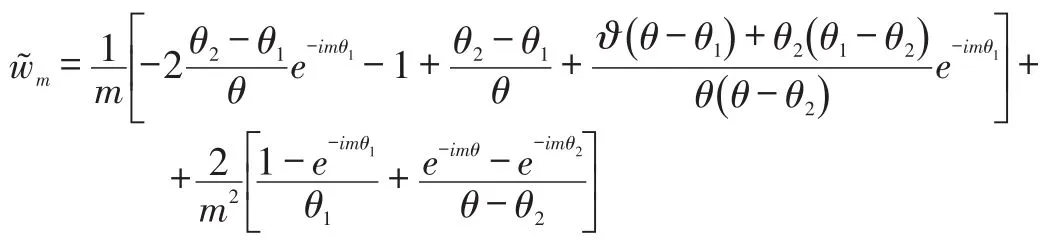
For evaluating the theoretical spectra generated by surge and rotating cavitation in the absolute frame,the Fourier series decomposition of the assumed pressure profile in the relative azimuthal coordinateϑ′according to the positions:
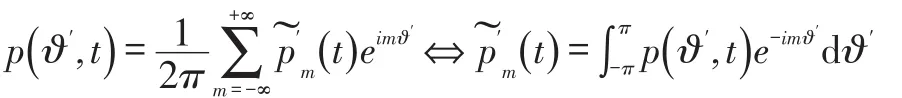
is first transformed in the absolute frame withϑ′=ϑ-Ωtand then its unsteady part is Fourier analyzed in time according to the definitions:

The resulting expressions of the theoretical spectra generated by surge and rotating cavitation in the absolute frame are:
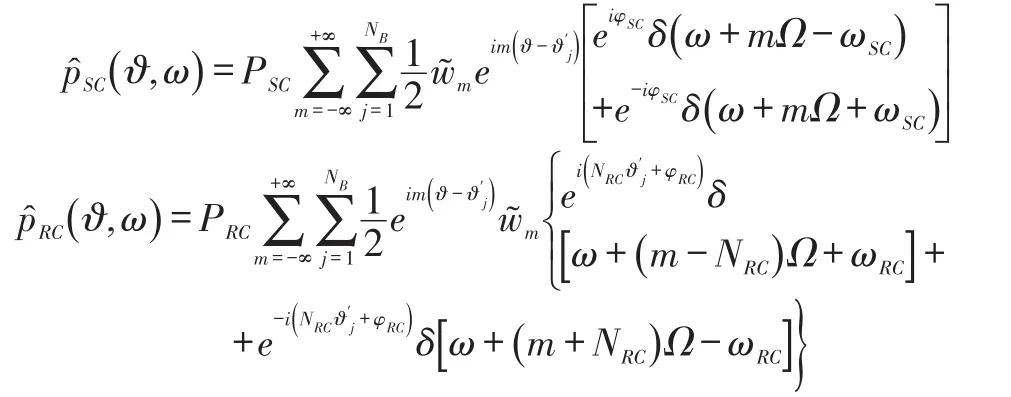
respectively,wherem≡integer≠0,δ(ω-ω0)indicates the delta function atω=ω0,and:
The pressure spectrum generated by the passage of the blades is obtained as a special case forωRC=Ω andNRC=0.
It is worth noting,for instance,that the spectrum of single-lobed rotating cavitation at the frequencyωRCdoes not coincide with the spectrum of dual-lobed rotating cavitation at frequencyωRC/2.This feature opens therefore the possibility of identifying rotating instabilities from just one single pressure measurement on the stator of the machine,thus eliminating the indeterminacy introduced by frequency aliasing in dual-sensor cross-correlation analyses.This feature,confirmed by later results,represents a significant advantage of the proposed identification method.
1.3 Frequency Broadening
In general,frequency broadening of the measured pressure spectra occurs mostly as a consequence of:
1)The noisy nature of the observed instabilities;
2)Measurement errors and windowing of the sampled data.
If these phenomena induce Gaussian dispersions of the line frequencies atω=-ω0with variance,the theoretical pressure spectra corrected for frequency broadening are obtained by substituting the Dirac functions atω=ω0:
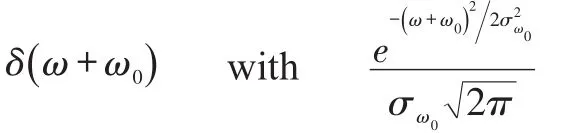
Measurement errors and windowing of the sampled data generate uniform frequency broadening at all frequencies.If,on the other hand,as assumed in the following,the intrinsically noisy nature ofωSC,ωRCandΩprevails,the variances of the theoretical spectral lines are expressed by:
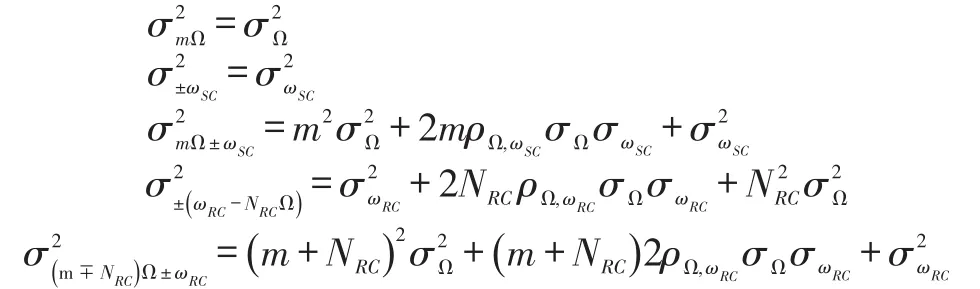
as functions of the(unknown)variancesand the correlation coefficientsand
1.4 Identification of Cavitation Instabilities
Consistently with the standard maximum likelihood estimation approach,the theoretical power spectra of the pressure fluctuations in the absolute frame have then been best fitted to the relevant experimental data by minimizing the sum of the quadratic deviations of two spectra:
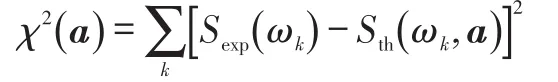
in the multidimensional space of the adjustable free parametersa=(a1,a2,...aR),typicallyPinst,ωinst,σΩ,σΩ,ωinstand.One important advantage of this method is that upon convergence it also returns the(relative)standard errorsε1,ε2,...εRof the estimated parametersa1,a2,...aR.
Experience shows that the convergence of the iterative minimization ofχ2to the parameters characterizing the instabilities of interest is critically dependent on the initialization of their unstable frequencies.For addressing this problem,the identification of a specific form of instability at frequencyωinhas been carried out through the following steps:
1)First,the correlation coefficient:
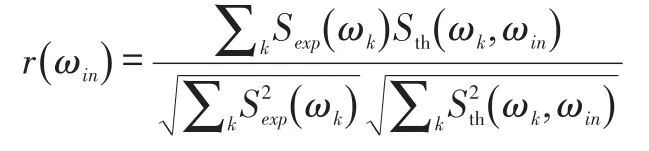
between the theoretical power spectrum of that instabilitySth(ω,ωin)and the experimental oneSexp(ω)has been computed.
2)Next,the parametric identification of a specific form of instability has been carried out using its frequency-broadened theoretical spectrum with fundamental frequencyωincorresponding to the highest peak values ofr(ωin)and,for azimuthal instabilities,to the candidate numbers of azimuthal lobes.
3)The accuracy of the identifications has then been evaluated from the mean valueof the relative standard errors returned by the maximum likelihood estimation of the physical parameters of the relevant theoretical spectrum(typically the pressure amplitudePinand frequencyωinof the instability,its spectral bandwidth,and that of the impeller rotational speedσΩ).If any,the actual number of lobes of the instability of interest has been identified as the one yielding the minimum value of.
4)The identified spectrum has been subtracted from the experimental one and the result used to iterate the identification for all the instabilities of interest,or until the signal-to-noise ratio of the residual experimental data made the identification of the next instability statistically unreliable.
Specifically,the first identification is carried out assuming equal pressure signal from all impeller blades for eliminating the combined effects of blade passage and uniform attached blade cavitation.The occurrence of asymmetric or alternate blade cavitation can then be detected from the results of the identifications of synchronous blade cavitation with the relevant number of lobes.The other forms of cavitation can then be sequentially identified as indicated above.
2 Results and Discussion
The experiments carried out in the CPRTF generally indicate that the main forms of cavitation instabilities in the RAPDUD inducer are d’Agostino,2017[6];Pace et al.,2019[22];Pasini et al.,2019[24]):
1)rotating cavitation modes(indicated as RC#in Figure 4)with one or more co-rotating and/or counter-rotating lobes,arising when the suction performance curve starts declining;
2)low frequency(subsynchronous)cavitation auto-oscillation surge modes(indicated as A#in Figure 4),also arising when approaching breakdown conditions;
3)higher-order cavitation surge modes,occurring at super-synchronous frequencies over a wider range of cavitation numbers.
Figure 4 illustrates the intensity(left)of the power spectrumSexp(ω)and the phase(right)in deg of the cross-power spectrum of the pressure measured by transducers 1 and 2 mounted on station f_a upstream in the impeller eye(on the left in Figure 5).They are plotted as functions of the cavitation numberσand reduced frequencyω/Ωfor inducer operation in water atT=20℃,rotational speedΩ=3000rpm,and design flow coefficientΦ=0.070 3.Consideration of the cross-correlation phase and the azimuthal separation of the sensors indicated the occurrence of the axial flow oscillation and the single-lobe rotating cavitation instabilities denoted in the figure as A1,RC2,RC3,and RC4,respectively,whose effects on the suction performance of the inducer when the cavitation number drops belowσ≃0.70 are illustrated in Figure 5.
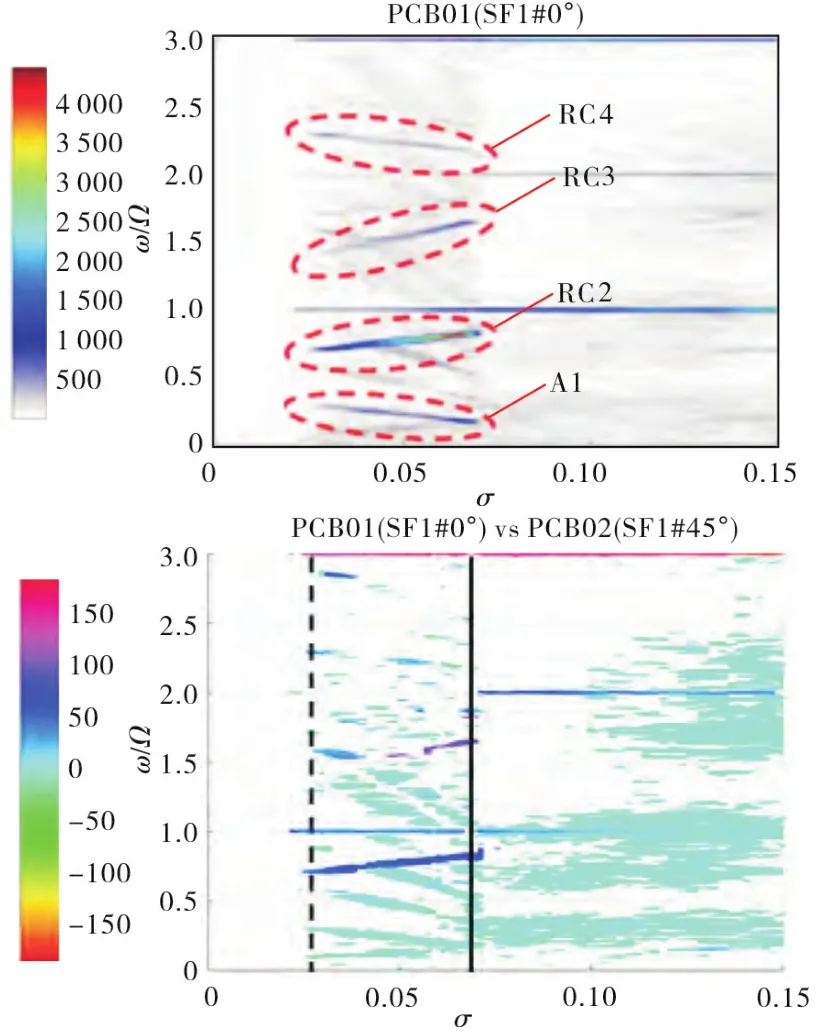
Fig.4 Reduced frequency ω/Ω of the pressure power spectrum Sexp(ω)measured in the RAPDUD inducer for operation at design flow Φ=0.0703and Ω=3000rpm in water at T=20℃,plotted as a function of the cavitation number σ(left,Pace et al.,2019).Different colors indicate the intensity(left)and phase in deg(right)of the pressure spectra.
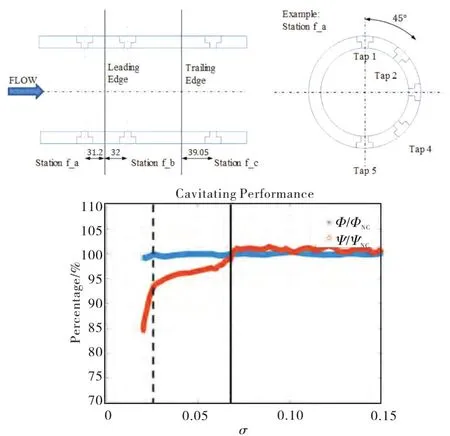
Fig.5 Schematic of the axial stations f_a,f_b and f_c and casing taps of the pressure transducers mounted on the test inducer(left).Suction performance of the RAPDUD inducer(right)for operation at design flow Φ=0.070 3 and Ω=300 0 rpm in water at T=20℃,plotted as a function of the cavitation number σ(Pace et al.,2019)[22]and illustrating the effect of the onset of rotating cavitation for.
The proposed identification method has been applied to the pressure measurements in the blade channels just after the leading edges of the impeller blades(station f_b in Figure 5),for operation of the test inducer at 80% of the design flow and three values of the Euler numberσ=0.070 2,0.0505,and 0.0290.As illustrated on the right in Figure 5,the selected range of cavitation numbers covers increasing levels of cavitation from the onset of rotating cavitation to near breakdown conditions.Not surprisingly,experience showed that the transducers mounted just before the impeller(station f_a in Figure 5)are sensing the disturbances generated by all of the inducer blades,and possibly also those from the destabilization of the backflow in the impeller eye,adversely interfering with the identification of cavitation instabilities on the suction sides of the impeller blades.
The pressure autocorrelation spectrum measured atσ=0.070 2 is shown by the black line in Figure 6 as a function of the reduced frequencyω/Ω.Also shown by the light blue line in the same figure is the identified spectrum of synchronous pressure disturbances generated by the blade passage atωin=Ωand,if present,by the superposition of azimuthally uniform(zero-lobed)synchronous blade cavitation.
Good agreement has been obtained between the two spectra,allowing for effective filtering of the blade passage signal by subtraction of the theoretical spectrum from the measured one.The result is illustrated by the black line in Figure 7.Identification of single-lobed synchronous(ωin=Ω)disturbances in the filtered experimental spectrum,indicated by the light-blue line in the same figure,shows that only synchronous asymmetric rotating cavitation of insignificant intensity occurred in the test inducer at the operating conditions under consideration.
Subtraction of the identified spectrum from the measured one yields the experimental autocorrelationSexp(ω)used to determine the frequencies of rotating instabilities occurring in the test inducer.To this purpose,Sexp(ω)has been correlated to the theoretical spectrumSth(ω,ωRC)generated by a single-lobed rotating instability with fundamental frequencyωRCand the most likely unstable frequencies have been determined as corresponding to the largest statistically significant peaks of the correlation coefficient so obtained as a function ofωRC.The results are illustrated in Figure 8,where the first four candidate unstable frequencies atωRC/Ω=0.88,2.12,3.88,and 5.12 are indicated by the acronyms later assigned to the corresponding instabilities.
Although in principle rotating instabilities with any number of lobes may occur in cavitating three-bladed inducers,in practice only instabilities with one or two lobes are usually observed.Therefore alternative identifications of single-lobed and double-lobed rotating instabilities have been carried out at each of the above four candidate frequencies and the actual number of lobes of the corresponding instabilities has been determined as the one that best fitted the experimental spectra.To this purpose,the identifications have been ranked based on the figure-of-meritdefined as the mean value of the relative standard errors returned by the maximum likelihood estimation of the parameters of the relevant theoretical spectrum(typically the pressure amplitudePinand frequencyωinof the instability,its spectral bandwidthσωin,and that of the impeller rotational speedσΩ).The number of lobes so obtained from the identifications always coincided with the available results of the cross-correlation analyses of the relevant cavitation instabilities detected in the test inducer.
The identification/filtering procedure illustrated above has then been sequentially applied to the four frequencies indicated in Figure 8.Representative examples of the results are shown in Figure 9 and 10,where the identified spectra of single-and double-lobed instabilities atωRC/Ω=0.88are illustrated(light blue line)together with the relevant filtered experimental pressure autocorrelation spectrum(black line).Despite the close similarity of the two identified spectra,the discrimination criterion based on the above figure-of-meritcorrectly indicates that the single-lobed spectrum is more accurate.
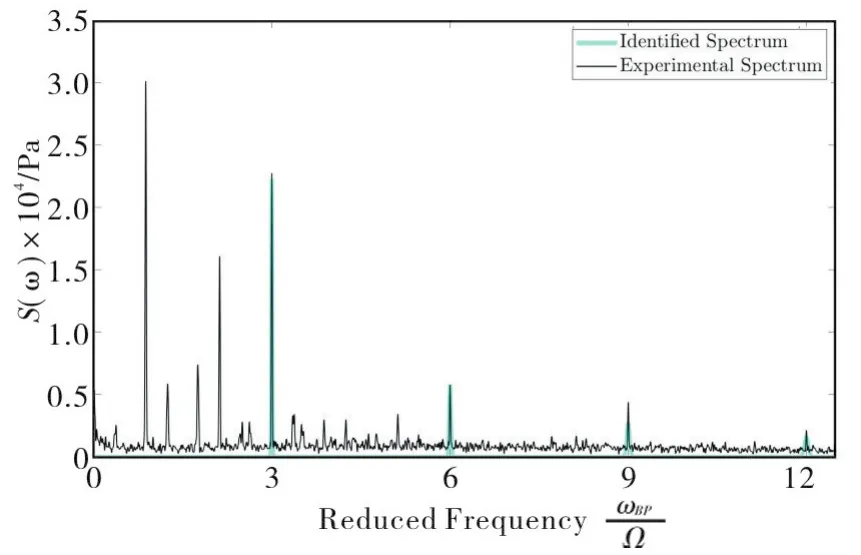
Fig.6 Pressure autocorrelation spectrum measured at station f_b on the test inducer for operation in water at T=20℃,rotational speed Ω=300 0rpm,80% of the design flow and σ=0.070 2(black line).The light-blue line shows the corresponding identified spectrum of synchronous pressure disturbances generated by the blade passage and,possibly,by the superposition of azimuthally uniform(zero-lobed)synchronous blade cavitation.
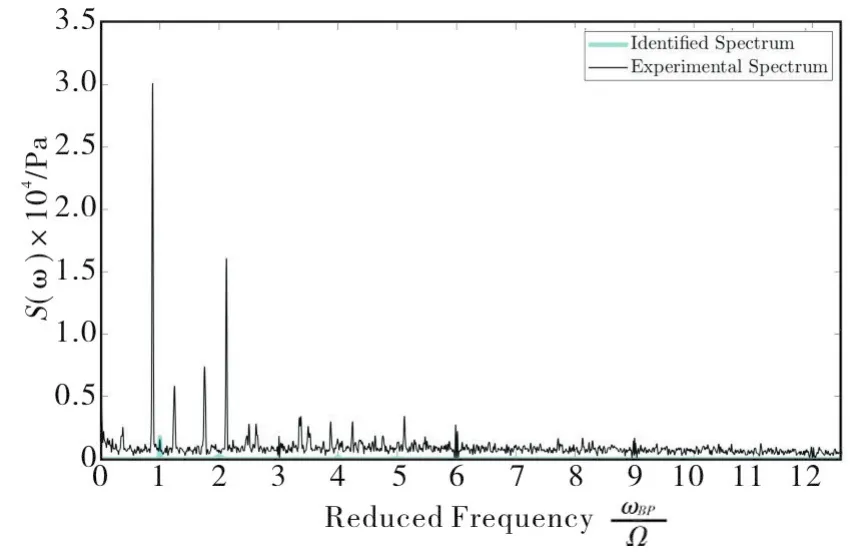
Fig.7 Identification of single-lobed synchronous rotating cavitation(asymmetric synchronous rotating cavitation,light blue line)from the filtered pressure autocorrelation spectrum measured at station f_b on the test inducer for operation in water at T=20℃,rotational speed Ω=300 0rpm,80% of the design flow and σ=0.070 2(black line).
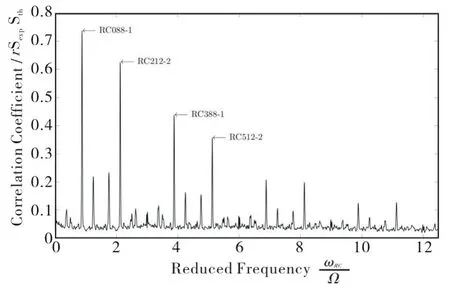
Fig.8 Correlation coefficient of the theoretical spectrum Sth(ω,ωRC)of a single-lobed rotating instability with fundamental frequency ωRC and the filtered experimental spectrum Sexp(ω)for the test inducer operating in water at T=20℃,rotational speed Ω=3 000rpm,80% of the design flow and σ=0.070 2.Figure 11.Residual filtered spectrum at the conclusion of the identification of rotating instabilities identified in the test inducer for operation in water at T=20℃,rotational speed Ω=3 000rpm,80% of the design flow and σ=0.070 2.
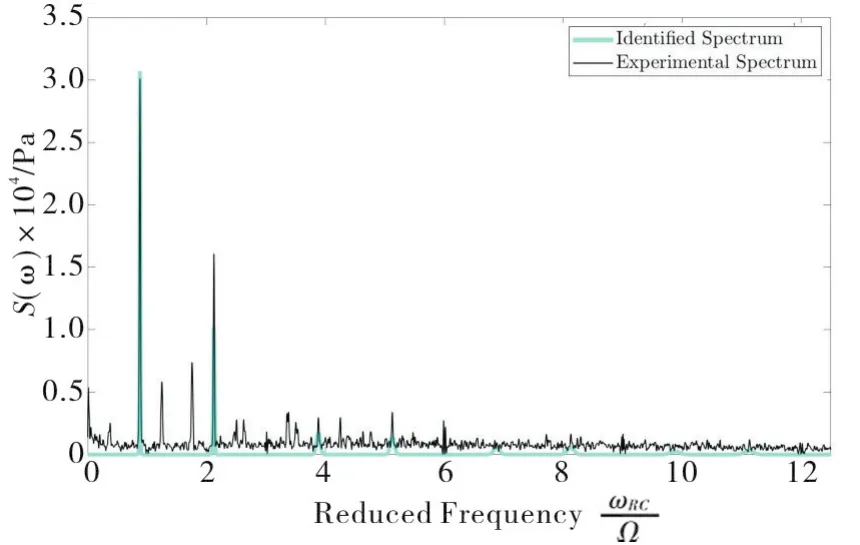
Fig.9 Identification of single-lobed rotating cavitation at ωRC/Ω=0.88(light blue line)from the filtered pressure autocorrelation spectrum measured at station f_b on the test inducer for operation in water at T=20℃,rotational speed Ω=3 000rpm,80% of the design flow and σ=0.070 2(black line).
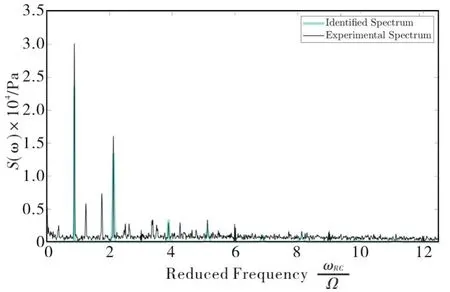
Fig.10 Identification of double- lobed rotating cavitation at ωRC/Ω=0.88(light blue line).from the filtered pressure autocorrelation spectrum measured at station f_b on the test inducer for operation in water at T=20℃,rotational speed Ω=3 000rpm,80% of the design flow and σ=0.070 2(black line).
The cross-correlation procedure illustrated earlier has then been repeated and applied to the filtered experimental spectrum obtained after the identification of the fourth instability atωRC/Ω=5.12,for determining the other frequencies of rotating instabilities possibly occurring in the test inducer.The results suggested that additional instabilities might be present at reduced frequenciesωRC/Ω=1.24,1.75,4.24,and 4.75.Application of the previous identification procedure to the flow disturbances occurring at these frequencies confirmed the presence of four additional instabilities.No further instability could be identified because of insufficient signal-to-noise ratio in the residual filtered pressure autocorrelation spectrum shown in Figure 11.
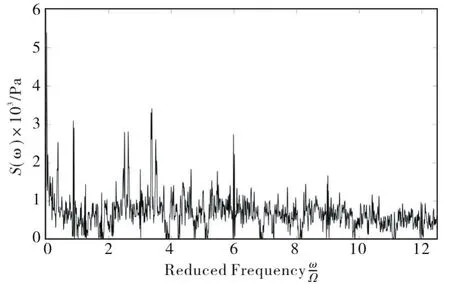
Fig.11 Residual filtered spectrum at the conclusion of the identification of rotating instabilities identified in the test inducer for operation in water at T=20℃,rotational speed Ω=300 0rpm,80% of the design flow and σ=0.070 2.
The results obtained at the cavitation number under investigation(σ=0.070 2)are summarized in Figure 12.Instabilities are indicated by alphanumerical acronyms where the first letters,BP,AC and RC,refer to blade passage,axial cavitation and rotating cavitation,the first three digits to the unstable frequency expressed in percentage of the impeller rotational speed,and the last one to the number of azimuthal lobes of the instability.The values of the figure-of-merit used to assess the accuracy of the identification are also indicated after the acronyms of each instability.Finally,the cumulative spectrum of all of the instabilities identified atσ=0.070 2is illustrated by the light-blue line in Figure 13 for comparison with the original pressure autocorrelation spectrum measured on the test inducer(black line).The results confirm the capability of the proposed procedure to closely approximate the spectral contributions of the main cavitating flow instabilities occurring in the test inducer at the Euler number under consideration.
Extension of the above identification procedure to the experimental data obtained at the remaining Euler numbers(σ=0.050 5 and 0.029 0)yielded the results shown in Figure 14.Black circles refer to the observation atσ=0.050 5 of the same unstable phenomena also manifest atσ=0.070 2,indicated by red circles.As expected,the identified features of the flow instabilities at the two Euler numbers taken into consideration coincide,supporting the robustness of the identification procedure.On the other hand,yellow circles refer to a new set of four comparatively weaker flow instabilities detected at the lowest cavitation number,σ=0.029 0.They all consist in rotating cavitation modes,occurring both at sub-synchronous(RC043-1)and super-synchronous frequencies(RC256-1,RC343-1 and RC356-1),the first three of which are single-lobed while the last one is double-lobed.Also indicated in the brackets are the acronyms of the instabilities as identified by Pace et al.,2019.[22]
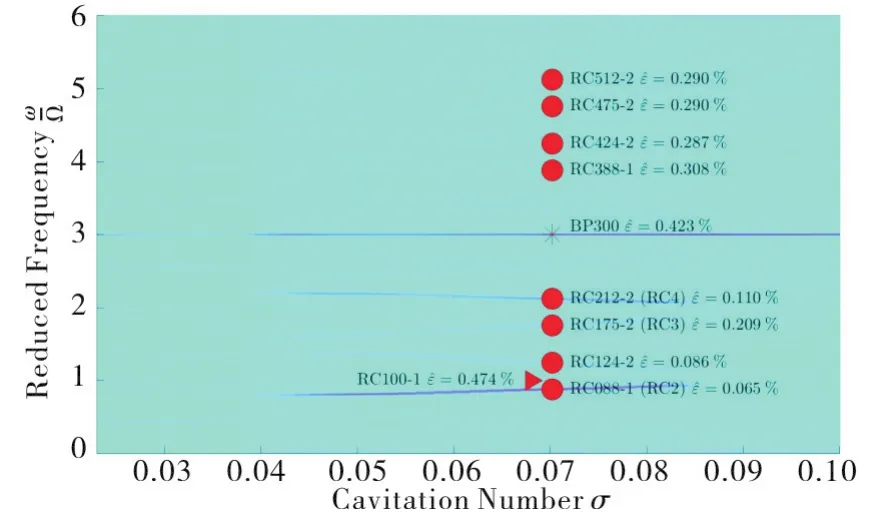
Fig.12 Flow instabilities identified in the test inducer for operation in water at T=20℃,rotational speed Ω=3 000rpm,80% of the design flow and σ=0.070 2.The star,the triangle and the circles indicate the blade passage signal,synchronous asymmetric blade cavitation and rotating cavitation modes.The values of the figure-of-merit used to assess the accuracy of the identification are also indicated after the acronyms of each instability.
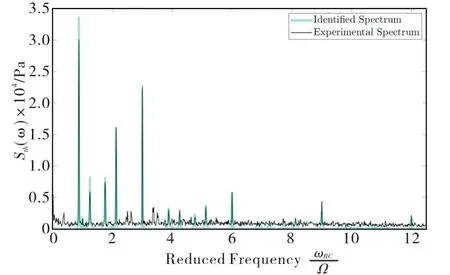
Fig.13 Comparison of the experimental and cumulative spectra for all of the instabilities identified in the test inducer for operation in water at T=20℃,rotational speed Ω=3 000rpm,80% of the design flow and σ=0.070 2.
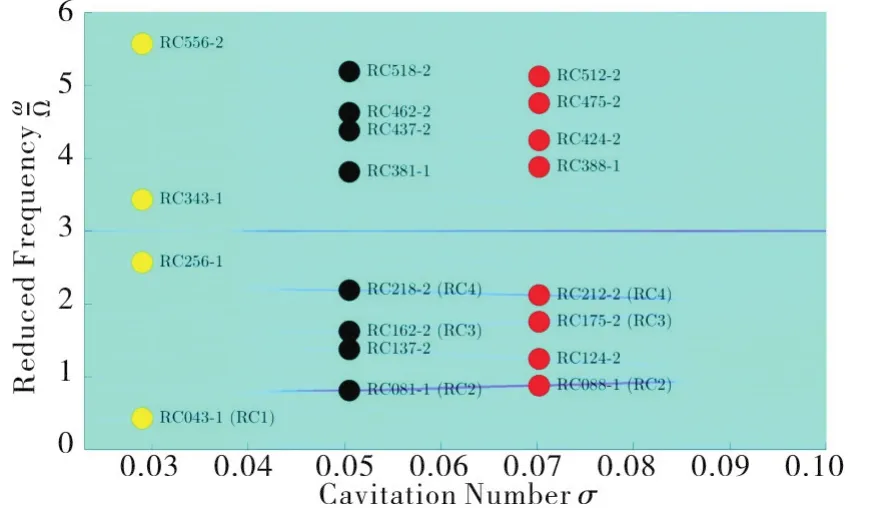
Fig.14 Flow instabilities identified in the test inducer for operation in water at T=20℃,rotational speed Ω=3 000rpm,80% of the design flow and σ=0.029(yellow circles),0.050 5(black circles)and 0.070 2(red circles).The brackets indicate the acronyms of the instabilities as identified by Pace et al.,2019.
It is worth noting that the instabilities identified in present experiments are symmetrically located along the frequency axis w.r.t.the blade passage frequencyω=3Ωand its super-harmonics,where relatively high-intensity signals are present in the pressure spectra.It appears therefore that the flow disturbances observed at higher frequencies might have been generated by nonlinear interactions of the fundamental instability at the lowest frequency with the pressure perturbations generated by the passage of the impeller blades,as also suggested by earlier researches(see Subbaraman and Patton,2006[28],among others).However,not all these interactions display the same number of azimuthal lobes as the fundamental low-frequency mode.If the present identification is correct,an alternative interpretation of these results is that at least some of the higher-order instabilities have indeed developed in response to the excitation generated by the nonlinear interactions of the fundamental mode,but with a different number of nodes.Whatever their origin of these higher-frequency instabilities might be,it does not interfere with their dynamic effects on the impeller,and therefore with the need to develop more effective techniques for their detection and quantitative characterization.Conclusive confirmation that these instabilities arise as a consequence of nonlinear interactions with the pressure perturbations generated by the blade passage would have important implications on the efforts to better address the actions aimed at their elimination and/or control in high power density turbopumps.More research is needed to fully elucidate this point,which the authors intend to investigate further in future publications.
The quantitative results of the identifications carried out at the three Euler numbersσ=0.070 2,0.050 5 and 0.029 0 considered in the present work are summarized in Table 2,3 and 4,respectively.For each rotating instability indicated by its acronym,the tables report the reduced frequencyωRC/Ω,the number of lobesNRC,the unstable frequencyωRC,the amplitude of the pressure fluctuationsPRC,the frequency bandwidthofωRC,taken equal to the one of the impeller rotational speedσΩ,the cross-correlation coefficientofandσΩ,the figure-of-meritfor the assessment of the statistical significance of the identification,and the outcome of the identification of the number of lobes of the instability.The results show that the standard errors of the estimated parameters are relatively narrow,thus confirming the accuracy of the identifications.The cross-correlation coefficientsρΩ,ωRCrepresent an exception in this respect,indicating that the results of the identifications are relatively insensitive to their exact value.For this reasonhas been excluded from the evaluation of the figure-of-meritused to assess the statistical significance of the identifications.It is worth noting that the value ofnever exceeds 1% even if the dynamic range of the pressure fluctuation amplitudes extends over up to two decades,thus confirming the robustness of the proposed identification method.This finding,together with consideration of the residual spectrum of Figure 11,indicate that the proposed identification method is indeed capable of using the readings of one single transducer suitably located on the casing of the test inducer for effectively detecting,discriminating and characterizing the simultaneous occurrence of multi-ple instabilities with intensities spanning over about 20 dB down about 3 to 4 dB signal-to-noise ratios.
The present method has also been successfully tested for the identification of the flow instabilities occurring in the test inducer at design flow where,as expected,the intensity of unstable phenomena is lower,as well as for the identification of the flow instabilities at 80% of the design flow using the transducer mounted in the impeller eye,where the signal is noisier due to the interference from neighboring blades.Representative results are summarized in Figures 15 and 16,respectively.Not surprisingly,the method is rather insensitive to the relatively small decrease of the signal intensity at nominal flow conditions(Figure 15),but it is adversely affected by the increase of the background noise in the measurements carried out in the impeller eye,where only two instabilities could be detected(Figure 16).
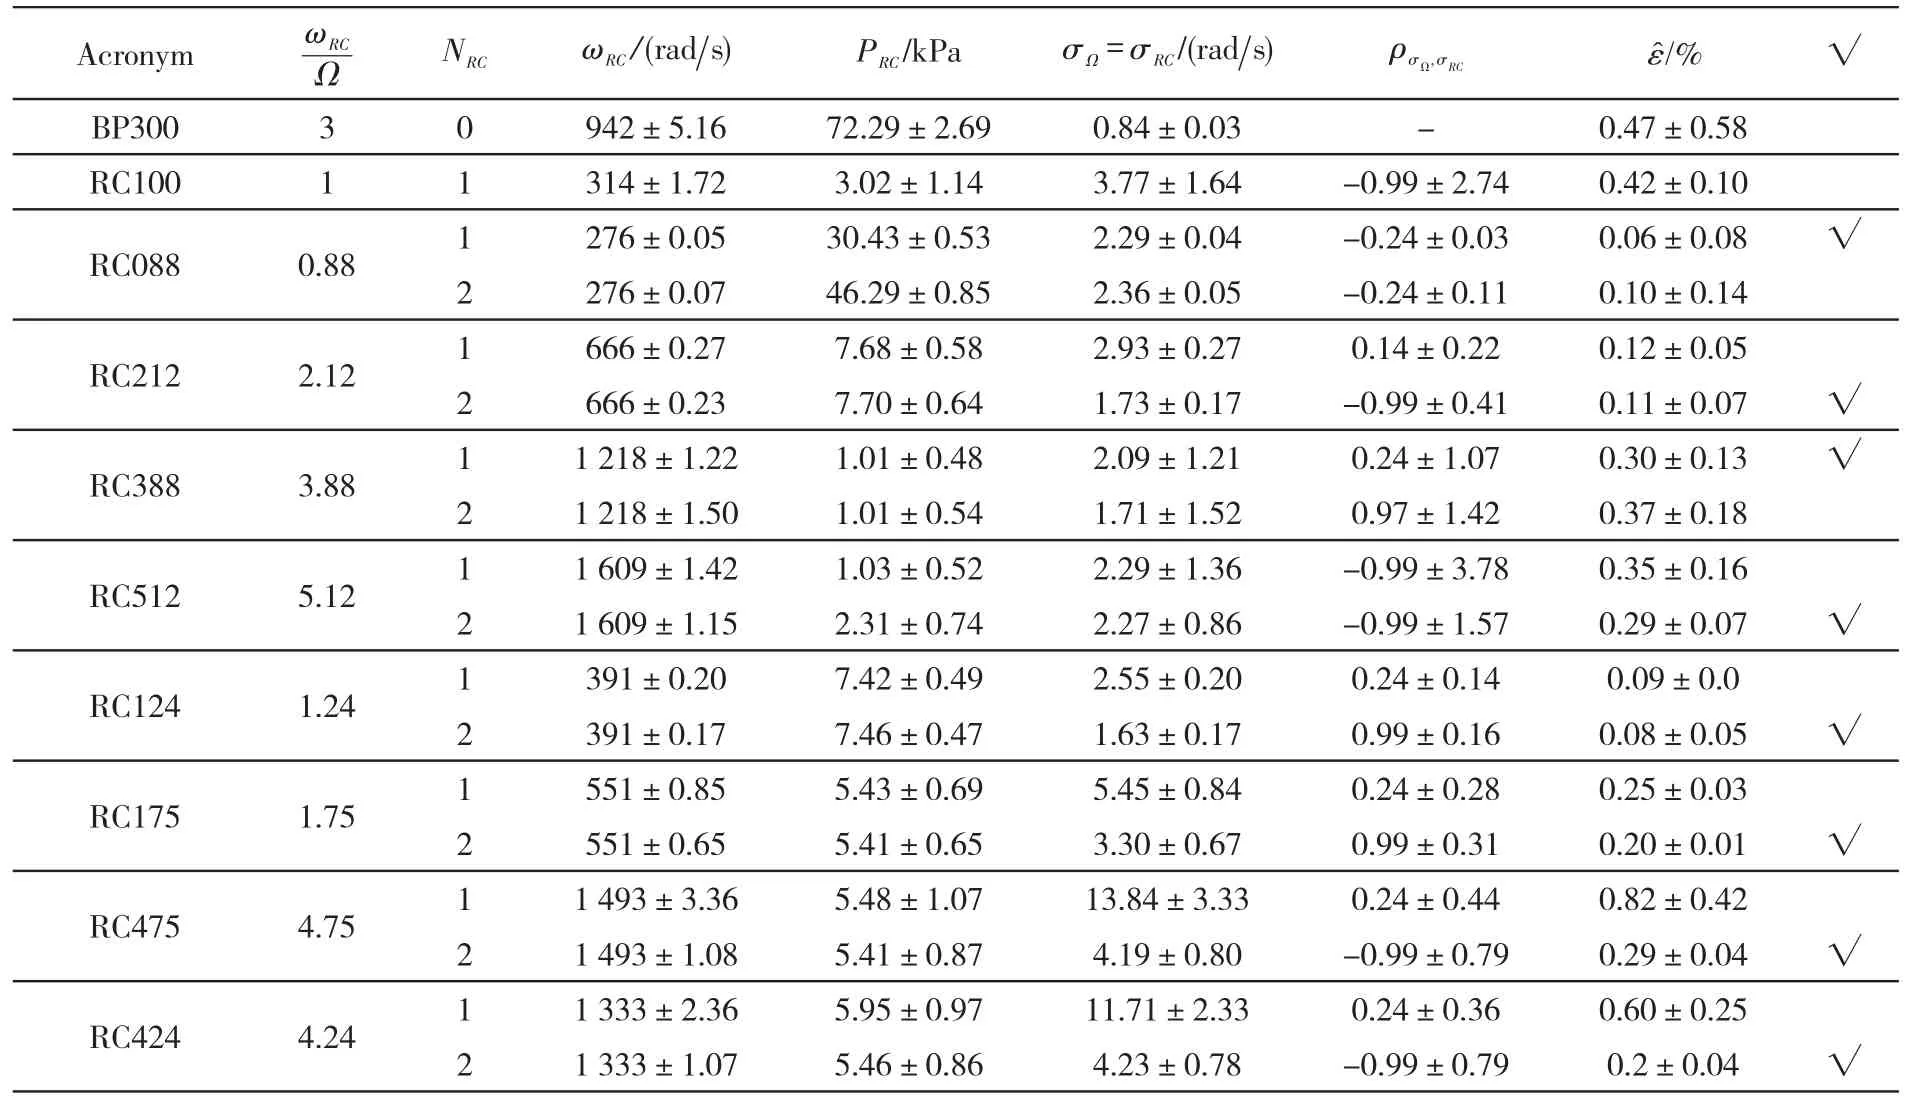
Tab.2 Instabilities and their parameters identified in the test inducer operating in water at T=20℃,rotational speed Ω=3 000rpm,80% of the design flow and σ=0.070 2.
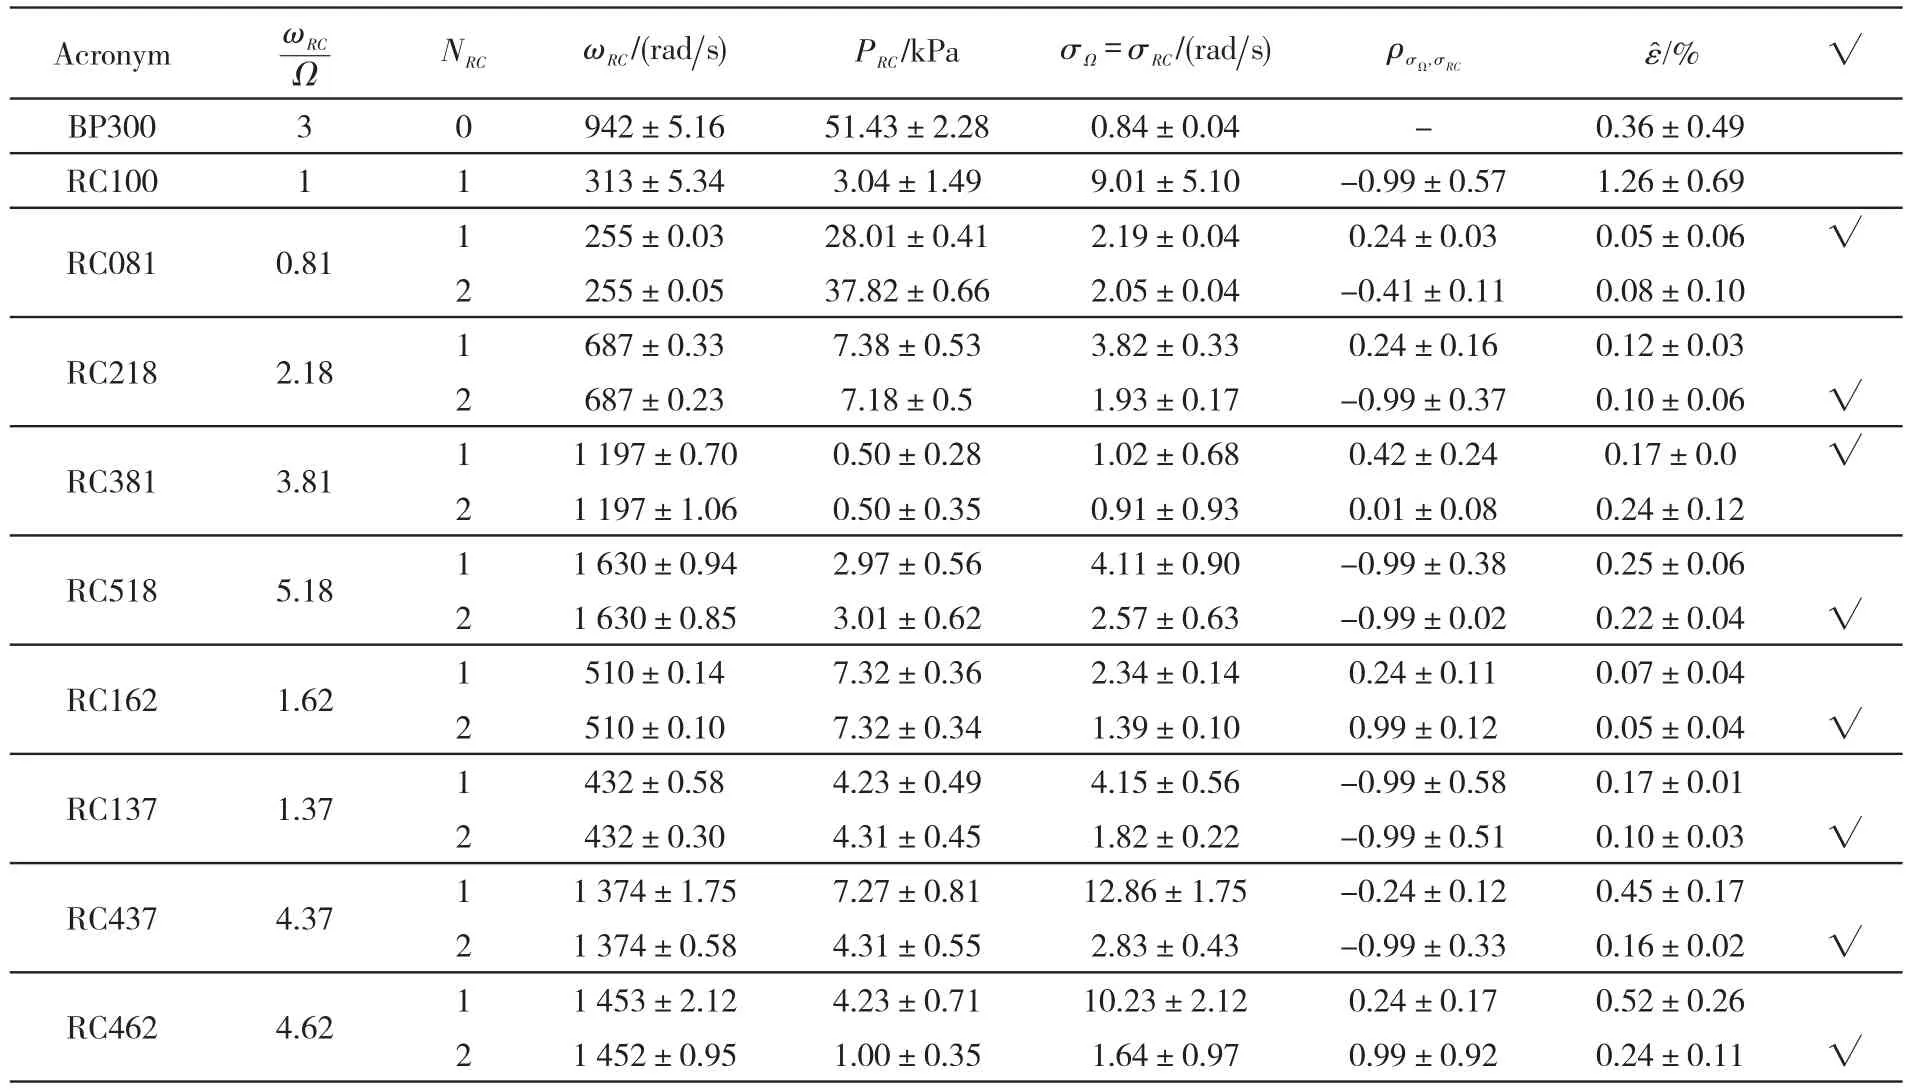
Tab.3 Instabilities and their parameters identified in the test inducer operating in water at T=20℃,rotational speed Ω=3 000rpm,80% of the design flow and σ=0.050 5.
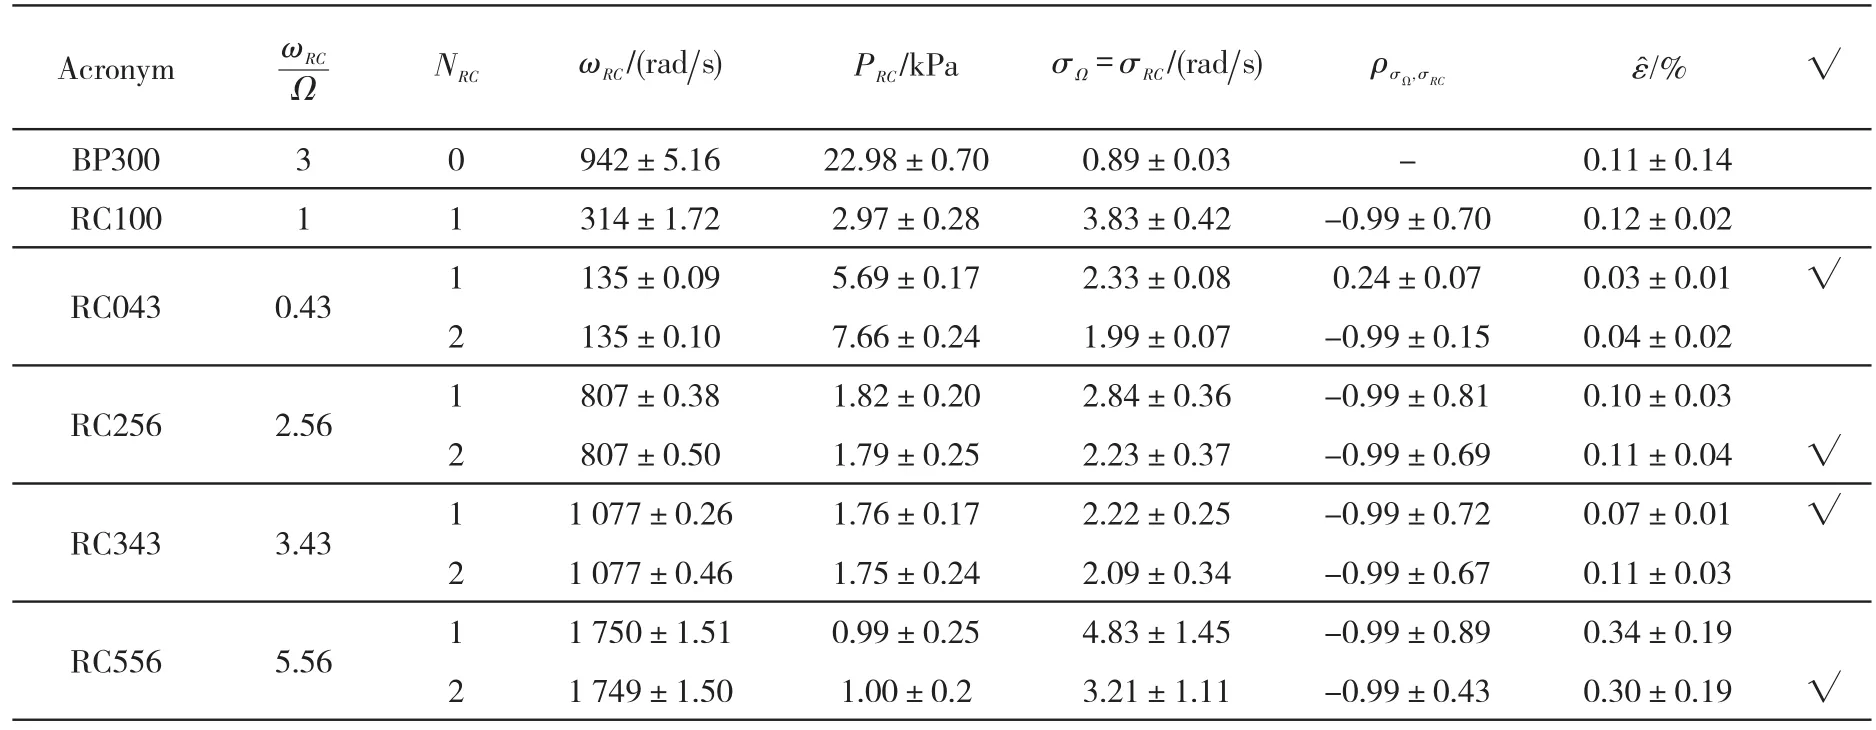
Tab.4 Instabilities and their parameters identified in the test inducer operating in water at T=20℃,rotational speed Ω=3 000rpm,80% of the design flow and 0.029 0.
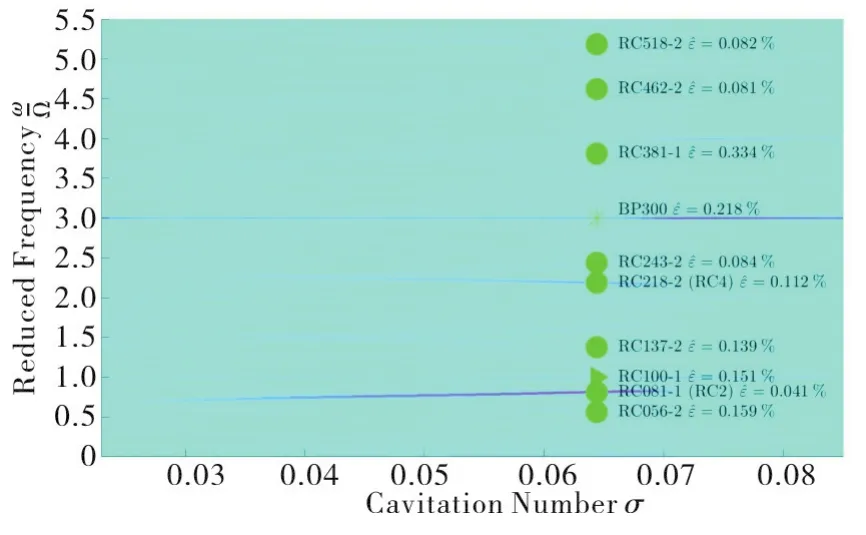
Fig.15 Flow instabilities identified in the test inducer for operation in water at T=20℃,rotational speed Ω=3 000rpm,100% of the design flow and σ=0.064 4(yellow circles).The brackets indicate the acronyms of the instabilities as identified by Pace et al.,2019.The values of the figure-ofmerit used to assess the accuracy of the identification are also indicated after the acronyms of each instability.
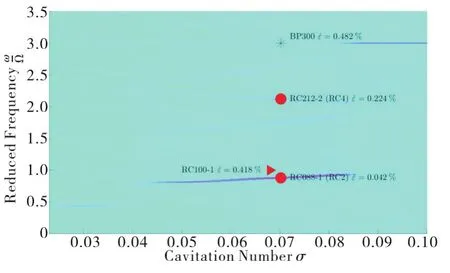
Fig.16 Flow instabilities identified in the test inducer for operation in water at T=20℃,rotational speed Ω=3 000rpm,80% of the design flow and σ=0.064 4(yellow circles)using the transducer mounted in the impeller eye.The brackets indicate the acronyms of the instabilities as identified by Pace et al.,2019[22].The values of the figure-ofmerit used to assess the accuracy of the identification are also indicated after the acronyms of each instability.
3 Conclusions
The proposed maximum likelihood approach proved capable of effectively detecting,identifying and characterizing multiple rotating cavitation instabilities simultaneously occurring at design and off-design operation and subsynchronous or super-synchronous frequencies in a typical three-bladed high-head inducer for space applications.
The experimental results confirmed that the identification only requires the signals of one unsteady pressure transducer mounted just behind the blade leading edges,an aspect that drastically simplifies the instrumentation required for monitoring rotating cavitation instabilities in high power-density turbopumps.The theoretical spectra obtained parametrizing each flow phenomena display characteristic patterns,with the presence of significant side-band contributions in addition to the fundamental frequency.The identification makes use of this information for effectively discriminating the flow instabilities,by-passing the aliasing limitations of traditional methods based on the cross-correlation of the signals from multiple transducers mounted at different azimuthal positions at the same axial station of the machine.The results of the identification coincide with those of cross-correlation analysis for all of the instabilities available for comparison.They also indicate that the method is capable of identifying at least 8 simultaneous instabilities over a 20 dB dynamic intensity range,down to 3 to 4 dB signal-to-noise ratio.Beyond this limit the identifications become statistically insignificant.
Finally,if successfully extended and validated to the analysis of complex Fourier spectra(capable of retaining the phase information of the pressure signals),the present estimation method would open the possibility of providing diagnostic information on possible geometric imperfections of the impeller blades even before cavitation occurs in the machine.In the authors’opinion,the proposed approach represents therefore a promising tool in high-performance cavitating turbopump research.
Acknowledgements
The experimental part of the present work has been funded by the European Space Agency under Contract No.4000113291/15/NL/RA.The authors would like to express their gratitude to Dr.Giorgio Saccoccia,ESA-ESTEC,Noordwijk,The Netherlands,for his constant attention and encouragement.Special thanks go to our former colleague at GMYS-Space Mrs.S.T.Katz for her warm friendship and constant support during.