Fatigue Crack Growth Properties of 18Ni(250)and 18Ni(350)Used for Full-Ocean-Depth Pressure Hull
2019-01-09ZHANGSujieWANGFangCUIWeicheng
ZHANG Su-jie,WANG Fang,CUI Wei-cheng
(1.School of Mechanical Engineering,Jiangsu University of Science and Technology,Zhenjiang 212003,China;2.Hadal Science and Technology Research Center(Shanghai Engineering Research Center of Hadal Science and Technology),Shanghai Ocean University,Shanghai 201306,China)
Abstract:Maraging steel will be applied in the development of full-ocean-depth manned cabin and also some other pressure hull as water ballast cabins.And 18Ni(250)and 18Ni(350)are two candidate types of maraging steels.The life assessments of the manned cabin and water ballast cabins must be conducted to guarantee the safety of the submersible.In this paper,the crack growth test results of 18Ni(250)and 18Ni(350)obtained by experiments are presented,and their parameters of the unified crack growth rate model are obtained based on one group of the experimental results.The crack growth rate curves under other load ratios are predicted according to those parameters.Comparisons between prediction curves and test data show the applicability of the prediction model on the two materials,which can be the theoretical basis in fracture-mechanics based life estimation of manned cabins and water ballast cabins.
Key words:maraging steel;full-ocean-depth manned cabin;crack growth rate;18Ni(250);18Ni(350)
0 Introduction
The maraging steel attracts submersible designers’attention due to its extreme high strength to satisfy the design requirements of manned cabin or water ballast tank.Especially,the 18Ni grade maraging steels are available according to a preliminary investigation and research in terms of their application history,performance and current manufacturing capabilities[1],thereinto,18Ni(250)and 18Ni(350)are the most competitive candidates.
Fatigue and fracture properties of high tensile strength steels must be carefully investigated.The behavior of fatigue cracks is a matter of importance in stress concentration spots of the component.Studies on comprehensive properties of 18Ni(250)and 18Ni(350)are easily found in literature[2-3]but the crack growth characteristics of maraging steel have not been reported enough in recent years while some results can be found in literature published before 1980s when the application of maraging steel is a hot issue.
Cui et al[4]have proposed a group of constitutive equations to express the crack growth rate of a wide range of alloys,in which the elastic-plastic behavior in the vicinity of the cracks,the threshold/stable/unstable crack growth behaviors and the relationships between crack growth curves under different load ratios can be described well.The equations have been successfully validated by many material experiments,which can be applied in life estimation for engineering components.
In this paper,the crack growth rates of two types of maraging steels 18Ni(250)and 18Ni(350)by experiments are provided as two candidates for full-ocean-depth manned cabin,which will provide basic data support to the life estimation of the manned cabin.And the applicability of the constitutive equations is validated by the experimental results.
1 Materials and test procedure
Chemical compositions and mechanical properties of the 18Ni(250)and 18Ni(350)material are tested after sequential steps of melting,melt treatment practice,forging process heat treatments,machining operations and inspections.Their chemical compositions and mechanical properties are given in Tabs.1-2 and also Figs.1-2.
Sets of compact-tension(C-T)specimens with dimensions of thickness B=12.5 mm and width W=50 mm are machined out from test billet with size 50mm×150mm×450mm.All crack growth test specimens were conducted using an MTS810 servo-hydraulic testing machine at four load ratios,i.e.0.1,0.3,0.5 and 0.7 to obtain data over a wide range of growth rates.The data from different load ratios also are applied for validating the applicability of the prediction model.
The linear form of stress intensity factors for C-T specimens can be expressed as follows[8]:

where λ=a/W and ΔP is the force ranges;B and W are specimen thickness and width respectively;a is the crack length.
The test results are shown in Figs.3-4.The crack growth rates of 18Ni(250)under different load ratios are relatively close to each other before unstable growth.And if fracture toughness is taken to be unstable crack growth according to widely accepted assumptions,the fracture toughness of 18Ni(250)can approach to 120 MPa,which shows a very good fracture resistance.The test data of 18Ni(350)exhibit similar tendency but the unstable growth comes much earlier than 18Ni(250).
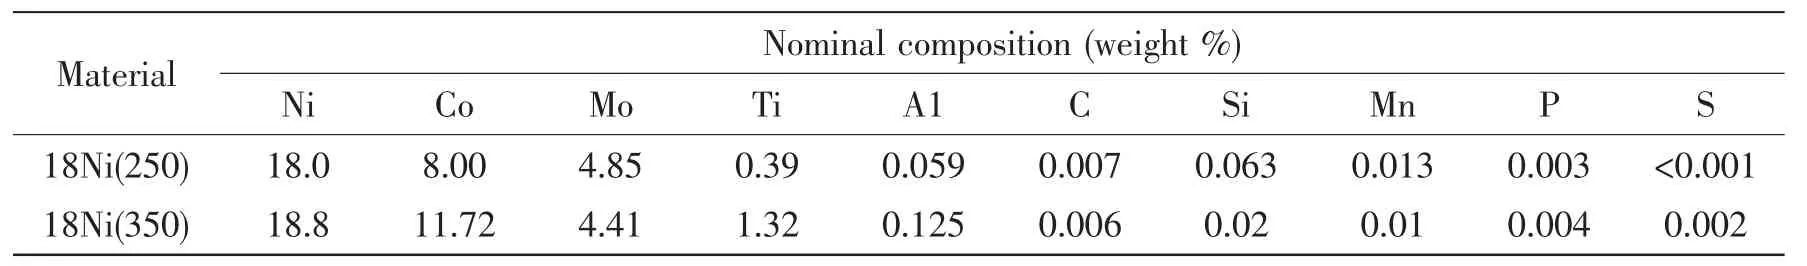
Tab.1 Chemical composition of 18Ni(250)and 18Ni(350)(wt.%)

Tab.2 Mechanical properties of 18Ni(250)and 18Ni(350)
where σyis yield strength; σbis ultimate tensile strength;E is Young’s modulus; υ is Poisson’s ratio;A(%)is elongation;Z(%)is area reduction.
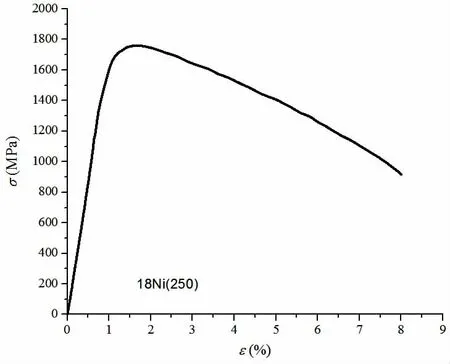
Fig.1 Stress strain curve of 18Ni(250)
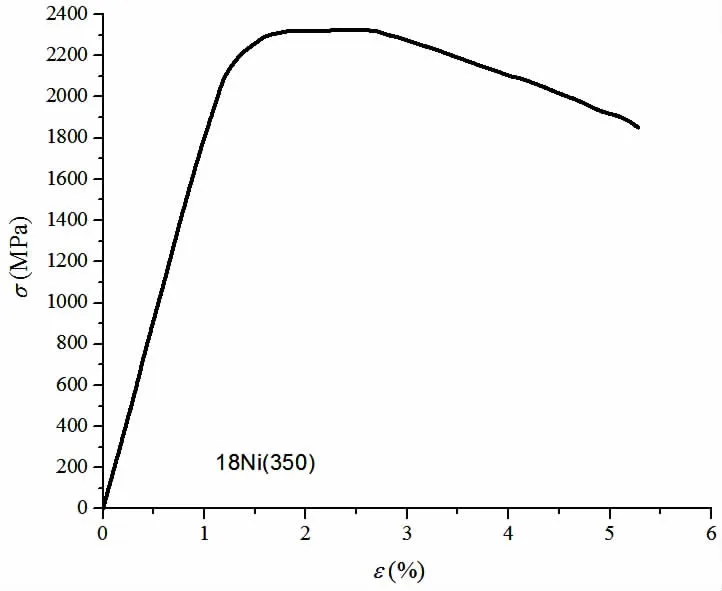
Fig.2 Stress strain curve of 18Ni(350)
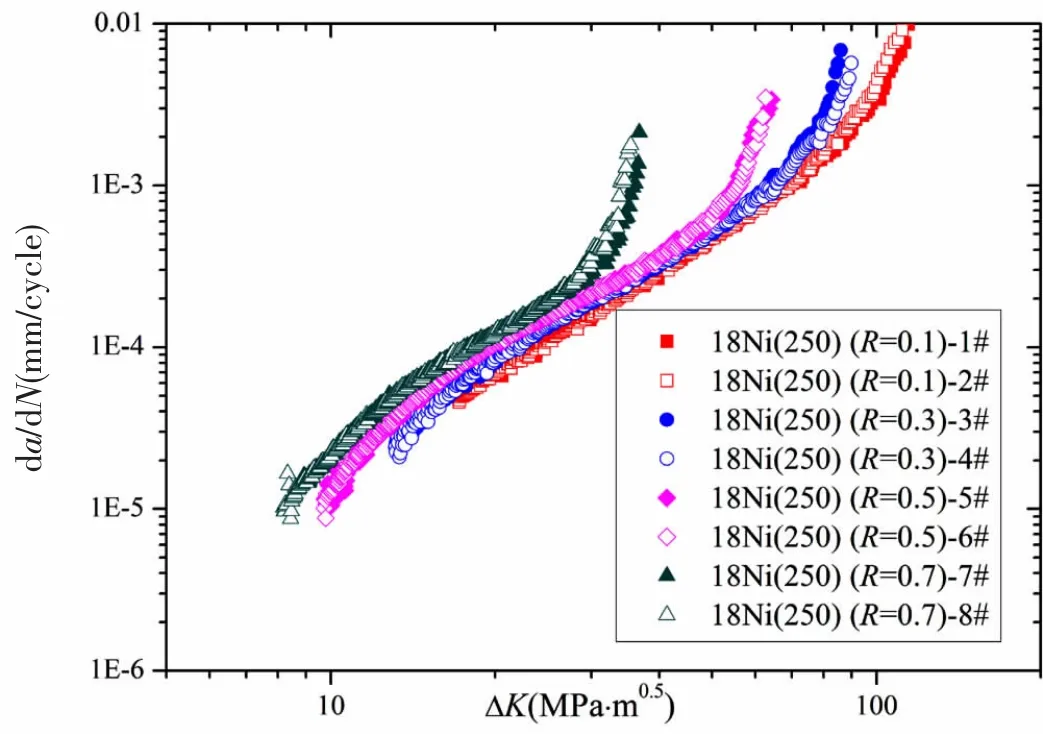
Fig.3 Crack growth experimental data of 18Ni(250)
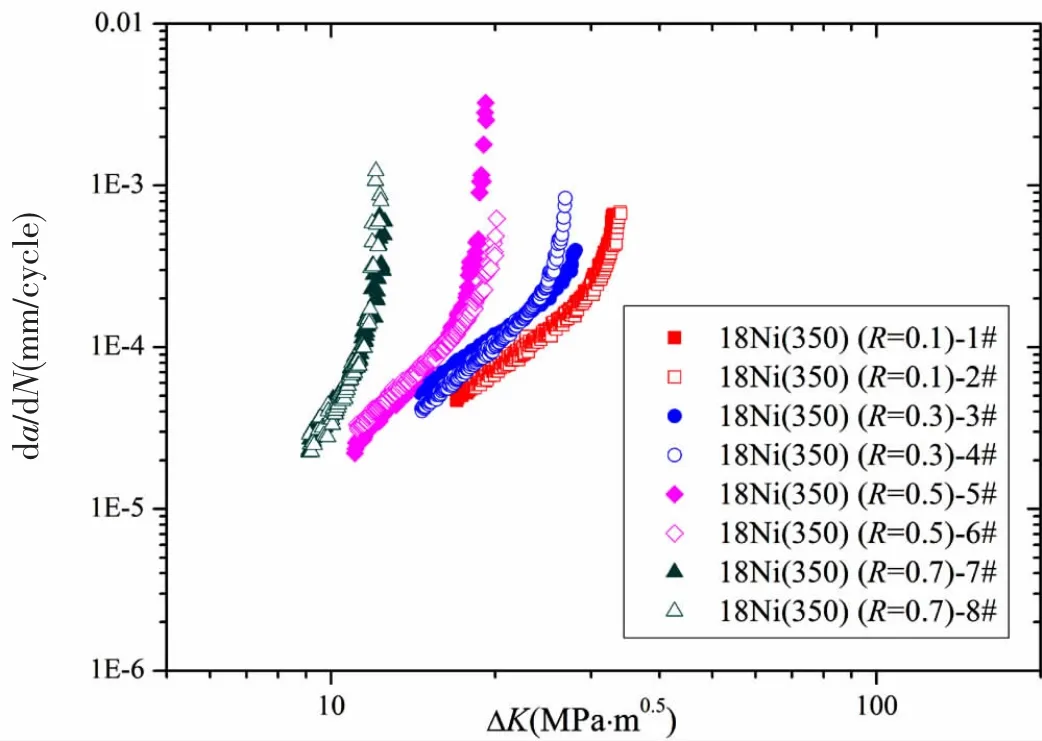
Fig.4 Crack growth experimental data of 18Ni(350)
To obtain the full view of the crack growth characteristic of 18Ni(250)and 18Ni(350)under different load ratios,proper tests for threshold value should be conducted.As for the threshold stress intensity factor range,ΔKth,the tests have not been conducted by the authors,which can be further done in the future’s work,and little research can be found in literature.Vosikovski[5]proposed an empirical formula for steels.Farahmand and Nikbin pointed out that the value of ΔKthfor a wide range of alloys was found to be proportional to the final elongation,εf,and established an empirical relationship at zero load ratio[6].However,it is doubtable for the simplified equations in prediction of ΔKthof extreme high strength steel.It is more convincing in the analysis[7]that the strength dependence of the threshold stress intensity exhibits two regimes of behavior and ΔKthdecreases with increasing steel yield strength,sharply at the low strengths and more gradually in the high to ultra-high strength regime.Their results are obtained by test data of steels with different strength levels under variable environments.More results show that the ΔKthdeclines strongly with increasing strength in the lower strength regime,with a reduced dependence on strength or perhaps a plateau at Syabove about 1 300 MPa.The fitting curve from the data shown by circles[7]in Fig.5 is one of the strength dependence curves for ΔKthof steels expressing above tendency.The trend can be seen in general from the comparison between crack growth data of 18Ni(250)and 18Ni(350)in Fig.6,in which the data are closer in lower stress intensity factor ranges.
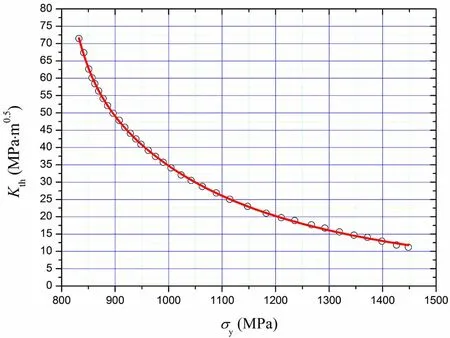
Fig.5 One of the strength dependence curves for ΔKthof steels[6]
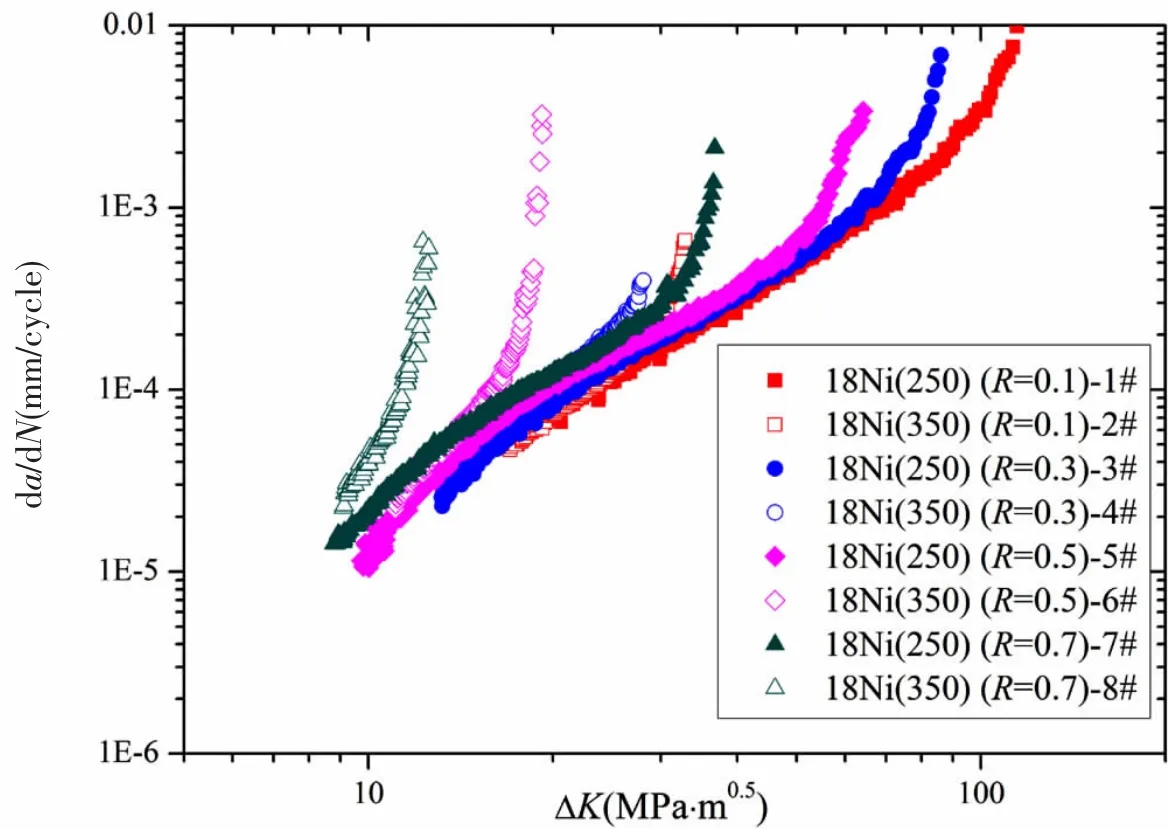
Fig.6 Comparison between crack growth data of 18Ni(250)and 18Ni(350)
2 Crack growth rate model for analysis
The unified crack growth rate model[4]used in prediction analysis can be expressed by the following equations:
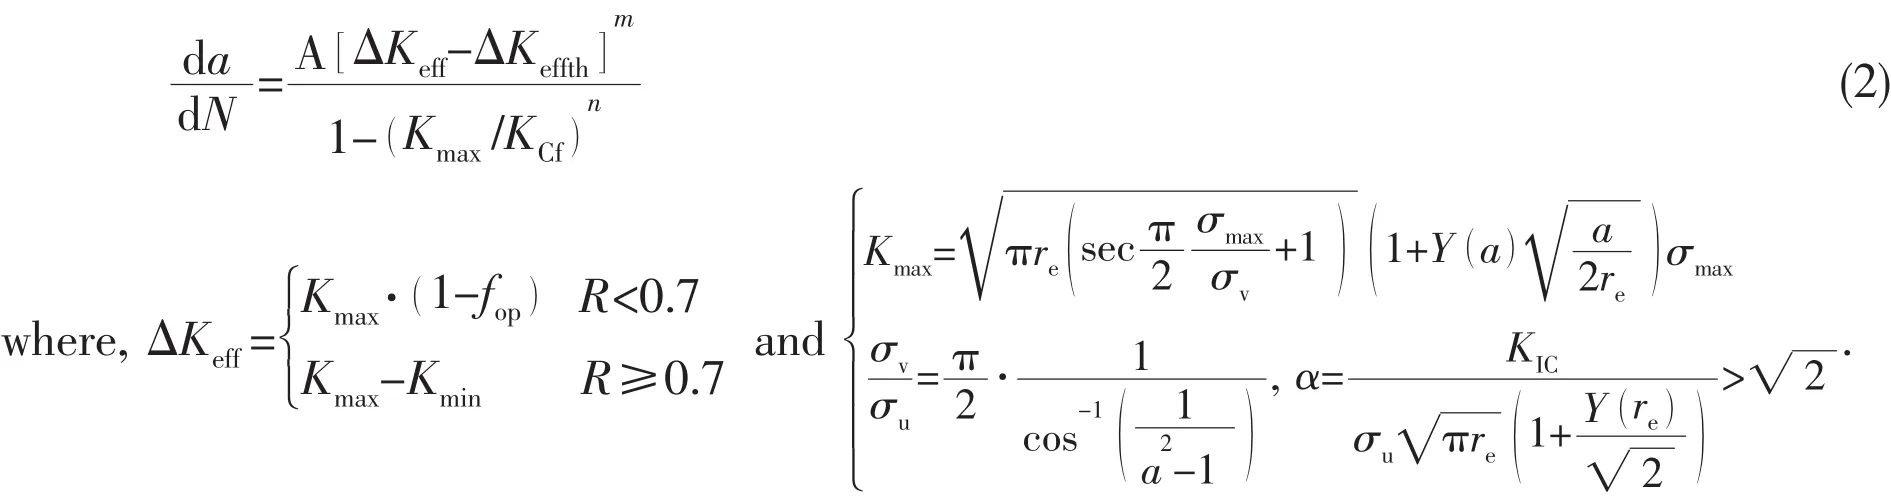
Considering this phenomenon that at higher load ratio the experimental data are closure free,we propose that the term ΔKeffin the constitution relation is expressed by the above piecewise function.And Newman’s function[8]for fopis modified by introducing a constraint factor α′as follows:
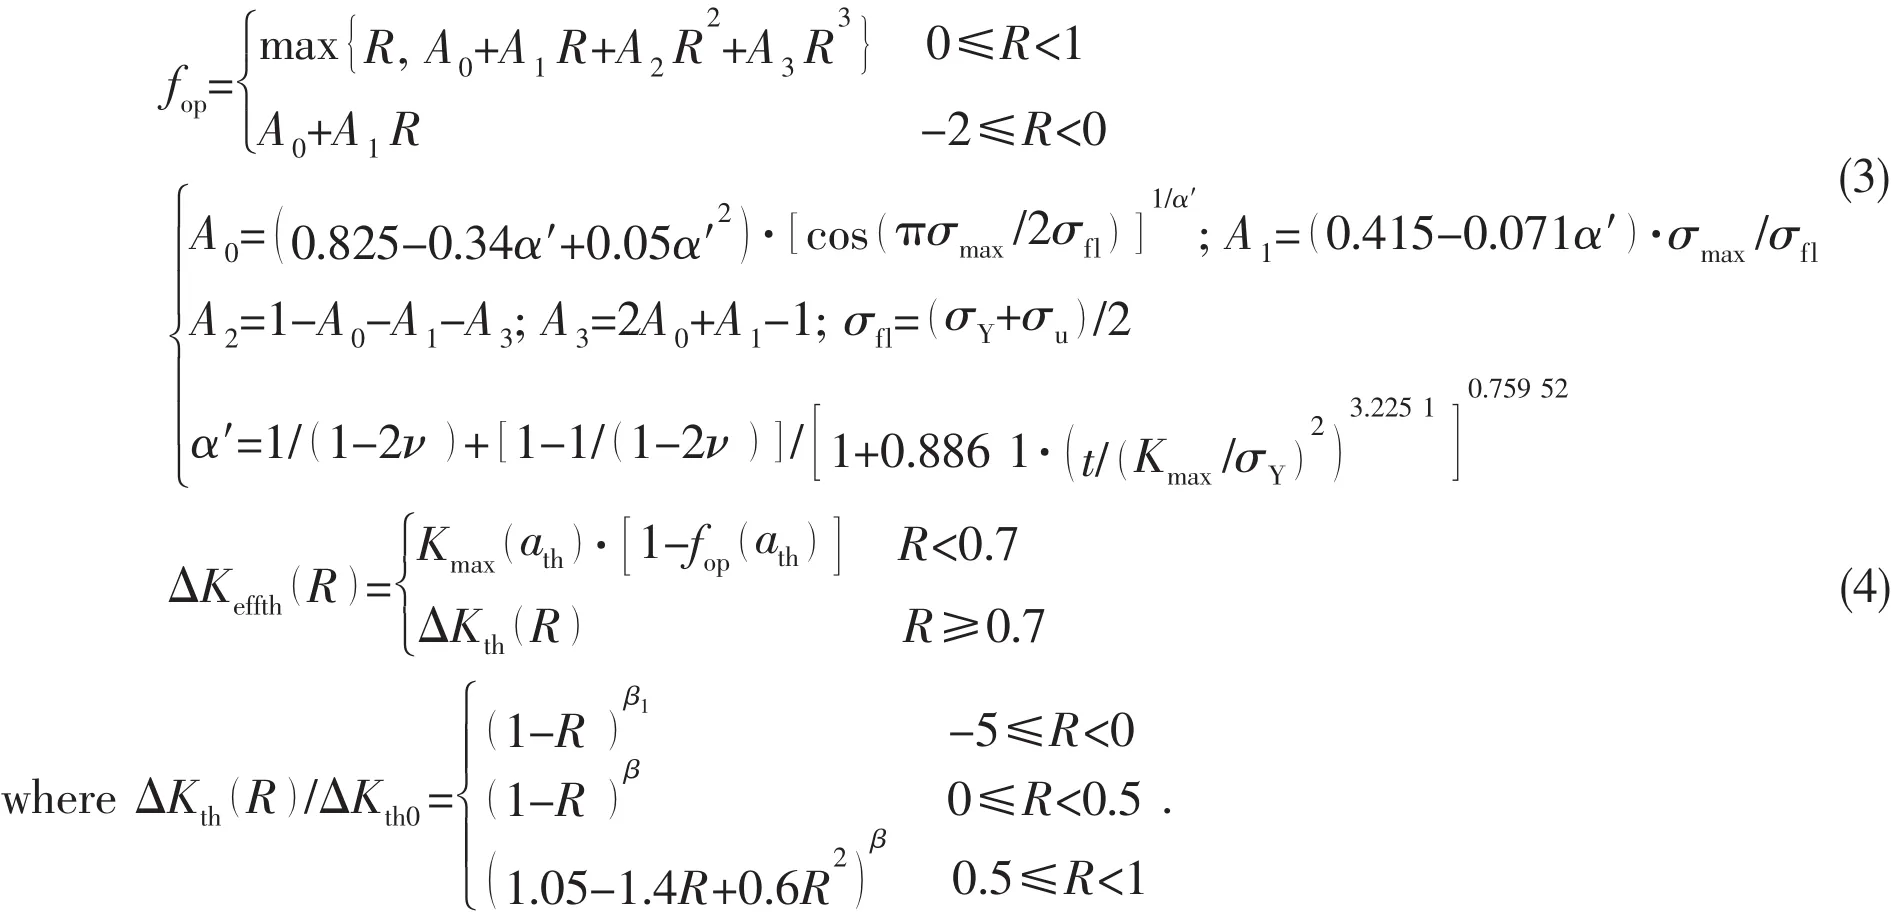
Eq.(4)can be used to determine the value of ΔKeffthand we recommend the values of β and β1are 0.3 and 0.5,respectively for steels.And A is a material-and environmentally-sensitive constant of dimensions(MPa)-2;m is a constant representing the slope of the correspond-ing fatigue crack growth rate curve;n is the index indicating the unstable fracture;KIcis the plane strain fracture toughness of the material;KCfis the fracture toughness of the material under fatigue loading;reis an empirical material constant of the inherent flaw length of the order of 1 μm;a is the modified crack length which is equal to replus the actual crack length;σmaxis the maximum applied stress;σminis the minimum applied stress;Y()a is a geometrical factor;Y re()is a geometrical factor when a is equal to re;R is the stress ratio(=σmin/σmax);ΔKthis the threshold value of stress intensity factor range;athis the threshold value corresponding to ΔKth;ΔKeffis the effective range of the stress intensity factor;ΔKeffthis the effective range of the stress intensity factor at the threshold level;Kopis the stress intensity factor at the opening level;α′is the crack tip stress/strain constraint ratio,which is 1 for the plane stress state and 1/(1-2v)for the plane strain state.The effect of n is significant only in the unstable propagation region;a constant value of 6 is recommended for a quick and simple engineering analysis.Eq.(4)can be used to determine the value of ΔKeffth.But the prediction error in the unstable region reflects the inaccuracy of the assumption of KCf=KIC.
All of the parameters in the equations above have to been determined by test data or empirical methods for simplicity.As the foundation of life estimation method for full-oceandepth manned cabin under different loading conditions,the prediction model will be validated for 18Ni(250)and 18Ni(350)presently.Taking the crack growth data of 18Ni(250)in R=0.3 and 18Ni(350)in R=0.1 as the basic data for curve fitting according to the methods described in Cui et al(2013),the parameters A and m in Eq.(2)can be determined,which are regarded as material constants.The threshold stress intensity factors in load ratio R=0.3 for 18Ni(250)and R=0.1 for 18Ni(350)are determined based on Eq.(4)and Fig.5.Figs.7-8 show the comparison between test data and fitting curves respectively for 18Ni(250)and 18Ni(350).All the parameters will be used for predictions of crack growth rates under other load ratios.Figs.9-10 illustrate the comparisons between prediction curves and test data.Good agreements can be observed,which shows the applicability of the prediction model on extra high tensile strength steels 18Ni(250)and 18Ni(250).
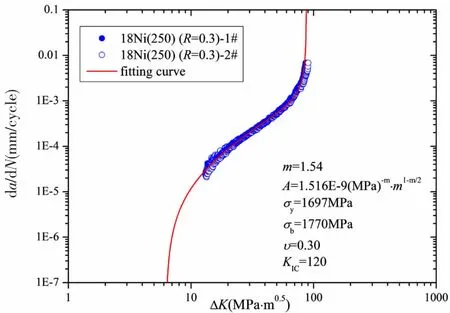
Fig.7 Model parameters determination of crack growth rate of 18Ni(250)based on the experimental data in R=0.3
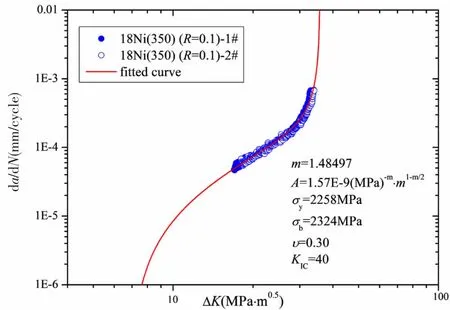
Fig.8 Model parameters determination of crack growth rate of 18Ni(350)based on the experimental data in R=0.1
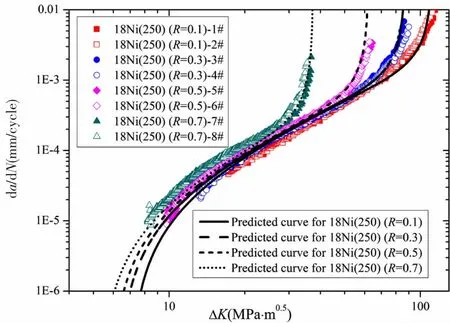
Fig.9 Comparison between the experimental data and predicted curves of 18Ni(250)crack growth rates
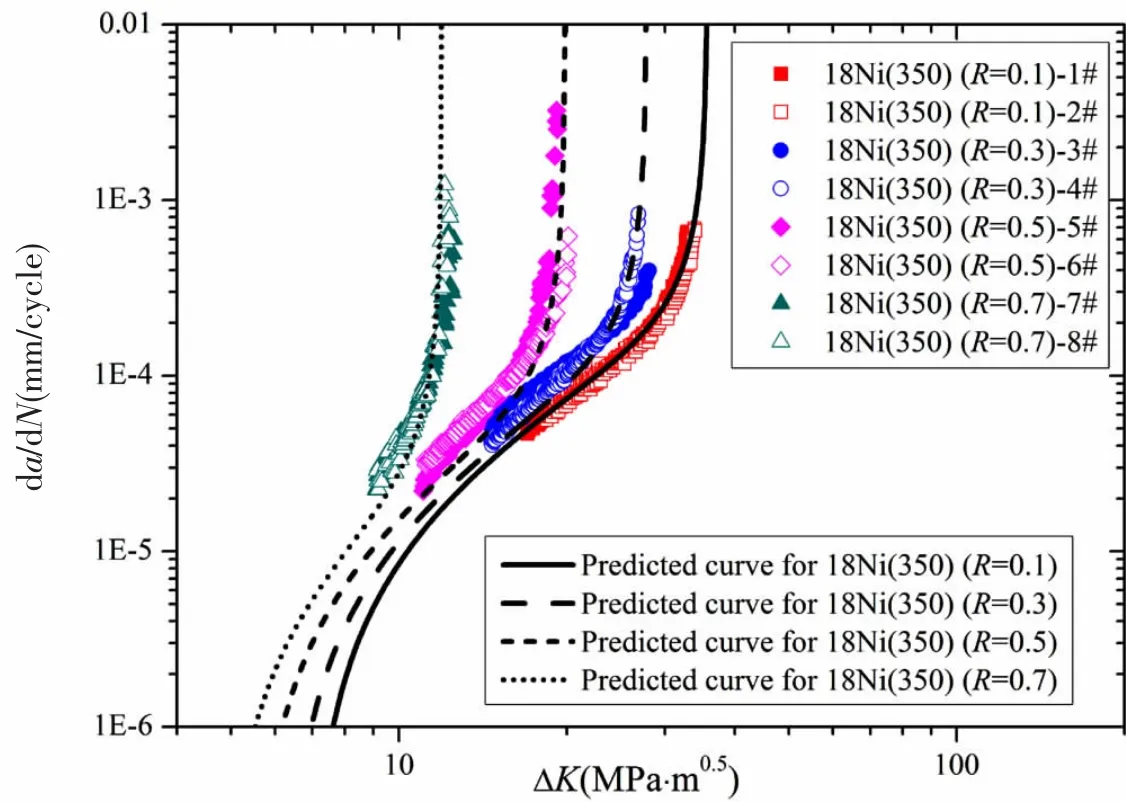
Fig.10 Comparison between the experimental data and predicted curves of 18Ni(350)crack growth rates
3 Concluding remarks
(1)18Ni(250)and 18Ni(350)are two types of extreme high strength steels as candidate materials used for full-ocean-depth manned cabins and water ballast cabins.Their crack growth test results are presented,which will be important data resources for life estimation of manned cabins and water ballast cabins.
(2)The crack growth rate prediction model together with parameters determination methods proposed by authors are validated by the test data of 18Ni(250)and 18Ni(350).Comparisons between prediction curves and test data show the applicability of the model on the two materials.
(3)The crack growth rate prediction model can be the theoretical basis in fracture-mechanics based life estimation of manned cabins and water ballast cabins.
Acknowledgments
This work is supported by the General Program of National Natural Science Foundation of China‘Study on the Design and Life Calculation Method for the Maraging Steel Sphere of Full-ocean-depth Manned Submersible’(Grant No.51679133);the State Key Program of National Natural Science of China‘Structural Reliability Analysis on the Spherical Hull of Deepsea Manned Submersibles’(Grant No.51439004).
杂志排行

船舶力学的其它文章
- Dynamic Stability of Liquefied Cargo Ship in Waves
- Investigation on Time Domain Motions for Ship and Floating Structure and Coupled with Nonlinear Sloshing
- Overset Simulations of Submarine’s Emergency Surfacing Maneuvering in Calm Water and Regular Waves
- A Revised Method for Predicting Added Waves Resistance Based on Comparison of Theoretical and Empirical Results for VLCC Hull Forms
- 3D Nonlinear Hydroelastic Response and Load Prediction of A Large Bulk Carrier in Time Domain
- Strength Characteristics of Maraging Steel Spherical Pressure Hulls for Deep Manned Submersibles