Statistical Analyses for Quality of English Simulated Testing Paper
2017-03-14陈爽


Abstract:Language testing emerges in the development of language teaching and they are closely related to each other. This little study is about the qualitative and quantitative of a selected paper, a simulation testing paper of junior three. Evaluating test validity, reliability, item difficulty and item discrimination with statistical methods is systematic, objective and scientific.
Key words:validity; reliability; item difficulty; item discrimination; statistical methods
1. Introduction
1.1 Purpose of the Study
As a type of measurement, language testing is a process of quantifying the characteristics of personsaccording to explicit procedures and rules. Carroll(1968) provides the definition of psychological or educational test as aprocedure designed to elicit certain behavior from which one can make inferences about certain characteristics of an individual Bachman (1990:20). The purpose of language paper testingis to get the knowledge and feed back the result of teaching so that to improve the teaching effect.
1.2 Objective and Significance
The study is to examine the quality of a selected junior 3 stimulated English test paper and to analyze the validity and reliability of each part. To achieve the objectives, SPSS and Excel which are two kind of software had been used to conduct statistical analyses.
1.3 Research Question
1.3.1 To what extent is the test valid?
1.3.2 How about the test reliability?
1.3.3 What is the item's difficulty and discrimination level?
2. Research Method
2.1 Subject
Thirty students in junior 3 from the same class of a middle school in Urumqi. The test paper is a stimulated test paper of senior high school entrance exam, which shares the same question types and difficulty of the real one. All the student did the test without cheating.
2.2 Materials
Syllabus:
This tests is according to the English Syllabus for Compulsory Education in China, in order to let the students achieve the listening, speaking, reading writing, also the pronunciation, vocabulary and basic grammar. Table 3.1 Format of the senior high entrance paper.
The test is consisting of 3 sections with a total number of 70 items: listening comprehension with 20 items weighing 30%, grammar & vocabulary with 30 items weighing 30% , and reading comprehension with 20 items weighing 40%. Its a timed test within approximately 100 minutes to administer. All the items are objective, generally known as multiple-choices questions with 3 or 4 options marked A, B, C or A, B, C, and D after each of the branch.
2.3 Data collection
The answer of each examinee for each item is also recorded in the file. The file provides the numerical data of the research and the 30 examinees answer for all the items are accepted as the original data for comprehensive analysis.
2.4 Instruments for Analyses
The main instrument used in this research are Excel and SPSS. The Output Viewer contains the result of all statistical analyses and graphical displays of data.
3. Results and Discussion
3.1 Reliability
The selected test paper consists of objective tests and subjective tests. This thesis just discussing about the objective tests parts. The objective tests are multiple-choice questions which can be marked without the examiners personal judgment. Therefore, here we use Alpha model to compute the reliability coefficient of the data which has been obtained. Alpha is often used to compute internal reliability and also Cronbachs coefficient alpha is widely used in computing reliability coefficient.
Table 4.1 Reliability Statistics
According to Table 4.1, the Cronbachs Alpha is 0.490, the Cronbachs Alpha Based on standardized items is 0.429, in comparison with the table of internal consistency (reliability) and Cronbachs Alpha (George, D. &Mallery, P. 2003, Kline,P.1999), it is obvious to know that if Cronbachs Alpha is within the range between 0.5 and 0.6; it indicates that the internal consistency is poor. If Cronbachs Alpha is within the range between 0.8 and 0.9, it indicates that the consistency is good.If Cronbachs Alpha is equal to or greater than 0.9, it indicates the consistency is excellent. According to this, we can conclude that the reliability of this test paper is very poor.
3.2 Validity
In validity analyses, factor analysis is a statistical approach that can be used to analyze interrelationships among a large number of variables and to explain these variables in terms of their common underlying dimensions. From the above Table 4.1 we can infer that the test contains two main parts: language use and language knowledge.
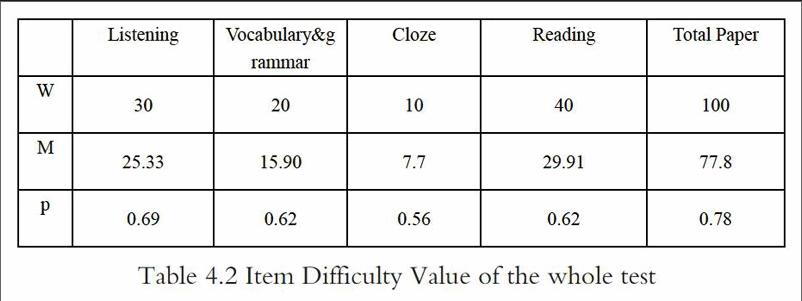
Table 4.2 Item Difficulty Value of the whole test
(In this table “W” represents the total points of each item, “M” represents mean of each item and “P” represents each item difficulty)
This test paper is a simulated paper for junior 3 students, who will soon participate the senior high school entrance examination. Item with difficulty values between 0.30 and 0.70 will be most effective (difficulty values above 0.71 are considered as easy items and difficulty values above 0.90 are very easy items)(Heaton,1991) To sum up in conclusion, it is obvious that the content validity of the test is low.
4. Quality of the Test
4.1 Discussion of Central Tendency
Table 4.1:The Central Tendency of the whole test
The mean score for each component of the three components is calculated, as well as for the whole test. The mean is the efficient measure of central tendency (Heaton,1991). We can see from Table 3 that the mean of the whole test is 77.8, but some of the bar graph is not accorded with normal distribution. It shows that the test paper is not convincible to some extent.
4.2 Discussion of Dispersion
The mean by itself enables us to describe an individual students score by comparing it with the average set of scores obtained by a group, but it tells nothing at all about the highest scores and the spread of scores (Heaton,1991).
The standard deviation is a way of showing the spread of scores. It measures the degree to which the group of scores deviates from the mean. Which simply describes the gap between the highest and lowest marks and ignores the information provided by all the remaining scores (Heaton,1991).
Table 5.1 Descriptive Statistics of the test
From Table 5.1, it is clear to see that the Standard Deviation of the score of the whole test is 7.8276, which suggests that the English proficiency level of the students have a distinct difference to each other.
4.3 Analysis of Item Difficulty
Item difficulty as proportion correct and proportion incorrect for 70 multiple-choice items(N=30 examinees)
Noticing that the higher the difficulty is, the lower the proportion correct and the higher the proportion incorrect. Thus, the difficulty index, “p”, is inversely related to the actual difficulty of items. In general, item difficulty is most appropriate when it approaches the mid-point of the difficulty range. Thus items No.44 in the table can be said to have the most appropriate difficulty for this particular sample of students(50%). And the distribution of the difficulty value of the objective items is shown in table 5.2.
Table 5.2
Items with difficulty values between 30% and 70% will most effective. It is obvious that 53 items with difficulty value between 30% to 70%, so they are the most effective items in the test. In addition, the difficulty values of 16 items above 71% are considered as easy items. These easy items or very easy items constitute 22% of the objective tests. But one of the items is extremely difficult (<30%) that can not get positive effect in the test and cannot be accepted.
4.4 Analyses of Item Discrimination
In general, we prefer to compare responses of examinees that are strong in the ability being measured with those who are weak in this part. It is statistically most efficient to compare the top 27percent with the bottom 27percent on the basis of total score on the test (Woods, et al. 2000:175). There are 30 examinees in this study, so there should be 8 examinees in the upper group and 8 in the lower group. Then find the difference in the proportion passing in the upper group (high scoring group ) and the proportion passing in the lower group (low scoring group ) (Heaton 2000:180). And the divide this difference by the number of examinees in one group:
D= Discrimination Index
U=Number of examinees in one group
L=Lower group
Here takes item 66 as an example to illustrate. The discrimination index for item 66 is 0.67 which is considered good discrimination. Discrimination indices can range from +1(=an item which discriminates perfectly) through 0(=an item which does not discriminate in any way at all) to -1 (=an item which discriminates in entirely the wrong way). Thus, if all of the 9 examinees in the upper group answered item 66 correctly and all 9 examinees in the lower group got the wrong answer, the item would have an index of discrimination of 1.0. Otherwise, the discrimination index would be 0. However, if none of the 9 examinees in the upper group got a correct answer but in the lower group they got, the item would have a negative discrimination, shown by -1.0.
According to the result it has been got above, the summarized table is in Table5.2
Table 5.2
The 3 items with discrimination index 0.50 or above are considered high discrimination item. The 16 items with discrimination index 0.30 or above are not acceptable. And the 25 items whose discrimination indices are between 0.20 and 0.30 are questionable and needs improving. To items with discrimination index 0.20 or below, especially to items showing 0 or negative discrimination that it would be tried to amend them.
5. Conclusion
5.1 Findings
T'he findings of the research have answered the questions raised in Chapter One. The face validity and the content validity of the test are relatively bad based on the consulting of textbooks and the teaching syllabus, and the interview with experienced teachers and some students taking the test. Item discrimination is affected by item difficulty, not showing very satisfactory results. Therefore, item difficulty and item discrimination still need improving.
5.2 Limitations and suggestions
Since the exam-oriented education has prevailed, the stimulated test are unlimited. Through this study, it is obvious to see that the reliability and validity of this kind of paper is barely satisfactory. It is a very sincere suggestion that the editors who compile the test papers can pay more attention on the reliability and validity to the test.
【References】
[1] Li, X.J. The Science and Art of Language Teaching[M]. Hu Nan Education Press, 2001.
[2] McNamara, T. Language Testing[M]. Shanghai Foreign Language Education Press, 2003.
[3] Dato, N.M.et al. Statistical Test Theory for the Behavioral Sciences[M]. London: Chapman & Hall, 2008.
[4] Oller, J.W. Language Test at School[M]. London: Longman Group Ltd, 1979.
[5] Lado, R. Language Testing: The Construction and Use of Foreign Language Test[M]. London: Longmans,1961.
[6] Rudner, L.M. Questions to ask when evaluating tests. Practical Assessment, Research & Alderon, J.C. et al. Language Test Construction and Evaluation[M]. Foreign Language Teaching and Research Press, 2000.
[7] Davies, A. Dictionary of language Testing[M]. Foreign language Teaching and Research Press, 2002.
[8] Huang, A. Testing for Language Teachers[M]. Cambridge: Cambridge University Press, 2003.
【作者簡介】
陈爽(1989—),女,汉族,新疆人,新疆师范大学硕士研究生在读,主要研究方向:外国语言学及应用语言学。