Seasonal Variation of Major Elements in South Lake Cyohoha, Rwanda
2014-03-07JeandeDieuBazimenyeraFuQiangandThophilaNiragire
Jean de Dieu Bazimenyera, Fu Qiang, and Théophila Niragire
1School of Water Conservancy and Civil Engineering, Northeast Agricultural University, Harbin 150030, China
2Department of Rural Development, Kigali Independent University, Kigali 999051, Rwanda
3Department of Accounting, Independent Institute of Lay Adventists of Kigali, 999051 Kigali, Rwanda
Seasonal Variation of Major Elements in South Lake Cyohoha, Rwanda
Jean de Dieu Bazimenyera1,2, Fu Qiang1*, and Théophila Niragire3
1School of Water Conservancy and Civil Engineering, Northeast Agricultural University, Harbin 150030, China
2Department of Rural Development, Kigali Independent University, Kigali 999051, Rwanda
3Department of Accounting, Independent Institute of Lay Adventists of Kigali, 999051 Kigali, Rwanda
The paper analyzed the seasonal variation of the concentrations of Cr, Mn, Al, N, P, As, Ba, Ca, Cu, Fe, Mg, and K in South Lake Cyohoha water using spectroscopic technique. Water samples were taken monthly at Ngenda, Karehe and Nyamabuye stations from January 2009 to December 2010. The results showed that the concentrations of aluminum, nitrogen, potassium, arsenic, phosphorous, manganese, chromium, barium and copper were high during the raining season and low during the dry season, while calcium, iron and magnesium varied independently with seasonal change. The results of conductivity and pH also confirmed the effects of seasonal change on the quality of water in the South Lake Cyohoha since the highest value of conductivity was found during the raining season, while the smallest was observed during the dry season, for pH the highest number was noticed during the dry season and the lowest during the raining season.
seasonal variation, concentration, quality, South Lake Cyohoha
Introduction
Surface water is an essential component of the earth's hydrosphere and an indispensable part of all the terrestrial ecosystems (Tovar and Rodriguez, 2004). An adequate supply of water of suitable quality makes a major contribution to economic and social development as it is needed in all aspects of life. However, many parts of the world are facing the pollution and scarcity of fresh water (Lorber, 2002). The same problems have been found in South Lake Cyohoha, which is located in east province, characterized by high temperature, less rainfall and lack of water compared with other parts of the country especially, during the long dry season from June to September.
Precipitation patterns in east Africa where Rwanda is located are more variable and historical records indicated that there had been an increase in rainfall over the last century and under intermediate warming scenarios, parts of equatorial east Africa would likely experience 5%-20% increased rainfall from December to February and 5%-10% decreased rainfall from June to August by 2050 (Hulme et al., 2001).
This will have negative impacts on the availability of water resources, food and agricultural security,human health, tourism, coastal development and biodiversity (Boko et al., 2007). Therefore, due to the increasing rainfall during the growing and raining season, pesticides applied to farm fields and roadsides and homeowners' lawns run off into local streams and rivers or drain down into groundwater, contaminating fresh water that is used for human consumption and also for the life sustenance of the fish living in Lake as Lake (Burton et al., 2001). The same situation is happening in South Lake Cyohoha.
Due to the population pressure, land degradation, soil erosion, pressure on natural resources, massive deforestation, overgrazing, sewage systems, high concentrations of manure which is stored in open lagoons and eventually sprayed on farmland and in most cases which is more far than local fields can absorb, chemical fertilizers that contain "nutrients" such as nitrates, phosphates and potassium, deposition of atmospheric nitrogen (from nitrogen oxides), release of waste in the lake etc not only facilitate the sedimentation, but also over-stimulated the growth of aquatic plants such as water jacinth and algae in all parts of the lake and contributed to the pollution of water as well as to the decrease of water level and the width of South Lake Cyohoha. For this reason, a study to determine the concentrations of major elements in South Lake Cyohoha, and their relationship with seasonal variation was carried out in the period of 2009-2010 and the results were presented and discussed in this paper.
Materials and Methods
Site description
South Lake Cyohoha (also called Tshohoha South or Lac Cyohoha Sud) is situated 49 kilometers south of the approximate center of Rwanda and 53 kilometers south from the capital Kigali City. It has 100 km2areas around, with an approximate population of 1 325 697 and an average elevation of 1 553 m above the sea. The main Rwandan part of that lake is in the district of Bugesera which is one of the seven districts constituting the eastern province of Rwanda. It is shared by two neighbor countries Rwanda and Burundi with approximately 630 hm2for Rwandan part. Note that Rwanda is located in the east of central Africa between 1°04′ and 2°51′ latitude south, and between 28°45′ and 31°15′ longitude east, stretching over a surface area of 26 338 km2. Rwanda enjoys a temperate continental tropical climate.
In the course of the year, temperatures vary between 16° and 17℃ in the high altitude region, between 18° and 21℃ in the central Plateau, and between 20° and 24℃ in the lowlands of the east and west. Annual rainfall varies between 700 mm and 1 400 mm in the lowlands of the east and west, between 1 200 mm and 1 400 mm in the central Plateau, and between 1 400 mm and 2 000 mm in the high altitude region. Fig. 1 shows more details of the study area.
Data collection
Three sampling stations Ngenda, Nyamabuye and Karehe were established based on the accessibility, location, number of population and activities carried out in the catchment area. Note that the main activities carried out near the lake are agriculture and fishing with few commercial activities and agricultural industries. Water samples were collected monthly from those stations mentioned above in the period of two years, from January 2009 to December 2010, every time four samples were taken, two at the lake shore and two at the distance of 5 to 10 m from the lake shore, with the depth of about 60 cm from the surface water. After collection, water samples were acidified with concentrated Nitric acid and kept in polyethylene bottles with tight sealing caps deemed suitable for collection and storage of samples. There have been much care to prevent cross contamination, during sample collection and those bottles were rinsed with demonize-distilled water and sample water before taking the sample. Collected water samples were filtered though millipore Ap-15 pre-filter and subsequently to 0.45 µm HA millipore filters and finally, they were analyzed through atomic mass spectroscopy.

Fig. 1 Location of South Lake Cyohoha in map of Rwanda and sample stations
Atomic mass spectrometry consists of an ion source, a mass analyzer, and a detector. Atoms' identities are determined by their mass-to-charge ratio (via the mass analyzer) and their concentrations are determined by the number of ions detected (Sparkman, 2000). The principle consists of ionizing chemical compounds to generate charged molecules or molecule fragments and measuring their mass-to-charge ratios. A sample is loaded onto the mass spectrometry instrument, and undergoes vaporization, next the components of the sample are ionized by impacting them with an electron beam, which results in the formation of charged particles (ions), and then ions are separated according to their mass-to-charge ratio in an analyzer by electromagnetic fields. Ions are detected usually by a quantitative method and ion signal is processed into mass spectra. This method has been used by many other environmentalists (Sparkman, 2000; Samecka-Cymerman and Kempers, 2001; Filgueiras et al., 2002). In addition to the laboratory analyses, there were other field's measurements, such as pH and electroconductivity. Electro-conductivity was measured using a YSI 85D oxygen/temperature/conductivity meter and pH was determined using a hand held pH meter. GIS (arcmap) was used to produce the study area map.
Results
The results presented in Tables 1 to 3 showed that the concentrations of nitrogen, phosphorous, potassium, arsenic, manganese, chromium, aluminum, barium and copper increased during the raining season and decreased during the dry season. Nitrogen concentration was high during the short raining season from September to October at all stations with the concentration in mg • L-1which varieD between 7.8 and 9.5, while the lowest concentration of 3.7 was obtained at Nyamabuye station, during the long dry season. Phosphorous concentration was high during the two raining seasons of April-May and September-Octoberwith the concentration in mg • L-1of 0.8, whereas the lowest concentration of 0.4 was found during the short dry season in December. Potassium followed the same pattern as phosphorous but with different concentrations with the lowest concentration in mg • L-1which varied between 5.2 and 5.4, during the short dry season in December, while the highest concentration was between 7.4 and 9.2, during the short raining season from September to October. For arsenic the highest concentration was found during the two raining seasons of March-May and September-October with the concentration in mg • L-1which varied between 0.07 to 0.08, while the lowest value of 0.04 was found during the two dry seasons of January-February and August.
The results of conductivity and pH in all the stations in Table 4 also showed the seasonal change effects as the lowest number of pH of 5.6 was obtained during the raining period while the highest of 8.5 was found during the dry season in August. It was the same for conductivity with the highest number in mho • cm-1, of 2 430 during the raining season in April and the lowest of 2 205, during the dry season in August.

Table 1 Concentration of major elements at Ngenda Station from January 2009 to December 2010

Table 2 Concentration of major elements at Nyamabuye Station from January 2009 to December 2010
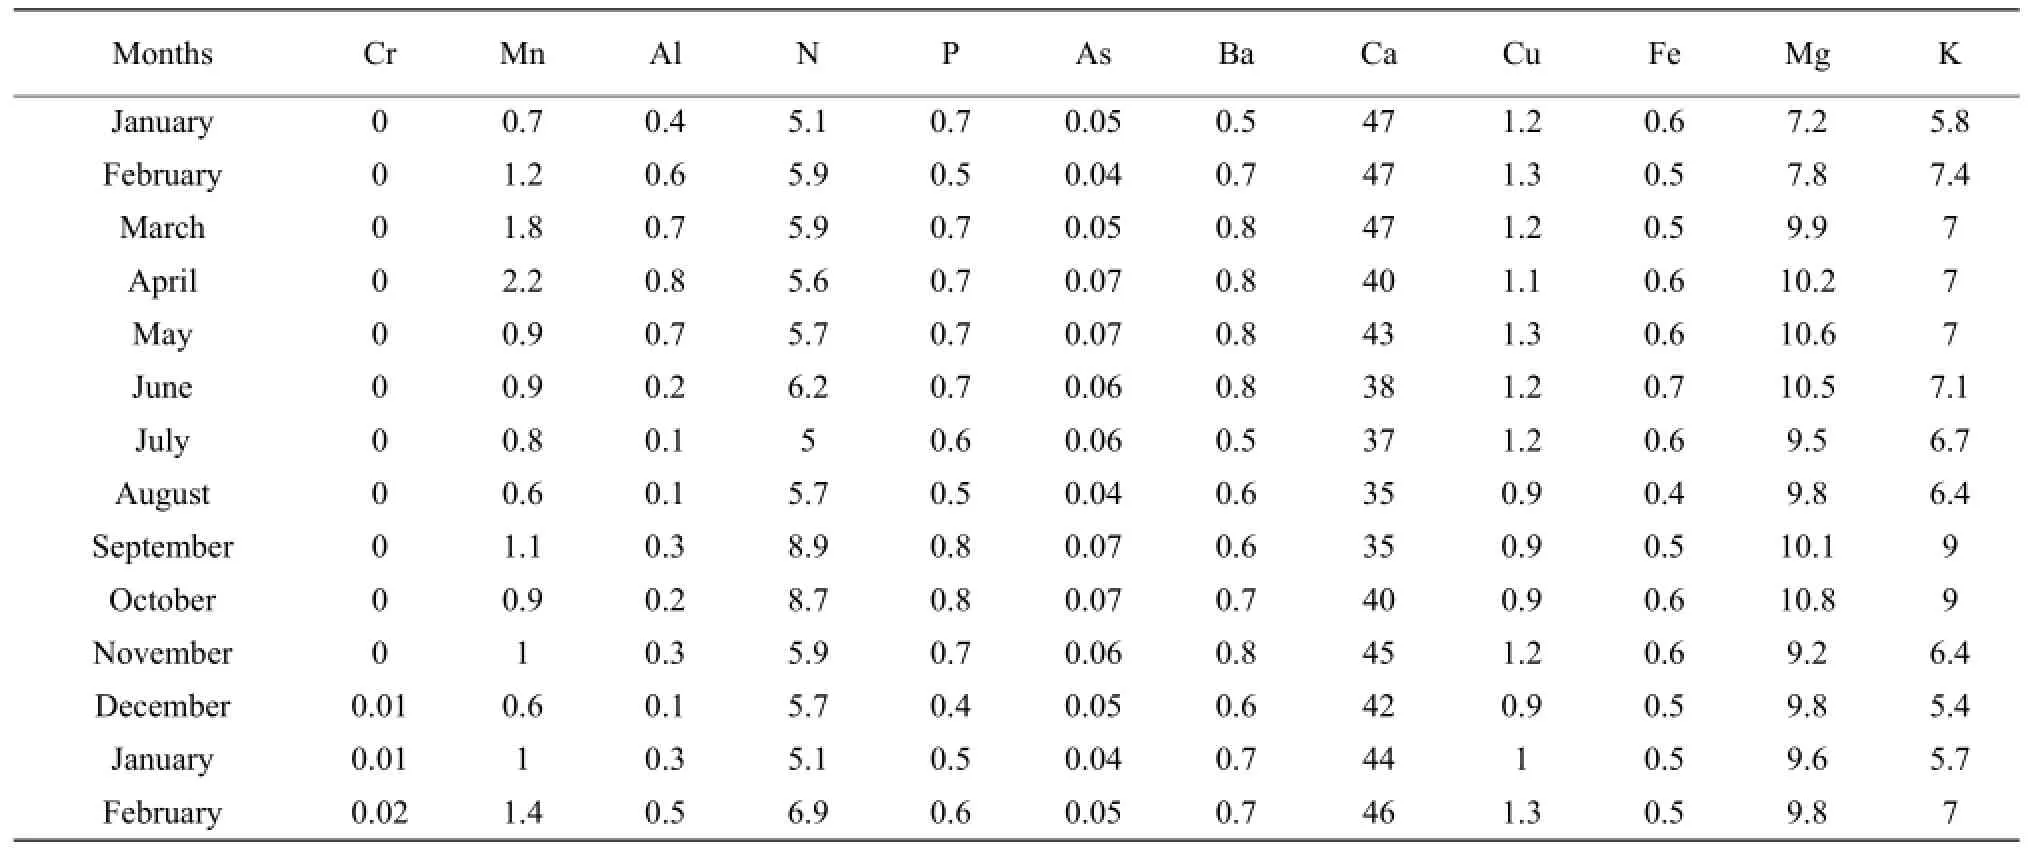
Table 3 Concentration of major elements at Karehe Station from January 2009 to December 2010
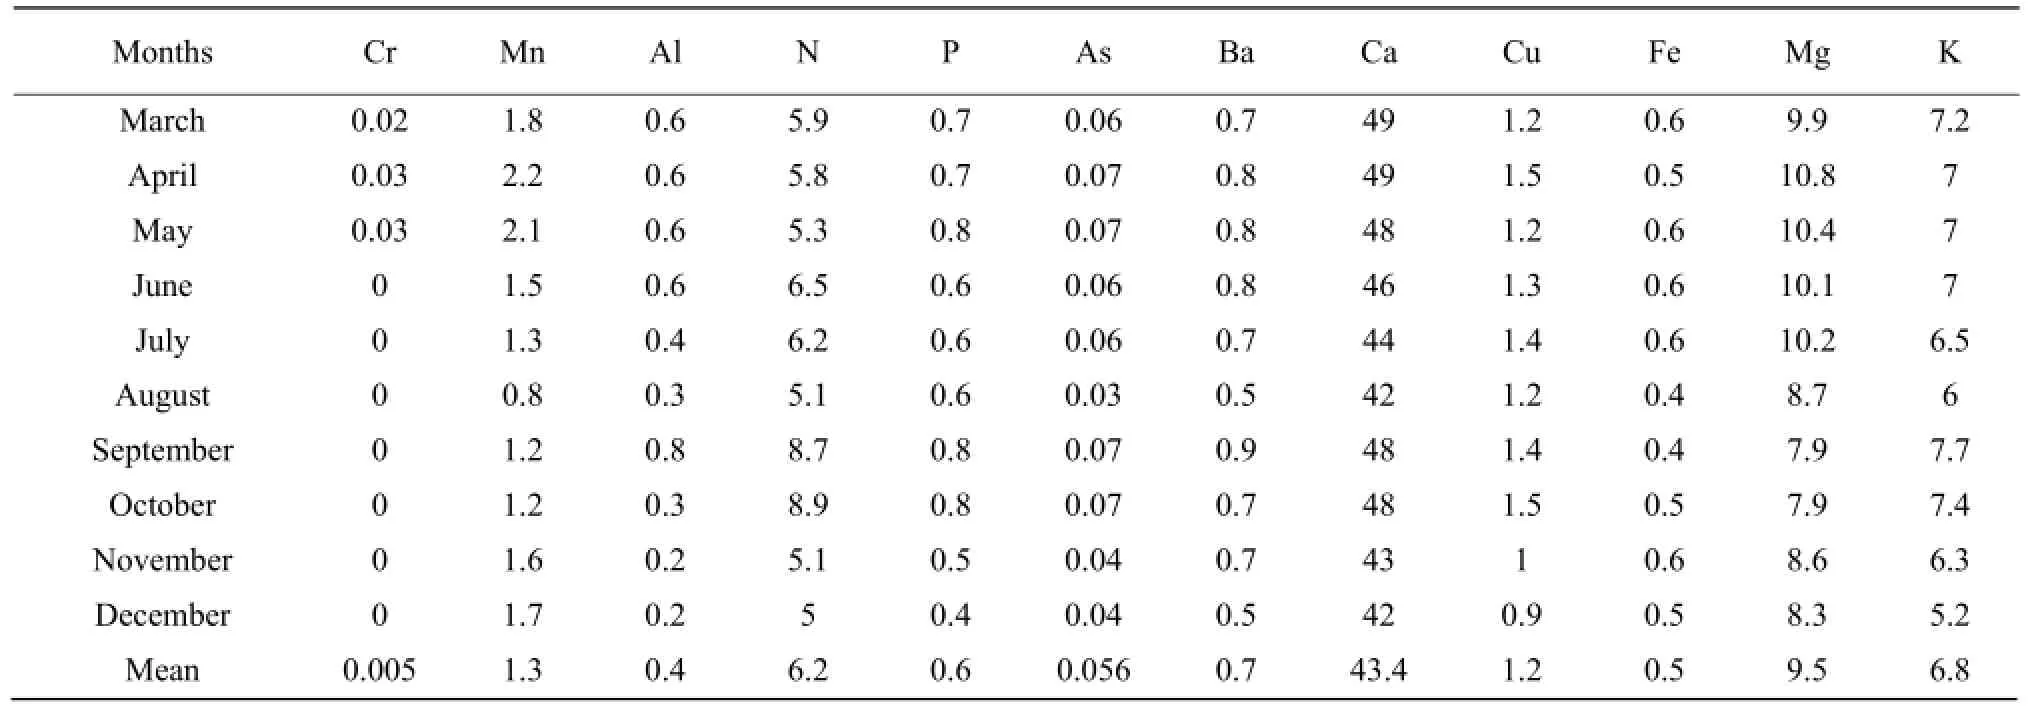
Continued
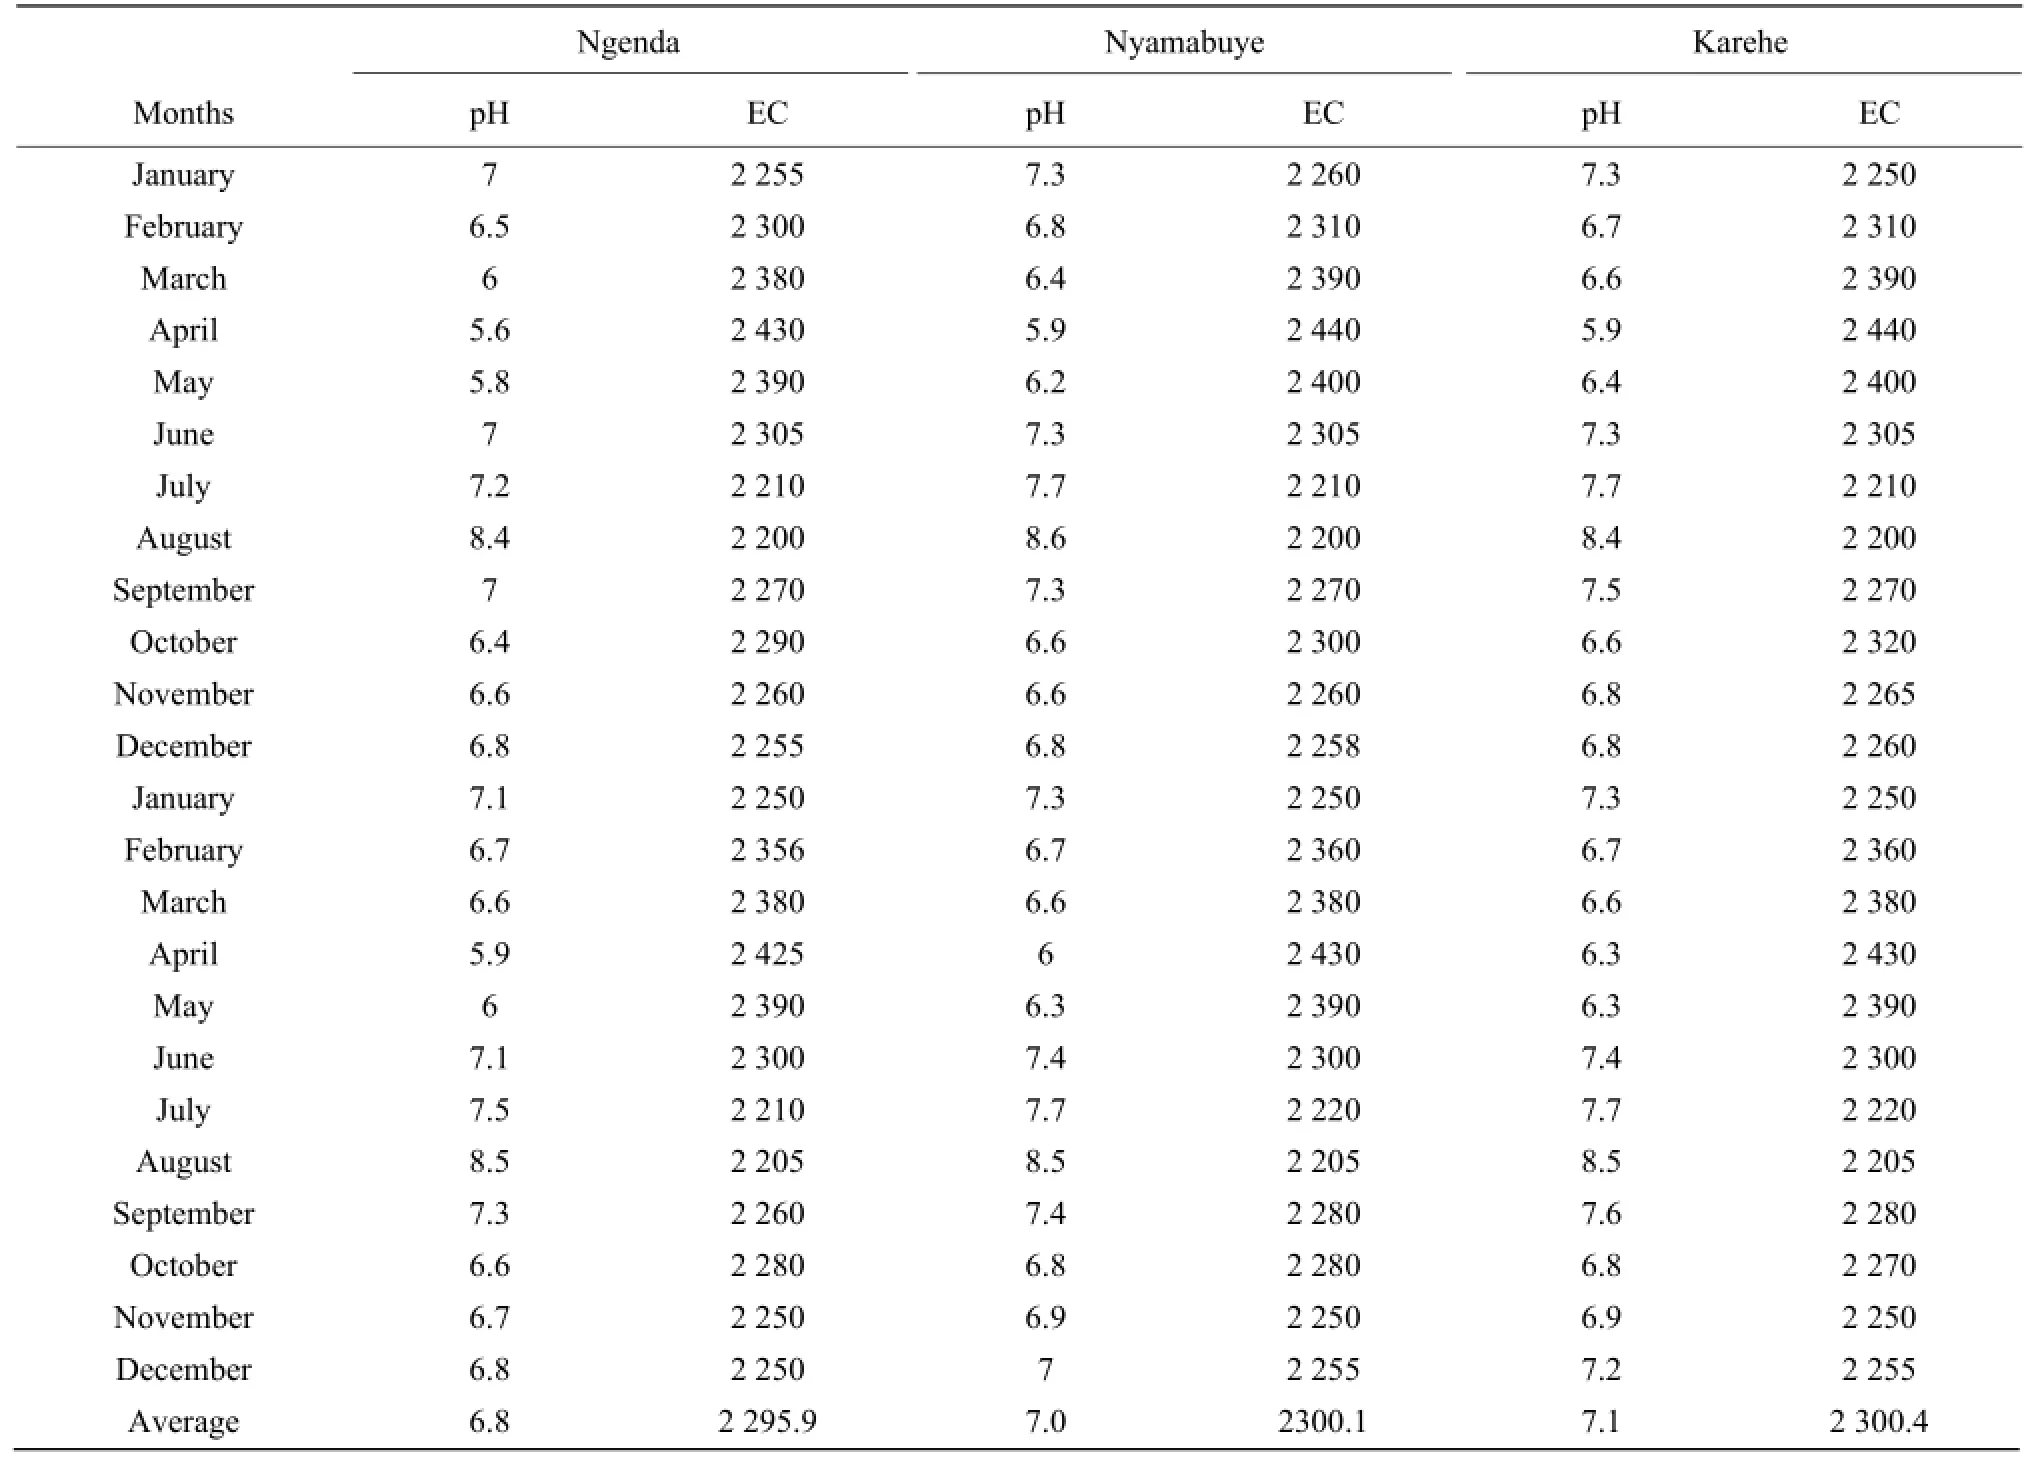
Table 4 pH and electro-conductivity (EC) from January 2009 to December 2010 at Ngenda, Nyamabuye and Karehe Stations
Discussion
For manganese, the highest concentration in mg • L-1was between 2 and 2.2 and was obtained during the period April-May whereas the lowest concentration was between 0.4 and 0.5 and was noticed in the period of December-January and August. Aluminum concentration followed the same shape as manganese with high concentration in mg • L-1of 0.9 during the raining season of May and the lowest concentration of 0.1, during the two dry seasons of July-August and December. Chromium was almost zero in the lake, but little concentration of 0.003 mg • L-1was obtained during the raining period of April-May. For barium the highest concentration in mg • L-1of 0.9 was obtained during the long raining season of April-May while the lowest concentration of 0.5 was obtained in two dry seasons of June-July and December-January. The highest concentration of copper in mg • L-1of 1.8 was obtained during the raining season while the lowest concentration was found during the two dry seasons of August and December.
Calcium, iron and magnesium showed the opposite or lack of correlation with seasonal change. The highest concentration of calcium in mg • L-1of 59 was found in March, while the lowest concentration of 30 was obtained in September. Therefore, the highest and the lowest concentrations were found during the raining season. For iron the highest concentration in mg • L-1of 0.8 was found in both raining and dry seasons, such as January-April and June, the lowest concentration of 0.4 was also found during the raining and dry seasons, such as August-September and December. The highest concentration of magnesium was between 11.7 and 11.9 and was obtained during the dry season from June to July and during the raining season in October.
After analyzing and observing the study area, we found that the variations of the concentrations of nitrogen, phosphorous, potassium, arsenic, manganese, chromium, aluminum, barium and copper were connected with the change of season and they increased during the raining season and decreased during the dry season. The reasons could be the increasing use of fertilizers and pesticides especially in the rice fields near the lake, and other anthropogenic activities, such as fishing, grazing with its associated manure, solid wastes, and wastewater or spilling chemical wastes from the dwelling houses and increasing small outlets along the lake. Therefore, those fertilizers and wastes were carried into the lake by raining water through soil erosion or agricultural runoff. Calcium, iron and magnesium showed the inverse or lack of correlation with seasonal change. The variability of them might be due to natural causes, for example, the origin water of South Lake Cyohoha has a large catchment area and gets water from various rivers, which means that water has more contact with soil before reaching the lake; physical geology of the lake which is located in the African lift valley; the death of living organisms and other daily human activities.
Conclusions and Recommendations
This study showed that seasonal change had some impacts on the concentration variation of aluminum, nitrogen, potassium, arsenic, phosphorous, manganese, chromium, barium and copper in the South Lake Cyohoha, which was mainly due to the anthropogenic activities carried out in the catchment areas of the lake, such as farming, grazing, and fishing, increasing business and industrial activities which caused water pollution through uncontrolled soil erosion and agriculture runoff, by increasing use of fertilizers and pesticides in the fields near the lake, improper disposal of solid wastes, wastewater and spilling chemical wastes which were finally taken into the lake by raining water. Also, this study revealed that calcium, iron and magnesium concentrations varied independently with seasonal change and the reasons could be more physical and geological than anthropogenic. Conductivity and pH confirmed the seasonal effects on the quality of water in the South Lake Cyohoha since the highestvalue of conductivity was found during the raining season, while the smallest was observed during the dry season, for pH the highest number was noticed during the dry season, and the lowest during the raining season. There is a requirement to carry out more studies on the causes of the concentration variation of calcium, iron and magnesium. It is again suggested to study the concentration variation of major elements for a long period. We finally recommended future researchers to study the impact of land use change on the quality and quantity of South Lake Cyohoha and a continuous monitoring of that water as the population and economic activities are increasing in the catchment area.
Jr Burton A, Pitt R. 2001. Stormwater effect handbook: a toolbox for watershed, scientists and engineers. Lewis Publisher, Washington D.C. pp. 15.
Boko M, Niang I, Nyong A. et al. 2007. Climate change, impacts, adaptation and vulnerability. contribution of working group II to the fourth assessment report of the intergovernmental panel on climate change. Cambridge University Press, Cambridge UK. pp. 433-467.
Filgueiras A V, Lavilla I, Bendicho C. 2002. Chemical sequential extraction for metal partitioning in environmental solid samples. Journal of Environmental Monitoring, 4: 823-857.
Hulme M, Doherty R, Ngara T, et al. 2001. African climate change: 1900-2100. Climate Research, 17: 145-168.
Lorber M. 2002. A pharmacokinetic model for estimating exposure of Americans to dioxin-like compounds in the past, present, and future. Sci Total Environ, 288: 81-95.
Samecka-Cymerman A, Kempers A J. 2001. Concentration of heavy metals and plant nutrients in water, sediments and aquatic macrophytes of antropogenic lakes (former, open cut brown coal mines) differing in stages of acidification. Sci Total Environ, 281: 87-98.
Sparkman O D. 2000. Mass spectrometry desk reference. University of Pittsburgh, Pittsburgh.
Tovar M, Rodriguez R. 2004. Vulnerability assessment of aquifers in an urban-rural environment and territorial ordering in Leon, Mexico. Geofisica Interncional, 43(4): 603-609.
X524
A
1006-8104(2014)-01-0056-08
Received 17 May 2012
Supported by the Natural Science Foundation of China (51179032, 51279031)
Jean de Dieu Bazimenyera (1977-), male, lecturer, Ph. D candidate, engaged in the research of climate change, environmental management, water management, and land use management. E-mail: bazidieu@gmail.com
* Corresponding author. Fu Qiang, professor, supervisor of Ph. D student, engaged in the research of high efficient utilization of agricultural soil and water resources. E-mail: fuqiang@neau.edu.cn
杂志排行
Journal of Northeast Agricultural University(English Edition)的其它文章
- Study on Relationship Between Cucumber Germplasm and Propamocarb Residue Using Subjective Rating Technique
- Cloning and Expression Analysis of Mlo Gene from Pericallis hybrida B. Nord.
- Simulation of in situ Root Decomposition of Two Barley Cultivars
- Vertical Migrating and Cluster Analysis of Soil Mesofauna at Dongying Halophytes Garden in Yellow River Delta
- Effect of MSTN Propeptide and shRNA Co-expression Vector on Proliferation of Skeletal Muscle Satellite Cells
- Application of Protein Feed Processed by Microbial Fermentation to Dairy Cow