Simulation of in situ Root Decomposition of Two Barley Cultivars
2014-03-07XuJinggangDuanXuejiaoandNoorallaJuma
Xu Jing-gang, Duan Xue-jiao, and Nooralla Juma
1College of Resources and Environment, Northeast Agricultural University, Harbin 150030, China
2Faculty of Renewable Resources, University of Alberta, Edmonton, Alberta, Canada T6G 2E3
Simulation of in situ Root Decomposition of Two Barley Cultivars
Xu Jing-gang1, Duan Xue-jiao1, and Nooralla Juma2
1College of Resources and Environment, Northeast Agricultural University, Harbin 150030, China
2Faculty of Renewable Resources, University of Alberta, Edmonton, Alberta, Canada T6G 2E3
Root C and root-released C are closely related to soil organic matter content and mechanistic simulation modeling has proven to be useful for studying root and soil organic C dynamics in plant-soil ecosystems. A computer model was designed in this study to simulate the dynamics of root C and root released C decomposition in situ and the dynamics of different forms of C in soil under two barley cultivars (Abee and Samson). The results showed that on the 15th day, about 48% of the total14C fixed in roots was respired for Abee and 42% for Samson. This indicated that the turnover rate of root14C of Abee was higher than that of Samson. The percentage of water-soluble organic14C, active microbial14C and stable14C over the total fixed14C were not different between two barley cultivars. From the analysis of the model for two barley cultivars, the total14C transformed into different soil pools (excluding CO2-C and root C pools) for the two barley cultivars was similar (26% for Abee and 25% for Samson), but the difference of14C remaining in soil between the two barley cultivars was mainly because of the difference of14C remaining in roots which have not been yet decomposed. Some of the information which could not be measured in the laboratory conditions was obtained in this study.
simulation, root decomposition, two barley cultivars
Introduction
Root C and root-released C are the main sources of soil organic matter for plant-soil ecosystems. Through the process of the decomposition, energy is provided to microorganisms, nutrients are released for uptake by both microorganisms and plants, and a proportion of the photosynthetically fixed C is stabilized into soil. However, the techniques used for the analyses of the decomposition of roots and root-released C in soil are limited. The decomposition of the root materials in soil may be assessed only through the determination of the end products, such as CO2, because simple chemical analysis of the intermediate products of C decomposition can not be always possible (Paul and Van Veen, 1978). However, the intermediate processes are evenly important as the end products to understand the decomposition of the roots and plant debris in soil.
At present, most studies on root decomposition have been conducted with extracted or excised roots added to disturbed soil samples that do not represent field conditions. Also, previous studies may be based on the absence of fine roots which had higher turnover rate. Moreover, root sample preparation techniques, such as drying, grinding and mixing may also bias the estimation of root decomposition rates. Therefore, it is important to study the root decomposition in situ to estimate the decomposition of roots in field conditions.
Mechanistic simulation models have proven tobe useful for the study of root and soil organic C dynamics. They help to integrate the fragmentary knowledge about the processes involved and therefore to develop a better understanding of the behavior of the soil ecosystem as a whole. They are also useful in formulating and testing hypotheses, and establishing the relative importance of parameters (Verberne et al., 1990).
A computer model was designed to simulate the dynamics of root decomposition in situ and the dynamics of different forms of C in soil under two barley cultivars (Abee and Samson).
Model Descriptions
The model was run on a Mac II si microcomputer using Stella II software. A simplified flow chart of the simulation model is presented in Fig. 1. The model consisted of two submodels: C submodel and14C submodel.
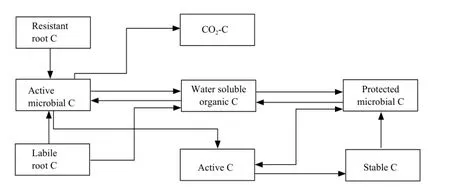
Fig. 1 Flow chart of C in simulation model
C state variables
The C state variables in the model includes labile root C, resistant root C, water-soluble organic C, active microbial C and protected microbial C, active C, stable C and CO2-C. Labile root C mainly represents the labile materials in the roots, such as sucrose, poly-sacchride and amino acids. Resistant root C is mainly composed of structural components of the root tissues, such as cellulose, semi-cellulose and lignin. Root C was measured directly in the experiment and the initial pool sizes of the labile root C and resistant root C were estimated by a double exponential equation. Water-soluble organic C represents a small, very rapid cycling pool consisting of labile organic C materials, such as metabolites and cytoplasmic materials of dead organisms. Water-soluble organic C was measured with l0-g fresh soil using the method of McGill et al (1986). Active microbial C represents the microorganisms in the soil, which could easily access into the roots and grow fast on the root C. Without root C as substrate their biomass would decrease quickly. They accounted for about 17%-19% (18% was used here) of the total microbial C (Dinwoodie and Juma, 1988). Protected microbial C represents the microorganisms which mainly live in soil aggregates and feed on the soil organic C (Verberne et al., 1990). They were much more stable than the active microorganisms. The protected microbial C was calculated by subtracting the active microbial C from the total microbial C measured on 25-g soil samples by the chloroform fumigation technique (Jenkinson and Powlson, 1976). Active C represents rapid cycling in soluble organic C pool consisting of microbial metabolic pro-ducts and recently stabilized materials (Paul and Juma, 1981). Campbell and Souster (1982) determined the active N fraction of a cultivated Black Chernozemic soil from Saskatchewan to be 5.2% of the total soil N from a clay loam. This percentage was used to calculate the initial pool size of active C in the present model.Fifty percent of soil organic C consists of chemically recalcitrant materials with a half life greater than 600 years (Campbell et al., 1967). This phase classified as old C was not simulated in the model because it is very stable in the time period (80 days) of the model simulation. The remainder of the soil organic C was partitioned into microbial C, water-soluble organic C, active C and stable C. The initial pool size of the stable C was calculated by difference. The initial pool sizes of different C pools in the model are presented in Table l.
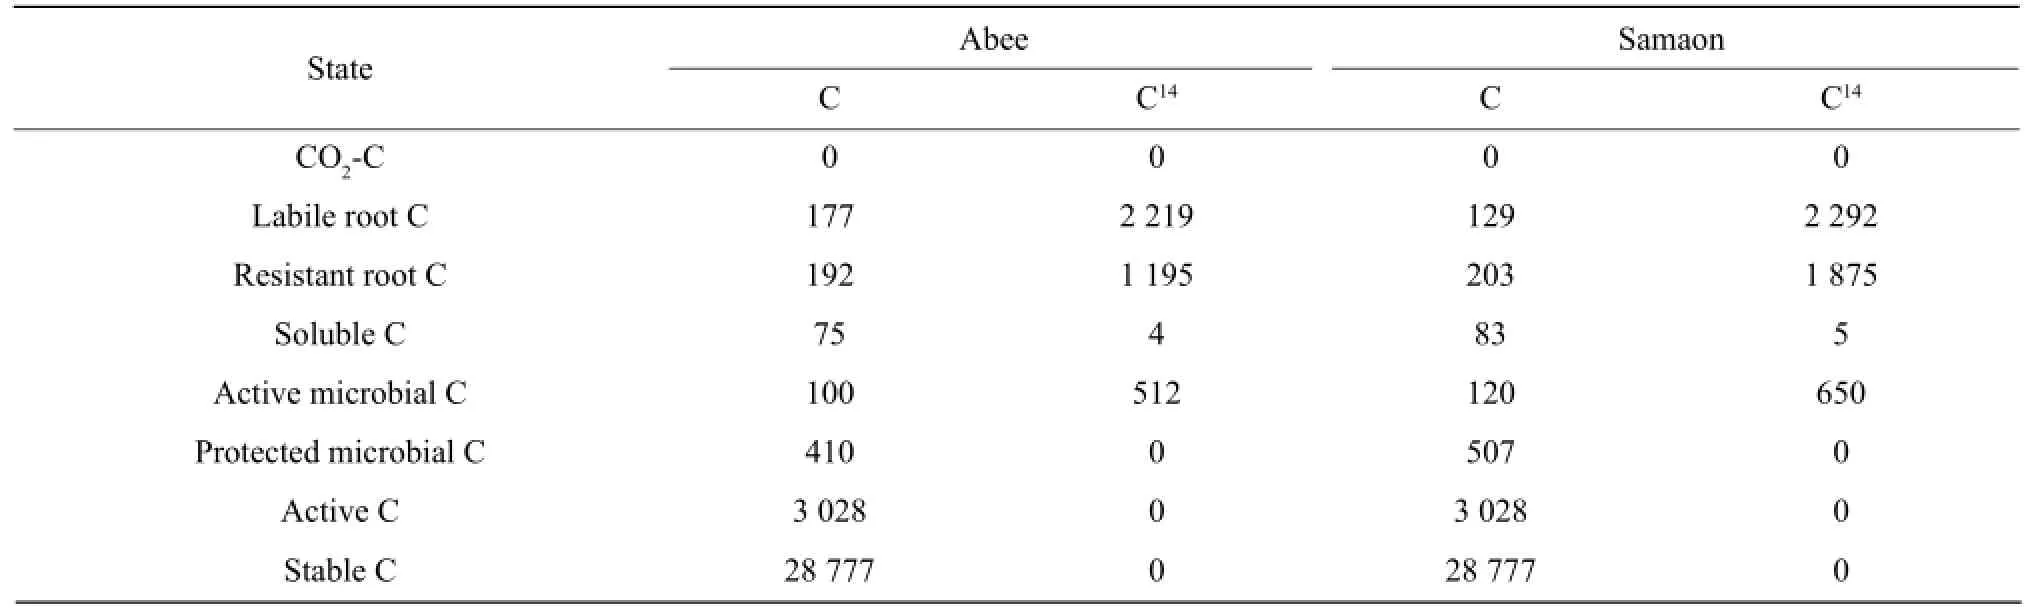
Table 1 Initial pool sizes of total C (mg C • kg-1soil) and14C (kBq • kg-1soil) in the model for two barley cultivars
14C state variables
14C submodel was analogous to the C submodel.14C pools consisted of14C activity (kBq • kg-lsoil). The initial pool sizes of root14C, water-soluble organic14C and microbial14C were measured in the laboratory. The initial pool sizes of the rest pools were initialized to O (Table 1).
C flows between state variables
The flows within C submodel directly or indirectly control the flows within the14C submodel. The uptake of substrate by microbial organisms in the model was calculated by the following equation:
Usi=dSi/dt=Ki×Si
Where, Usi is the uptake rate of the specific substrate i by microbial C (either active microbial C or protected microbial C) (mg C • kg-1soil • d-1); Ki is the first order rate constant for the specific substrate i (d-1); Si is the concentration of the specific substrate i (mg C • kg-1soil) and t is time (d).
Rate of microbial CO2-C evolution (RCO2) was calculated using growth and maintenance components (Hunt et al., 1984):
RCO2=∑((1–Ymi)×Usi)+Mi×Mm
Where, Ymi is the maximum possible yield of microbial C for consumption of specific substrate i (unitless); Usi is the microbial uptake rate of specific substrate i (mg • kg-1soil • d-1); Mm is the microbial maintenance rate (d-1) and Mi is the microbial C (either active microbial C or protected microbial C) (mg C • kg-1soil).
Microbial death rate (Dm) was proportional to the amount of the microbial C present, respectively:
Dm=dMi/dt=–Kd×Mi
Where, Dm is the microbial death rate (mg C • kg-1soil • d-1); Kd is the microbial death rate constant (d-1); Mi is the microbial C. Forty-five percent (1–fr) of this material was assumed to be water-soluble and entered the water-soluble organic C fraction. The remaining 55% (fr) was assumed to be insoluble or chemically stable and entered the active C pool (Hunt et al., 1984).
Active C was transferred to the stable C pool by a first order kinetic reaction that was dependent on the size of the active C pool. This simulates the chemical stabilization of the active organic C into more resistantforms (Juma and Paul, 1981).
Root respiration was not simulated in the model since it was negligible in the time period of the simulation.
14C flows between state variables
The flow of14C between different14C pools (kBq • kg-1soil • d-1) was calculated by multiplying the C flow rate (mg C • kg-1soil • d-1) with the specific activity (kBq • mg-1C) of the pools from which the14C was originating.
All the parameters used in the model were obtained from Literature (Hurst and Wagner, 1969; Sauerbeck and Gonzalez, 1977; Juma and Paul, 1981; Hunt et al., 1984; Verbern et al., 1990; Rutherford and Juma, 1992) and all the parameters were independent from the experiments for calibrating and validating the model. The complete list of the parameters used in the model is presented in Table 2.
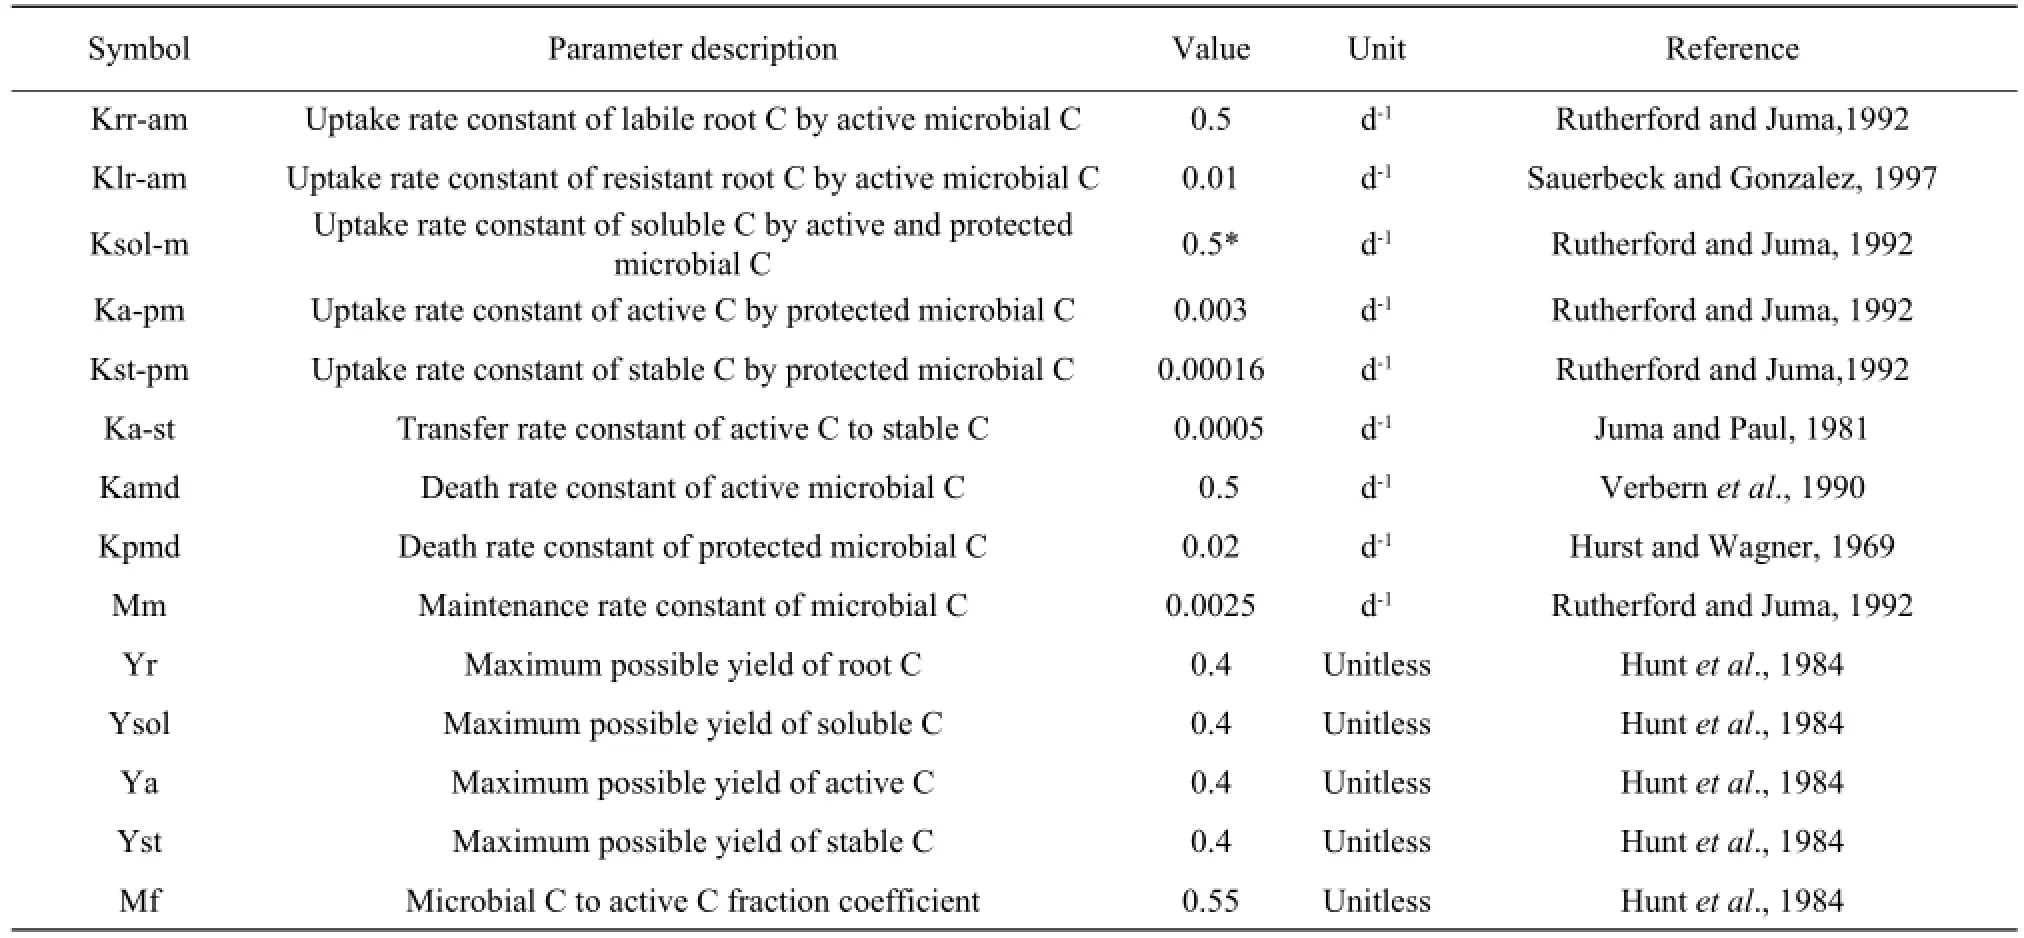
Table 2 Parameter used in the model
Results
Model calibration with data of cultivar Abee
The model was calibrated with the data of the root decomposition in situ of barley cultivar Abee in a Black Chernozem (Typic Cryoboroll). It was possible to produce model outputs that fitted the observed data. The predicted CO2-C evolution and microbial C were closely fitted to the experimental data (Fig. 2). The model simulated the water-soluble organic C well from Day 40 to Day 80, but under estimated from Day 0 to Day 25. The CO2-14C recovery and the predicted microbial14C were within the standard error bars of the experimental data over the incubation period. Watersoluble organic14C was well simulated from Day 25 to Day 80 but over estimated from Day 0 to Day 25 by the model.
Model validation with data of cultivar Samson
The model was validated with the data of the root decomposition in situ of cultivar Samson in a Black Chernozem (Typic Cryoboroll). All the parameters in the model were not changed for the validation. The only change made for validation was the initial pool size (Fig. 3).

Fig. 2 Model outputs (lines) and experimental data (symbols and standard error bars ) for CO2-C, water-soluble organic C, microbial C, CO2-14C, water-soluble organic14C and microbial14C during incubation period for Abee
The model simulated water-soluble organic C well over the incubation period except on Day 5 when it was underestimated. The model closely simulated the microbial C on Day 0, Day 5, Day 15 and Day 80 but overestimated on Day 25 and Day 40. The model accurately simulated the evolution of CO2-14C, but overestimated the water-soluble organic14C over the incubation period. The microbial14C was closely simulated over the incubation period.
Dynamics of C under two barley cultivars
The incubation period was divided into two periods: a period of rapid changes (Day 0-Day 15) and a period of slow changes (Day 15-Day 80). The inputs and outputs and final pool sizes for the two time intervals of two barley cultivars were determined using the model (Tables 3 and 4). CO2-C evolved from Day 0 to Day 15 accounted for about 32% and 31% of the total CO2evolved during the incubation period for Abee and Samson, respectively. During this interval, 51% of CO2evolved was due to the decomposition of the root C for Abee and 39% for Samson. The rests were due to the decomposition of soil organic matter. Active microbial C was reduced by 95% during the first 15 days, as almost all the labile root C was decomposed during this period. The protected microbial C was relatively stable and the decrease was less than 5% of its pool sizes for both cultivars during this period.The output of water-soluble organic C was greater than its input; therefore, it decreased during the first 15 days for both barley cultivars. The input and output of water-soluble organic C were twice greater than its pool sizes for both barley cultivars, indicating that the turnover rate of the water-soluble organic C was more important than its pool size. Active C increased during the first 15 days as the input was greater than the output for both cultivars. Stable C decreased from Day 0 to Day 15 because the input was less than the output.

Fig. 3 Model outputs (lines) and experimental data (symbols and standard error bars ) for CO2-C, water-soluble organic C, microbial C, CO2-14C, water-soluble organic14C and microbial14C during incubation period for Samaon
CO2-C evolved from Day 15 to Day 80 accounted for about 68% to 69% of the total CO2evolved during the incubation period for Abee and Samson, respectively. The main source of CO2evolved during this period was soil organic matter instead of the root C. Forty-four percent of the root C was decomposed between Day 15 and Day 80 for Abee and 41% for Samson. The input of water-soluble organic C was less than its output; therefore, it continued to decrease during this period for two cultivars. The two microbial C pools followed the same trend as watersoluble organic C and the outputs from these pools were still greater than the inputs. The input and output of the active microbial C were over 80 times greater than its pool size as estimated on Day 15 and the input and output of protected microbial C was over three times its pool size of Day 15 for the two barley cultivars. In contrast to the first 15 days, active Cdecreased, during Day 15 and Day 80 as the output was greater than the input for both cultivars. Stable C continued to decrease during Day 15 and Day 80 for two barley cultivars.

Table 3 Simulated inputs and outputs of C between Day 0 and Day 15 and between Day 15 and Day 80 for Abee
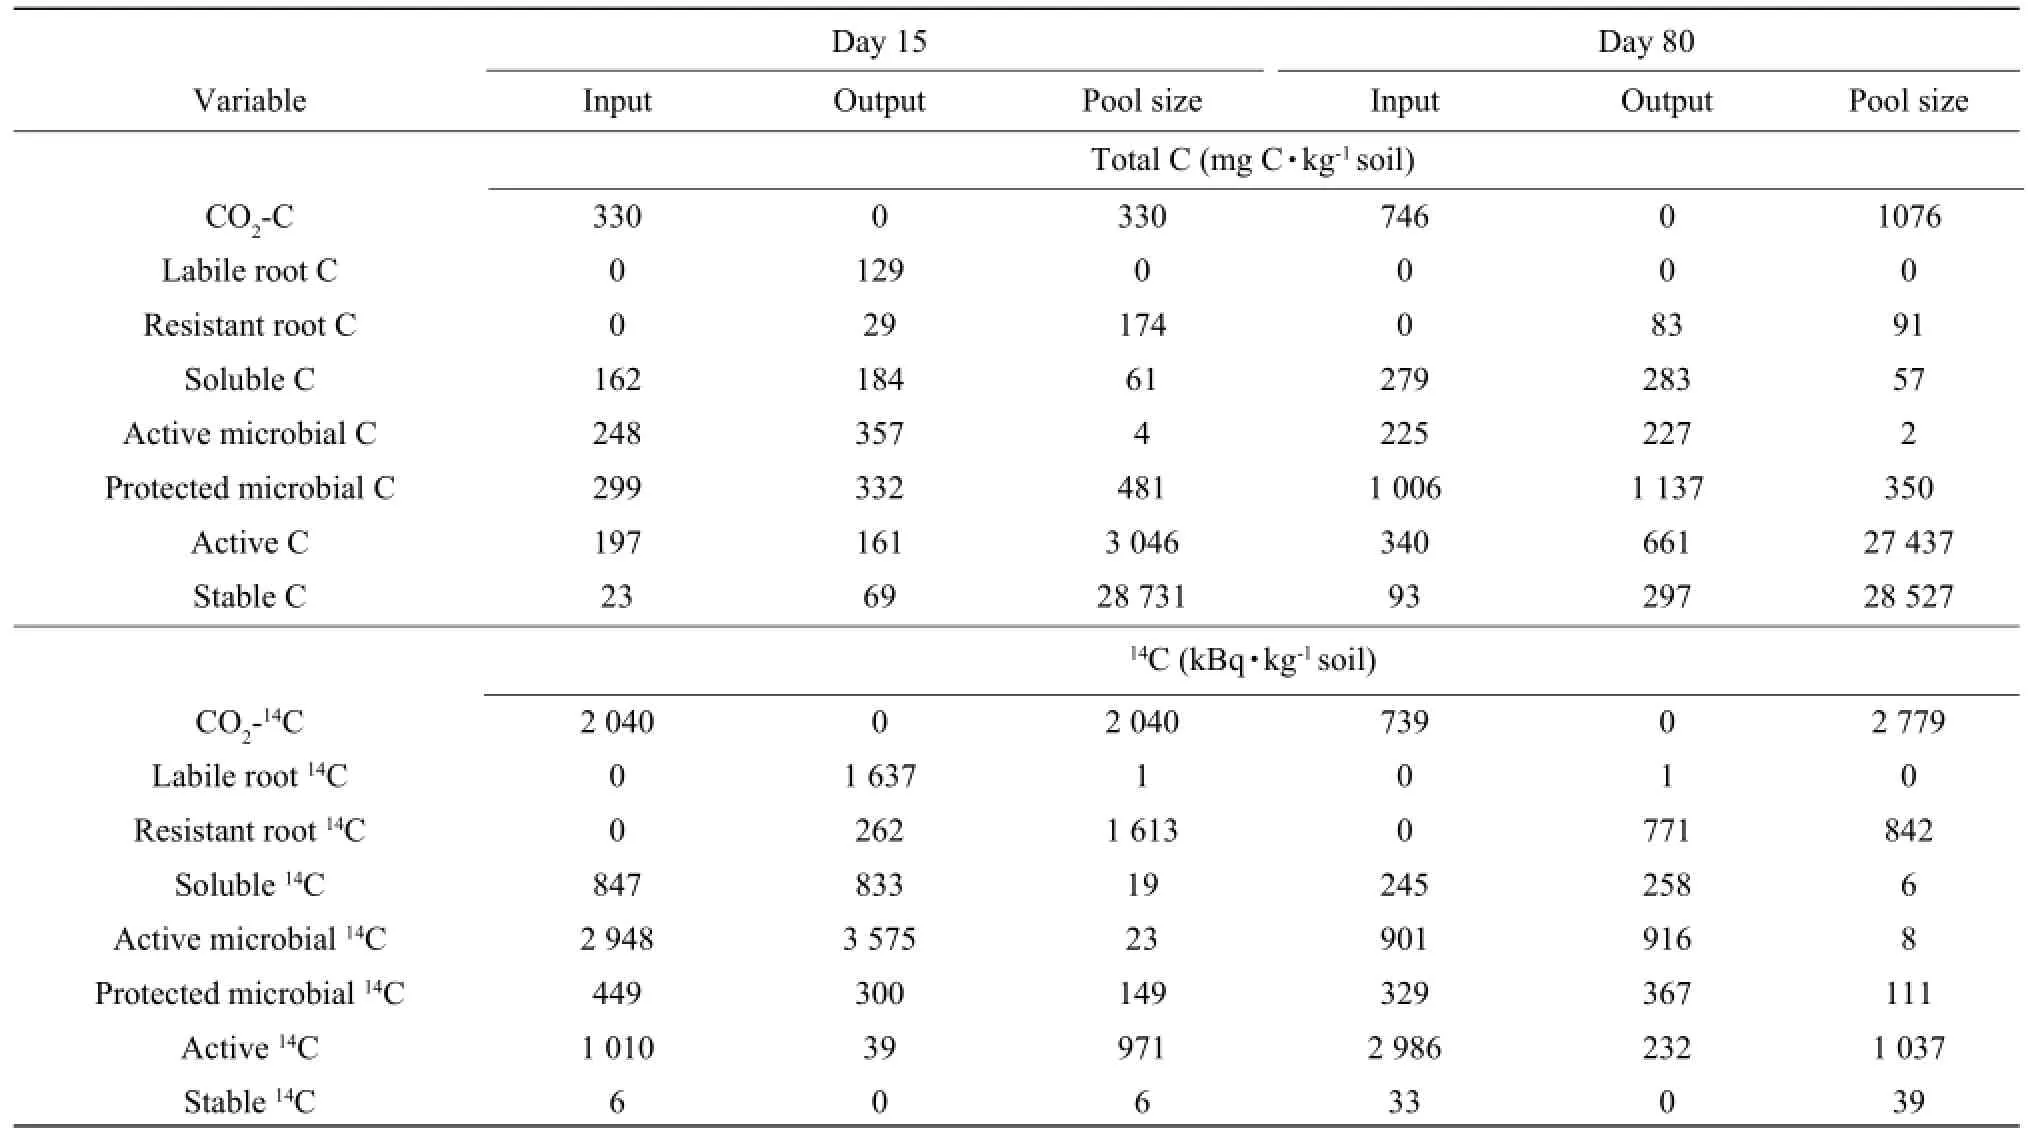
Table 4 Simulated inputs and outputs of14C between Day 0 and Day 15 and between Day 15 and Day 80 for Samson
Dynamics of14C under two bartey cultivars
Seventy-eight percent of the total CO2-14C evolved during the incubation period (80 days) was produced within the first 15 days for Abee and 73% for Samson. The input was less than the output for active microbial14C, therefore, active microbial14C decreased during the first 15 days for both barley cultivars. In contrast, the protected microbial14C increased during the same period since the input was greater than the output. Water-soluble organic14C, active14C and stable14C all increased during the first 15 days. The two barley cultivars had the similar trends.
The CO2-14C evolved between Day 15 and Day 80 accounted for about 22% of the total CO2-14C evolved during the incubation period for Abee and 27% for Samson. Water-soluble organic14C, active microbial14C and protected microbial14C decreased from Day 15 to Day 80 as the inputs were less than the outputs. Active14C and stable14C continued to increase from Day 15 to Day 80 as the inputs were greater than the outputs. The two barley cultivars had the similar trends in14C during Day 15 and Day 80.
Discussion
The simulation model supplies more information on root decomposition, especially on the intermediate processes which can not be measured experimentally in the laboratory. By Day 15, about 48% of the total14C fixed in roots was respired for Abee and 42% for Samson. This indicated that the turnover rate of root14C of Abee was higher than that of Samson in the first 15 days. The percentage of water-soluble organic14C, active microbial14C and stable14C over the total fixed14C were relatively less and were not different between two barley cultivars. Active14C accounted for about 23% of the total fixed14C on Day 15 for Abee and 21% for Samson. On Day 80, the distribution of14C in different pools was CO2-14C (61%)>active14C (22%)>root14C (14%)>microbial14C (3%)>stable14C (0.8%)>water-soluble organic14C (0.l%) for Abee. The trend for Samson was the same: CO2-14C (58%)>active 14C (22%)>root14C (18%)>microbial14C (3%) > stable14C (0.8%)>water-soluble organic14C (0.1%). From the analyses of the model for two barley cultivars, the total14C transformed into different soil pools (excluding CO2-C and root C pools) for the two barley cultivars was similar (26% for Abee and 25% for Samson). The difference of14C remaining in soil between the two barley cultivars was mainly because of the difference of14C remaining in roots which had not been yet decomposed.
Conclusions
The simulation model supplies more information on root decomposition, especially on the intermediate processes which could not be measured experimentally in the laboratory. Through this simulation study, the following conclusions could be drawn:
1) About 48% of the total14C fixed in roots was respired for Abee and 42% for Samson, which indicated that the turnover rate of root14C of Abee was higher than that of Samson. Different varieties of barely could fix different amount of C and had a different contribution to the soil organic matter pool.
2) The percentage of water-soluble organic14C, active microbial14C and stable14C over the total fixed14C were not different between the two barley cultivars. The two barley cultivars had the same trend on distribution of14C in different pools: CO2-14C>active14C>root14C>microbial14C>stable14C>water-soluble organic14C. This implied that most of the root C was respired during the growing season, but a small portion of it was converted into soil organic matter. Maintaining soil organic matter content is important since it takes a long time to be accumulated.
3) The difference of14C remaining in soil between the two barley cultivars was mainly because of the difference of14C remaining in roots which has not been yet decomposed, showing that the more C was fixed and transferred in roots, the more C was incorporated into soil from the air.
References
Campbell C A, Paul E A, Rennie D A, et al. 1967. Factors affecting the accuracy of the carbon-dating method in soil humus studies. Soil Sci, 104: 81-85.
Campbell C A, Souster W. 1982. Loss of organic matter and potentially mineralizable nitrogen from Saskatchewan soils due to cropping. Can J Soil Sci, 62: 651-656.
Dinwoodie G D, Juma N G. 1988. Allocation and microbial utilization of C in two soils cropped to barley. Can J Soil Sci, 68: 495-505.
Hunt H W, Coleman D C, Cole C V, et al. 1984. Simulation model of a food web with bacteria, amoebae and nematodes in soil. In: Klug M J, Reddy C A. Current perspectives in microbial ecology. Am Soc Microb, Washington DC. pp 346-353.
Hurst H M, Wagner G H. 1969. Decomposition of14C-labelled cell wall and cytoplasmic fractions from hyaline and melanic fungi. Soil Sci Soc Am Pro, 33: 707-711.
Jenkinson D S, Powlson D S. 1976. The effects of biocidal treatments on metabolism in soil. V. A. method for measuring soil biomass. Soil Biol Biochem, 8: 209-213.
Juma N G, Paul E A. 1981. Use of tracers and computer simulation techniques to assess mineralization and immobilization of soil nitrogen. In: Frissel M J, Van Veen J A. Simulation of nitrogen behavior in soil-plant systems. Pudoc, Wagenigen. pp. 145-154.
McGill W B, Cannon K R, Robertson J, et al. 1986. Dynamics of soil microbial biomass and water-soluble organic C in Breton L after 50 years of cropping to two rotations. Can J Soil Sci, 66: 1-19.
Paul E A, Juma N G. 1981. Mineralization and immobilization of soil nitrogen by soil microorganisms. In: Clark F E, Rosswall T. Terrestrial nitrogen cycles. Ecol Bull Stockholm, 33: 179-195.
Paul E A, Van Veen J A. 1978. The use of tracers to determine the dynamic nature of organic matter. Transactions llth ISSS Congress (Edmonton) Symposia Papers, 3: 61-102.
Rutherford P M, Juma N G. 1992. Simulation of protozoa-induced mineralization of bacterial carbon and nitrogen. Can J Soil Sci, 72: 201-216.
Sauerbeck D, Gonzalez M A. 1977. Field decomposition of carbon-14-labelled plant residues in various soils of the Federal Reppublic of Germany and Costa Rica. In: Soil organic matter studies. Proc. Symp. FAO/FEA, Braunschweig. pp. 159-170.
Verbeme E L J, Hassink J, De Willigen P, et al. 1990. Modelling organic matter dynamics in different soils. Netherlands J Agric Sci, 38: 221-238.
S1
A
1006-8104(2014)-01-0016-09
Received 17 September 2013
Xu Jing-gang (1959-), male, professor, supervisor of Ph. D student, engaged in the research of soil fertility and agricultural environmental protection. E-mail: jinggangxu@qq.com
杂志排行
Journal of Northeast Agricultural University(English Edition)的其它文章
- Study on Relationship Between Cucumber Germplasm and Propamocarb Residue Using Subjective Rating Technique
- Cloning and Expression Analysis of Mlo Gene from Pericallis hybrida B. Nord.
- Vertical Migrating and Cluster Analysis of Soil Mesofauna at Dongying Halophytes Garden in Yellow River Delta
- Effect of MSTN Propeptide and shRNA Co-expression Vector on Proliferation of Skeletal Muscle Satellite Cells
- Application of Protein Feed Processed by Microbial Fermentation to Dairy Cow
- Cloning and Sequence Analysis of Y-box Binding Protein Gene in Min Pig