Investigation of non-cohesive levee breach by overtopping flow*
2013-06-01YUMinghui余明辉WEIHongyan魏红艳
YU Ming-hui (余明辉), WEI Hong-yan (魏红艳)
State Key Laboratory of Water Resources and Hydropower Engineering Sciences, Wuhan University, Wuhan 430072, China, E-mail: mhyu@whu.edu.cn
LIANG Yan-jie (梁艳洁)
State Yellow River Engineering Consulting Co., Ltd., Zhengzhou 450000, China
ZHAO Yong (赵勇)
Changjiang Engineering Supervision and Consulting Co., Wuhan 430021, China
Investigation of non-cohesive levee breach by overtopping flow*
YU Ming-hui (余明辉), WEI Hong-yan (魏红艳)
State Key Laboratory of Water Resources and Hydropower Engineering Sciences, Wuhan University, Wuhan 430072, China, E-mail: mhyu@whu.edu.cn
LIANG Yan-jie (梁艳洁)
State Yellow River Engineering Consulting Co., Ltd., Zhengzhou 450000, China
ZHAO Yong (赵勇)
Changjiang Engineering Supervision and Consulting Co., Wuhan 430021, China
(Received August 29, 2012, Revised November 11, 2012)
This paper presents an experimental study of the overtopping breach of homogeneous non-cohesive levee or dike in a 180obend rectangular flume. Detailed experimental and numerical results provide information on the breach flow discharge and longitudinal and transversal breach profiles for this type of levee. It is indicated that the water level and the flow discharge in the river and the levee material properties are significant influencing factors for the breach evolution. The plane form of the breach is approximately an asymmetrical hyperbola. A formula with a non-constant flow factor is proposed to compute this kind of breach discharge.
non-cohesive, levee, overtopping, breach discharge, experiments
Introduction
Flood disasters occur frequently and cause severe casualties and economic losses. Embankments, such as levees and dikes, are often deployed to prevent rivers from overflowing the banks. However, embankment failure often causes and aggravates flood disaster[1]. Detailed data on the breach development and outflow hydrograph are of significant importance for developing appropriate early warning systems and emergency plans.
Due to the sudden occurrence and the danger of dam or levee breach, it is difficult to observe and record the real-time evolution process and the outflow discharge through the breach[2]. Therefore, investigations depend mostly on physical experiments and numerical simulations[3]. Previous researches focus mostly on the dam breach. Physical experiments include large-scale tests in the field[4,5]and small-scale tests in the laboratory[6-10]. Laboratory experiments on dam failure include single dam break cases[11]and cascade dam break cases[12]. Nevertheless, the breach formation and development is a complicated process with various influencing factors involved, such as the geometry and the structure of the levee, the type of materials and the causes of failures. Despite of many studies, our understanding of the breaching mechanism is still inadequate. In the recent five decades, particularly since the 1980’s, many mathematical models were proposed for the simulation of dam breach evolution[13,14]. However, the calibration and validation of these models remain problematic for lack of appropriate measurement data. In addition, the flow through a dam breach is approximately perpendicular to the dam body and the breach expands almost symmetrically along the lateral directions, so that the upstream flow direction usually does not have a significant impact on the breach characteristics. The discharge through the dam breach is usually approximated by the broad-crested weir formula[15,16]. Pickert et al.[17]introduced the dimensionless breach discharge in relation to a dimensionless time by the dimensional analysis of experimental data, but the scaling is limited to the model boundary conditions.

Fig.1 Layout of the laboratory experiments
Few studies were carried out for river or sea dike breaches up to date. One example that can be found in the literature was the study by Visser and Zhu[18], who proposed a numerical model of non-cohesive dike based on field and experiment data. In their model, the discharge through the breach was still calculated by the broad-crested weir formula. Beyond all doubt, it is questionable because the overflow through the breach is not normal to the river or sea dike body. Kamrath et al.[13]improved the Poleni weir formula to compute the discharge through the dike breach, whose flow factor was estimated by numerical simulations.
The overtopping erosion is one of the important causes for the breach. This paper makes an experimental study to reveal how the non-cohesive levee and dike are progressively breached by the overtopping erosion. The breach discharge is calculated by using a horizontal 2-D unsteady flow numerical model based on the measured breach data. The relationship between the breach discharge, the breach development process and the water level above the breach can thus be explained more reasonably.
1.Experiments
1.1 Experimental set-up
Experiments were carried out in a 180obend rectangular flume, 1.2 m wide, 0.6 m deep and 40 m long in the State Key Laboratory of Water Resources and Hydropower Engineering Sciences, Wuhan University. The outer radius of curvature is 3 m and the inner radius is 1.8 m at the bend of the flume. The bed slope of the flume is 0.1%.
As shown in Fig.1, the outer river and the inner river were compartmentalized by a 13 m long levee in the flume. The so-called outer river was the main river, as a rule. The inner river was dry initially and prepared to contain the overflow water after the levee breach, that is, the inundation area in the actual case. For the levee, the side facing the outer river is called the outside slope and the other side is called the inside slope. In the outer river, the flow discharge was measured by a V-notch weir fixed at the entrance of the flume and the water level was controlled by a tailgate at the downstream end. Another tailgate in the inner river was kept open to ensure a free outflow.

Fig.2 Size distribution of levee materials
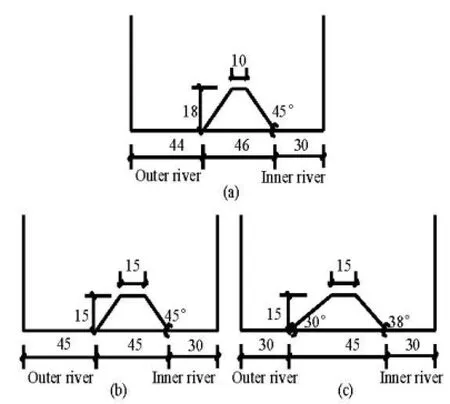
Fig.3 Sketch of levee cross section (m)
A rectangular gap, 0.2 m wide and 0.015 m deep, was present at the crest of the levee called the pilot channel. The pilot channel acted as the weak surface of the levee, inducing the overtopping. The water levels in both the outer river and the inner river were measured ten times per second with nine electromagnetic water-level probes, as marked by S1-S9 in Fig.1. The water-level probes track the transient water changes with a speed of 0.1 m/s, and a measuringerror within 0.005m±. A computer is linked to the probes to receive and process the measurement data. The process of the breach growth was videotaped with two digital video cameras hung on the upstream of the outer river facing the outside and inside slopes of the breach, respectively, assisted by two digital cameras taking photos. Furthermore, an automatic electromagnetic terrain-measuring probe was hung over the middle of the gap as the site S10 to facilitate the reading of the development of the embankment profile ten times per second.
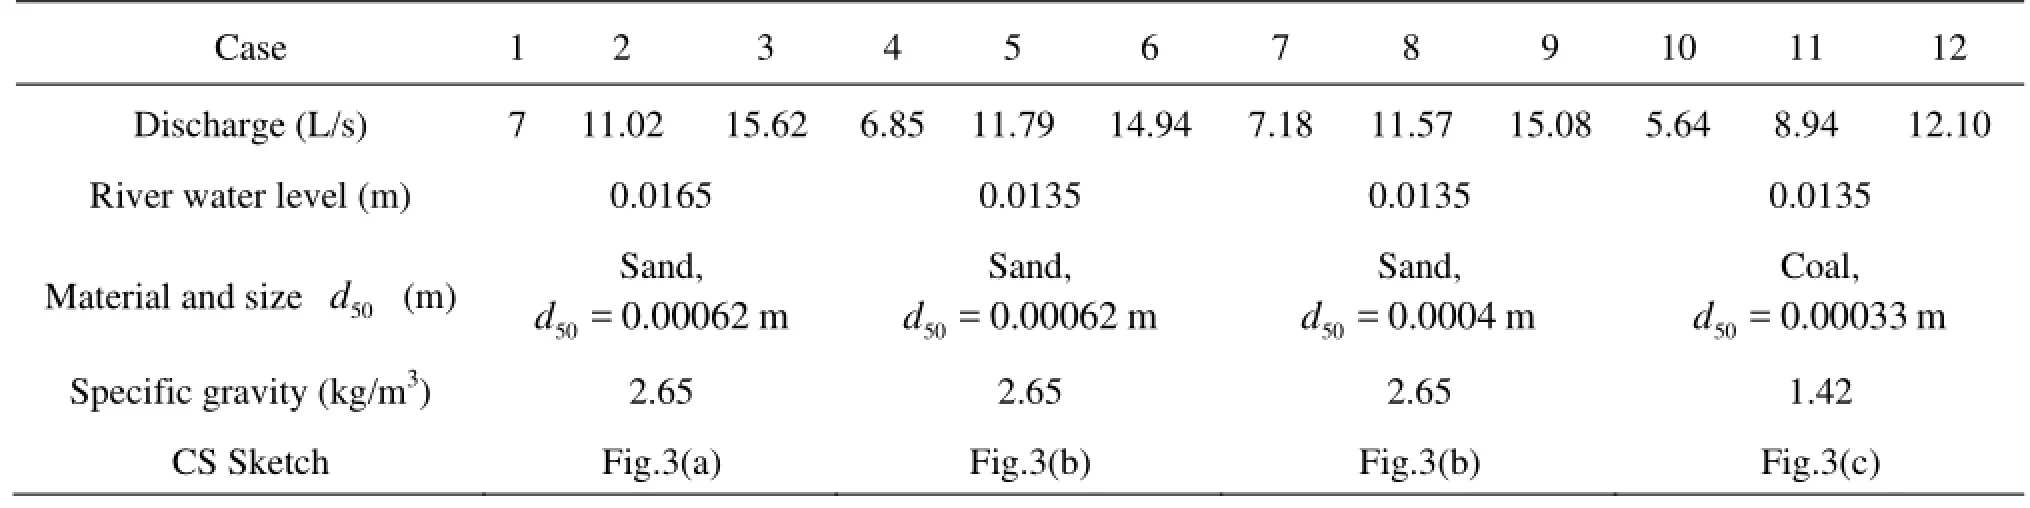
Table 1 Conditions of experimental cases
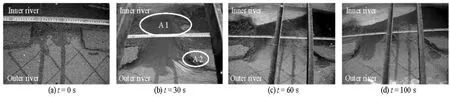
Fig.4 Levee breach expansion process, at instants =t0 s, 30 s, 60 s and 100 s
At the beginning, the outer river was slowly filled with water until the water level rose to the pilot channel bottom level. Much care was taken to ensure that there was no current in the flume. Afterwards, the valve at the inlet of the flume was open to adjust the flow discharge as preplanned while the tailgate was accordingly adjusted to a certain water level for different discharges to keep a steady flow initially in the outer river. As an anti-seepage method, a suitable wood board and suitable sandbags were cautiously placed at the outside slope of the embankment. Hardly had water overflowed the gap when the wood block and sandbags were taken away quickly to start the embankment breaching process.
Sand and coal were used as levee materials. Their grain size distributions are shown in Fig.2, where D represents diameter and p means the percentage of the particles that are smaller than relevant diameter. Due to the limited width of the flume, three kinds of levee cross sections were constructed, as shown in Fig.3. To ensure the homogeneity and stability of the levee and the test repeatability, the levees were made of 0.05 m horizontal layers, compacted as evenly as possible. Initial porosities of the levee materials were 46.8%-47.4%. Experimental conditions are shown in Table 1.
1.2 Results and discussions
The erosion process of the levee is shown in Fig.4. After the water in the outer river overflows the pilot channel, a gully appears in the channel and then expands gradually. The overtopping leads to the erosion of the inside slope from the toe towards the outside slope. At the same time, the potential energy of the outer river flow is transformed into the kinetic energy, resulting in the water flow through the breach at a high velocity, forming a jet (partly aerated). Then, the breach sidewalls collapse quickly due to the progressively intensified scouring and the wall shear force. The breach widening is a combination of the continuous erosion of the breach channel base and the sudden failure of the overhanging breach side slopes. A part of the mass is carried by the flow instantaneously and the other part piles up at the foot of the inside slope. The flow through the breach is complex, involving a subcritical flow near the outer river and a supercritical flow through the the inside slope. Because the inner river is almost dry initially, there is a free flow at the toe of the inside slope (=t30 s in Fig.4). The flow velocity and the shear stress are high at the two areas as shown in Fig.4. The area A1 is almost the inside slope of the breach and A2 is the upstream outside slope of the breach. These two areas are scoured more heavily and their sidewalls collapse more quickly, so that the breach shape develops asym-metrically.
As the breach expands and the water level in the inner river rises, the flow at the toe of the inside slope is submerged (=t60 s in Fig.4). Then the flow velocity through the breach and its erosion capacity reduce gradually, but the lateral collapse of the breach continues. When the flow through the breach reaches a stage unable to wash away the particles, the breach is almost stable and its plane form is like an asymmetrical hyperbola (=t100 s in Fig.4).
1.2.1 Influencing factors on breach
(1) Water level in the river
The experimental conditions between Cases 2 and 5 and between Cases 3 and 6 are almost identical except the initial water level in the outer river. Three kinds of initial cross sections of levee are shown in Fig.3. The breach widening processes are demonstrated in Figs.5 and 6, where B is the width of the breach and t is the time after burst. The breach widths at the toe of the inside and outside slopes were measured by meters and calibrated by digital video cameras.

Fig.5 Process of breach expansion of Cases 2 and 5
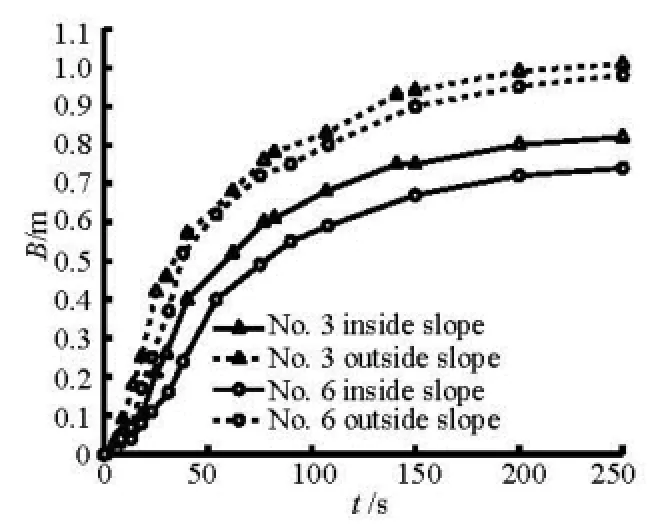
Fig.6 Process of breach expansion of Cases 3 and 6
The water level difference between the outer and inner rivers is an important factor affecting the breach expansion. In the first 50 s, the water level difference is so large that the flow crossing the breach can move the levee particles. The breach expands rapidly by means of scouring and collapsing. The breach near the outside slope widens faster than near the inside slope. With the water level difference decreasing gradually, the corresponding breach expansion slows down.
(2) Flow discharge in the river
The experimental conditions of Cases 1-3, Cases 4-6 and Cases 7-9 are almost identical, except the flow discharges in the outer river. Taking Cases 1-3 as an example, the breach expands at the inside and outside slopes, as shown in Figs.7 and 8, where Q is the river discharge.
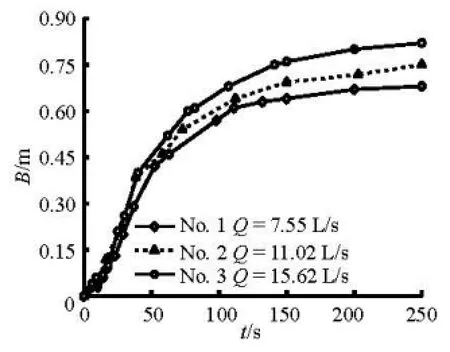
Fig.7 Process of the breach expansion on the inside slope
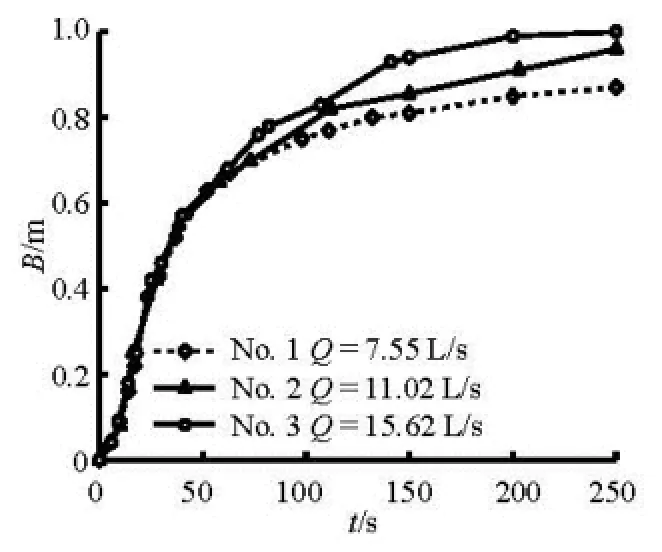
Fig.8 Process of the breach expansion on the outside slope
It can be seen from Figs.7 and 8 that the breach progresses at almost the same rate in the first 50 s under different river discharges. In the first 50 s, the breach develops mostly as the result of the erosion of the breach channel base caused by the water level difference between the outer river and the inner river. Therefore, the effect of the river discharges on the breach width is not considerable at this phase. Then, the breaching is dominated by a rapid increase in the breach outflow and the erosion rate, due to a significant vertical and horizontal breach widening. The ultimate width of the breach is larger under a greater river discharge.
(3) Levee materials
Cases 4 and 7, Cases 5 and 8 are for the same situations but with different particle sizes. The sand of d50=0.00062 m is applied in Cases 4 and 5 and the sand of50=d0.0004 m in the other two cases. Thebreach widening processes are shown in Figs.9 and 10. The levee breach of the sand of50=d0.00062 m expands almost as fast as that of the sand of50=d 0.0004 m in the first 50 s but slower after 50 s.

Fig.9 Process of breach expansion of Cases 4 and 7
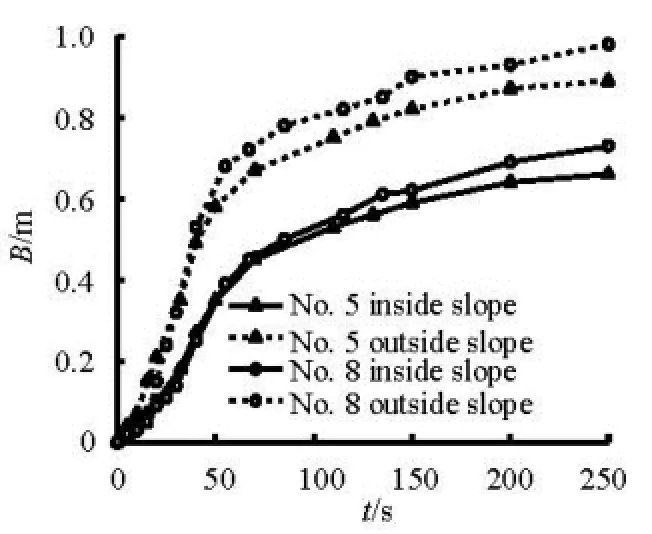
Fig.10 Process of breach expansion of Cases 5 and 8

Fig.11 Erosion process of site S10
1.2.2 Breach erosion processes
Taking Cases 7-9 as an example, the erosion process of site S10 is shown in Fig.11. The profile of the gap of Case 7 varies as shown in Fig.12. In both of the two figures, elevation is indicated by the symbol E. The evolution of the levee profile is determined from the videos and photos, assisted by an automatic electromagnetic terrain-measuring probe fixed at S10.
It could be observed that the vertical erosion of the levee mainly occurs in the first 50 s and then tends to decelerate gradually. As previously mentioned, the erosion extends rapidly from the toe of the inside slope towards the outside slope.
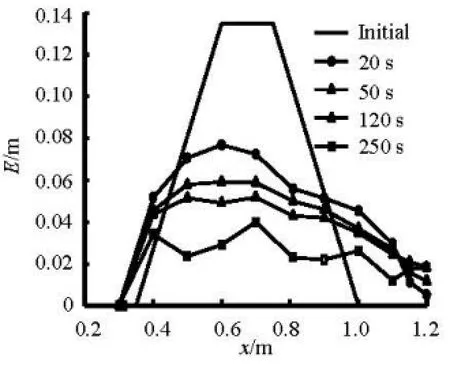
Fig.12 Erosion process of the gap profile (Case7)
1.2.3 Water level variation process
Taking Case 8 as an example, the water level ()Z process at each probe site (see Fig.1) is shown in Fig.13. In the water level monitoring system, the riverbed elevation of S6 is set as the reference datum. Because the initial inner river is dry, the initial water levels at S6, S8 and S9 are recorded as their corresponding bed elevations.
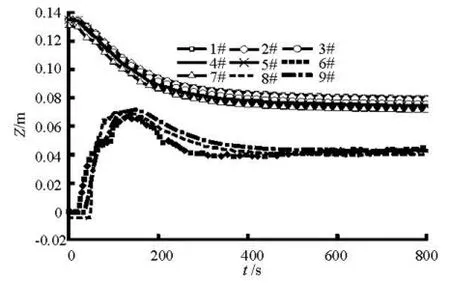
Fig.13 Water level variation process
At the moment of the levee breach, the water level difference between the outer and inner rivers is the largest. As the breach expands, the water level in the inner river rises rapidly. During the erosion, the water levels in the outer river such as S1-S5 and S7 keep declining while those in the inner river such as S6, S8 and S9 rise to the peak rapidly then decline gradually. The water level difference between the outer and inner rivers decreases to a constant value. The water levels at S6, S8 and S9 fluctuate strongly because of the turbulent flow and the strong wave near the breach.
2. Investigation on the breach discharge
Based on the experimental data, a horizontal 2-D unsteady flow numerical model is applied to simulatethe discharge process through the breach.
2.1 Simulation of the discharge through breach
2.1.1 Governing equations and parameters Fluid continuity equation
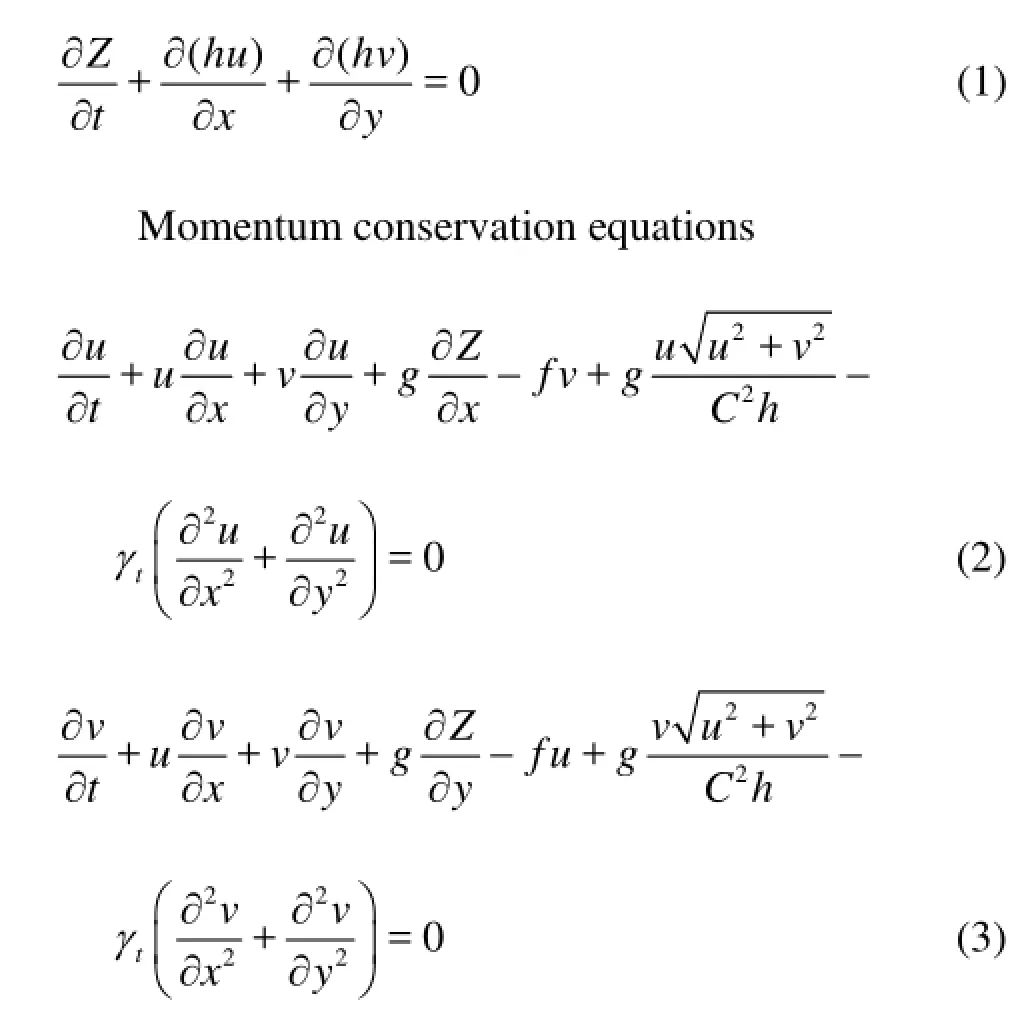
where Z is the water level, h is the water depth and h=Z-Zb, in which Zbis the river bed elevation, u is the water velocity in x-direction and v is the velocity in y-direction, C is the Chéz parameter and =C n-1h1/6, in which n is the Manning coefficient and n=0.012-0.015in a concrete channel, γtis the turbulence viscosity coefficient, and g is the gravity acceleration.
2.1.2 Numerical scheme and validation
The model uses a finite-difference method on staggered grids. Eqs.(1)-(3) can be solved numerically using a range of effective schemes that can capture shocks and sharp fronts reasonably well[19].
The calculation area ranges from cross sections CS1 through CS17 with a grid spacing of 0.05 m× 0.05 m. The time step is 0.1 s.
The boundary conditions such as the upstream incoming flow Q(CS1,t) and the downstream water level (S7,)Zt in the outer river are given using the measured data. The breach of the levee is considered as an open boundary, with the measured widening processes. The accurate breach discharges Qb(t) are calibrated by comparing the water level time series provided by the probe measurements with those obtained by the numerical model. Taking Case 7 as an example, the numerical water levels are in satisfactory agreement with the experimental data, as shown in Figs.14 and 15.
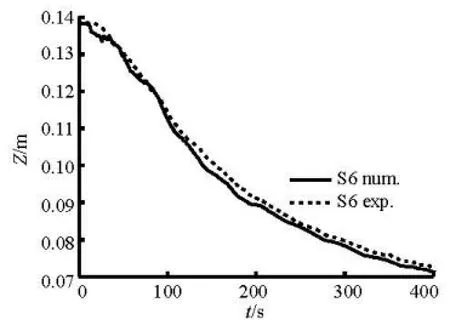
Fig.14 Water level process of S6
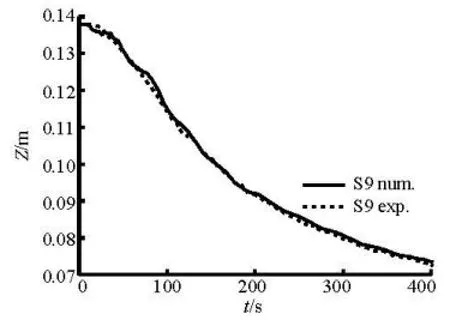
Fig.15 Water level process of S9
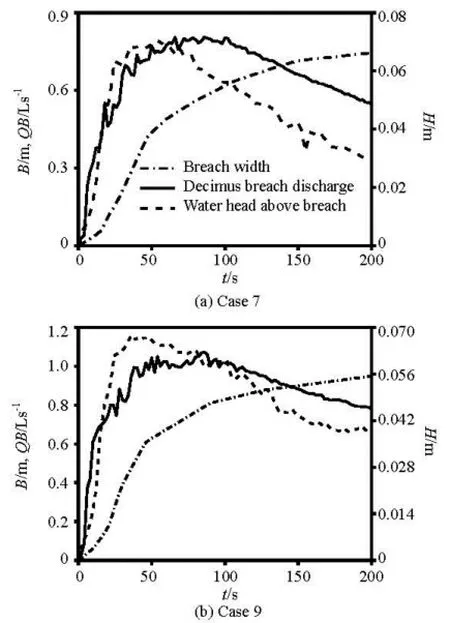
Fig.16 Relationship among overflow discharge, water head and breach width
2.2 Breach discharge and influencing factors
The correlations among the breach overflow discharge ()QB, the water head above the breach ()H and the breach width ()B of Cases 7 and 9 are shown in Figs.16(a) and 16(b), respectively. The water head above the breach is equal to the water level at S4 minus the highest elevation of the breach channel base. The breach width is the transversal width of the breach channel base at the highest point. The breach discharge is calculated by the above 2-D numerical model.
During the overtopping process, the breach keeps widening, but the water head above the breach and the overflow discharge rise to the peak values rapidly then decline gradually. The outflow peak discharge lags behind the peak water head above the breach. After reaching the maximum value quickly, the water head above the breach decreases gradually. On the other hand, the breach still widens gradually, so the breach discharge keeps increasing slowly. Then, as the water head above the breach keeps going down, the discharge through the breach begins to decline.
To study the effects of the flow depth, the approach velocity, the lateral overflow direction and the wide weir channel shape, the lateral outflow intensity was estimated by Hager[20]. Although the lateral outflow formula recommended by Hager is not handy, it does include geometrical as well as hydraulic properties of the side weir flow. As an initial attempt in the paper, the side weir flow formula for non-prismatic channels can be reduced as follows

where q is the unit discharge, H is the water head above the breach and m is the flow factor of the side weir.
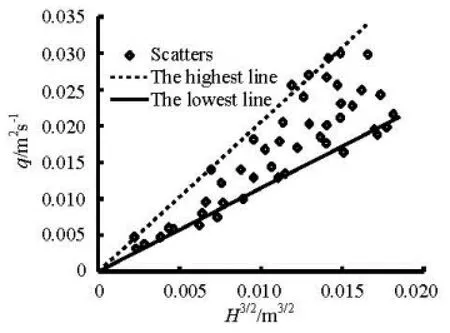
Fig.17 Relationship of q-H3/2
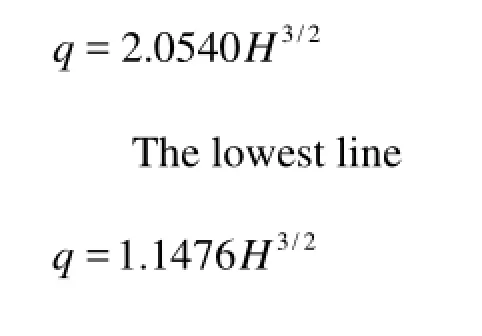
Figure 17 illustrates the correlation between q and3/2H based on the experimental data for Cases 1-12. In Fig.17, the dashed and solid lines indicate the highest and lowest envelope relations, respectively. The following empirical equations can be obtained by fitting data to estimate the correlations by the least squares method based on the experimental data:
The highest line
3. Conclusions and perspectives
The overtopping erosion process of the non-cohesive levee or dike is investigated in this paper through a series of laboratory experiments assisted by a 2-D numerical model. It is demonstrated that the overtopping erosion process is related to the river water level, the river discharge, the levee materials, and other factors. The breach develops faster when the initial water level above the breach is higher. The greater the discharge in the river, the larger the final width of the breach will be. The breach of the levee composed of larger grain-size materials expands faster initially, but slower afterwards. The water level in the outer river declines rapidly and the water level in the inner river rises rapidly at the initial stage of the breach. Afterwards, both go down until the stability is established. The discharge through the breach is affected by the breach width as well as the water level above the breach, which can be calculated by the sideweir-formula with a non-constant flow factor. On the other hand, the breach discharge evolution lags behind the water level above the breach.
This experimental investigation on the levee breach shows the characteristics of the breaching process and the discharge through the breach. Due to the great complexities involved in the breaching of the levees, the mechanism of the levee breaching is so far not understood satisfactorily. This study concerns only with the non-cohesive levee under idealized conditions. Further investigations are warranted under complex boundary conditions such as cohesive or compound or two-staged banks to develop more practical tools for levee management and flood control. It is also recommended that the scale effect in levee breaching experiments should always be clearly recognized.
[1] ASCE/EWRI TASK COMMITTEE ON DAM/LEVEE BREACHING. Earthen embankment breaching[J]. Journal of Hydraulic Engineering, ASCE, 2011, 137(12): 1549-1564.
[2] ALONSO E. E., GENS A. Aznalcollar dam failure. Part 1: Field observations and material properties[J]. Geotechnique, 2006, 56 (3): 165-183.
[3] LI Yun, LI Jun. Review of experimental study on dambreak[J]. Advances in water science, 2009, 20(2): 304-310(in Chinese).
[4] HOEEG K., LOEVOLL A. and VASKINN K. A. Stability and breaching of embankment dams: Field tests on 6 m high dams[J]. International Journal on Hydropower and Dams, 2004,11(1): 88-92.
[5] ZHANG Jian-yun, LI Yun and XUAN Guo-xiang et al. Overtopping breaching of cohesive homogeneous earth dam with different cohesive strengths[J]. Science in China, Series E: Technological Sciences, 2009, 52(10): 3024-3029.
[6] COLEMAN S. E., ANDREWS D. P. and WEBBY M. G. Overtopping breaching of noncohesive homogeneous embankments[J]. Journal Hydraulic Engineering, ASCE, 2002, 128(9): 829-838.
[7] FUJISAWA K., KOBAYASHI A. and AOYAMA S. Theoretical description of embankment erosion owing to overflow[J]. Geotechnique, 2009, 59(8): 661-671.
[8] SCHMOCKER L., HAGER W. H. Modeling dike breaching due to overtopping[J]. Journal of Hydraulic Research, 2009, 47(5): 585-597.
[9] GREGORETTI C., MALTAURO A. and LANZONI S. Laboratory experimental on the failure of course homogeneous sediment natural dams on a sloping bed[J]. Journal of Hydraulic Engineering, ASCE, 2010, 136(11): 868-879.
[10] ZHU Yong-hui, VISSER P. J. and VRIJLING J. K. et al. Experimental investigation on breaching of embankments[J]. Science China Technological Sciences, 2011, 54(1): 148-155.
[11] YAN Jun, CAO Zhi-xian. Experimental study of landslide dam-break flood over erodible bed in open channels[J]. Journal of Hydrodynamics, 2009, 21(1): 124-130.
[12] NIU Zhi-pan, XU Wei-lin and LI Nai-wen et al. Experimental investigation of the failure of cascade landslide dams[J]. Journal of Hydrodynamics, 2012, 24(3): 430-441.
[13] KAMRATH P., DISSE M. and HAMMER M. et al. Assessment of discharge through a dike breach and simulation of flood wave propagation[J]. Natural Hazards, 2006, 38: 63-78.
[14] SCHMOCKER L., GRECO M. and HAGER W. H. 1D numerical evaluation of dike erosion due to overtopping[J]. Journal of Hydraulic Research, 2010, 48(5): 573-582.
[15] HUANG Jin-chi, HE Xiao-yan. Unified 2-D numerical model for simulating dam break wave propagation[J]. Journal of Hydraulic Engineering, 2006, 37(2): 222-226(in Chinese).
[16] CHINNARASRI C., SAELIM A. Semi-parametric model of an overtopped dike breach[C]. Proceedings of the Institution of Civil Engineers-water Management, 2009, 162(4): 289-296.
[17] PICKERT G., BIEBERSTEIN A. and WEITBRECHT V. Breaching of overtopped river embankments controlled by ap parent cohesion[J]. Journal of Hydraulic Research, 2011, 49(2): 143-156.
[18] VISSER P. J., ZHU Yong-hui. Model for breach growth in non-cohesive soil dikes[J]. Journal of Yangtze River Scientific Research Institute, 2003, 20(3): 35-38(in Chinese).
[19] YU Ming-hui, DENG Yin-ling and QIN Lian-chao et al. Numerical simulation of levee breach flows under complex boundary conditions[J]. Journal of Hydrodynamics, 2009, 21(5): 633-639.
[20] HAGER W. H. Lateral outflow over side weirs[J]. Journal Hydraulic Engineering, ASCE, 1987, 113(4): 401-504.
10.1016/S1001-6058(11)60398-4
* Project supported by the National Basic Research and Development Program of China (973 Program, Grant No. 2011CB403304), the National Natural Science Foundation of China (Grant No. 11272240).
Biography: YU Ming-hui (1969-), Female, Ph. D., Professor
猜你喜欢
杂志排行

水动力学研究与进展 B辑的其它文章
- Ship bow waves*
- Progress in numerical simulation of cavitating water jets*
- Three-dimensional large eddy simulation and vorticity analysis of unsteady cavitating flow around a twisted hydrofoil*
- Numerical simulation of shallow-water flooding using a two-dimensional finite volume model*
- Dynamical analysis of high-pressure supercritical carbon dioxide jet in well drilling*
- Micropaticle transport and deposition from electrokinetic microflow in a 90obend*