Calculation of impact factor of vibrator oscillation in offset printing based on fuzzy controller and genetic algorithm*
2015-02-15ChuHongyan初红艳YangJunjingCaiLigang
Chu Hongyan (初红艳), Yang Junjing, Cai Ligang
(College of Mechanical Engineering and Applied Electronics Technology, Beijing University of Technology, Beijing 100124, P.R.China)
Calculation of impact factor of vibrator oscillation in offset printing based on fuzzy controller and genetic algorithm*
Chu Hongyan (初红艳)*, Yang Junjing, Cai Ligang
(College of Mechanical Engineering and Applied Electronics Technology, Beijing University of Technology, Beijing 100124, P.R.China)
In the inking system of an offset printing press, a vibrator roller distributes ink not only in the circumferential direction but also in the axial direction. In the control process, if ink amount is determined only by the dot area coverage without considering the impact of vibrator roller’s oscillation, the printing colour quality will be reduced. This paper describes a method of calculating the impact factor of vibrator roller’s oscillation. First, the oscillation performance is analyzed and sample data of impact factor is got. Then, a fuzzy controller used for the calculation of the impact factor is designed, and genetic algorithm is used to optimize membership functions and obtain the fuzzy control rules automatically. This fuzzy controller can be used to calculate impact factors for any printing condition, and the impact factors can be used for ink amount control in printing process and it is important for higher printing colour quality and lowering ink and paper waste.
offset printing, colour quality control, impact factor, fuzzy control, genetic algorithm
0 Introduction
As people’s requirement for printing quality is increasing, printing quality control is becoming more and more important. Ink thickness on the substrate (for example, paper) affects printing quality and generally causes many printing problems. Thus, ink amount control in an offset printing process is important for printing quality.
The role of the inking system of an offset printing press is to deliver ink from ink fountain to printing plate. Vibrator rollers are the main rollers of the inking system, which rotate to distribute ink in the circumferential direction and oscillate in the axial direction to distribute ink evenly in the axial direction.
In a practical printing process, the vibrator rollers may cause ink flowing from one ink zone to other adjacent zones. If the ink key openings, which determine the ink feeding amount, are determined only by dot area coverage and the impact of oscillation is ignored, the accuracy of the ink key opening setting and the printing quality will be inevitably reduced.
In the printing process, the impact of oscillation cannot be obtained through stopping the vibrator roller, so the experimental method is very difficult. The method of computer simulation to perform dynamic research and optimization of inking systems is widely adopted. Yu and Liu[1]analysed the impact of oscillation length on the ink flow and the ink distribution when different ink zones are used as the ink feeding zones, by simulation of the inking system of a Heidelberg Speedmaster offset printing press. A method to forecast the ink flow characteristics of offset printing press was proposed by Yu and Liu[2]. The method used sample data of the ink distribution on paper obtained by simulation to train a BP neural network, and used the trained BP neural network to build a matrix that reflects the ink flow characteristics. This matrix model can predict the ink distribution on paper for a certain ink amount. By simulating the web offset printing process, Chou[3]found that 1) the extent of the lateral ink distribution increases with the increasing of oscillation length, 2) the oscillation length has a greater impact than the oscillation rate, and 3) the ink tends to flow further away from the ink feeding zone as the image coverage decreases.
Currently, for either manual adjustment or automatic control of the ink amount, most of researches ignore the impact of oscillation. And most of simulation analysis determines the performance curves of the oscillation, but there are few quantitative analysis and applications of the impact. The problems that need to be solved include determining what affects the impact of oscillation, how to quantify the impact factors, and how to apply the impact factors to the adjustment of ink amount.
A method for calculating the impact factors of oscillation for any printing condition is described by using an optimised fuzzy controller. Based on sample data from a simulation analysis of the oscillation performance, fuzzy control rules can be got using a genetic algorithm. Simultaneously, membership functions can also be optimized through the genetic algorithm. Thus the impact factors can be quantified.
1 Impact factors of oscillation
1.1 Oscillation performance analysis
The oscillation performance of the vibrator roller is determined by three parameters: oscillation length, oscillation rate and initial phase.
Oscillation length is the distance that vibrator rollers oscillate back and forth in the axial direction[4]. In this paper, oscillation length is represented by the number of ink zones, that is, if the oscillation length is 2, and the width of each ink zone is 30mm, that means the distance that vibrator rollers oscillate back and forth in the axial direction is 60mm.
Oscillation rate is the ratio of the oscillation speed of the vibrator roller to the rotation speed of the printing plate cylinder. For example, the oscillation rate is l:3, that means the printing plate cylinder rotates 3 circles while the vibrator roller oscillates 1 back and forth[4]. Here, oscillation rate of l:3 is higher than l:6.
Initial phase: if 0 is the phase angle that the vibrator roller oscillates in one cycle, then the phase angle when the vibrator roller begins to oscillate is called initial phase[4].
Wu[5]built a model of the relative rolling between the vibrator roller and the rider roller to study the oscillation performance. In this model, the vibrator roller oscillates in the axial direction while rotating, and the rider roller rotates only. To study the oscillation performance when an intermediate ink zone is the ink feeding zone, only the intermediatehth (h≠1andh≠n)inkzoneissetastheinkfeedingzone.Theinktransferratiobetweenthetwoinkrollersissettobe0.5.Thentheoscillationperformancecurvesaregot.Thecurvescanbeapproximatedbytheirenvelopecurves,thatis,normaldistributioncurves,asshowninFig.1.
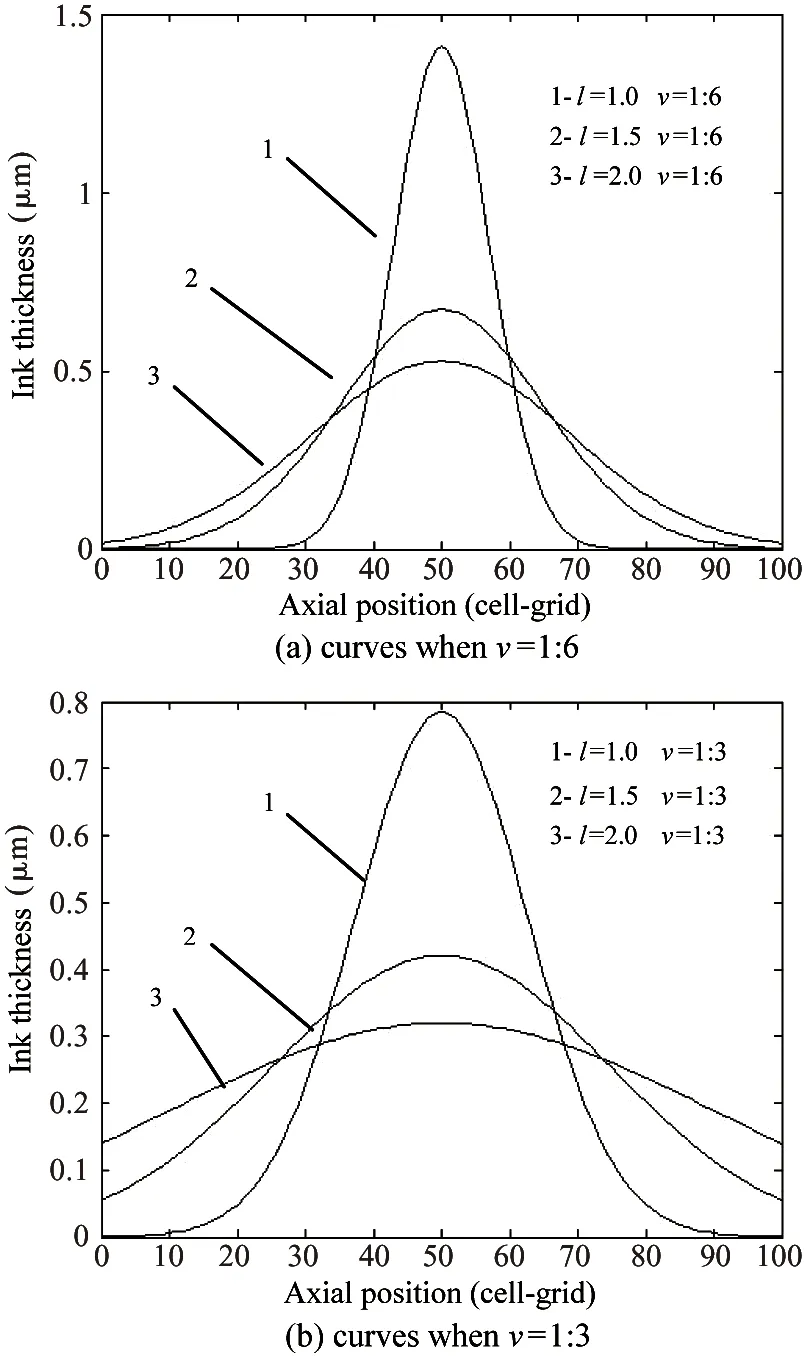
Fig.1 Envelope curves of the oscillation performance
In Fig.1, the curves 1, 2, 3 are the ink thickness distribution curves for different conditions. The extent of the lateral ink distribution increases with the increasing of oscillation length and oscillation rate, but the initial phase has little impact on it (the impact of initial phase on the performance is not listed in Fig.1). The greater the extent of the lateral ink distribution is, the lower the ink amount left in the ink feeding zone is, the greater the ink amount flow to the adjacent ink zones is, and more ink zones are impacted. The lateral ink distribution leads to unconformity between the actual and the expected ink thickness, thus reduces the printing quality.
1.2 Impact factor
When one ink zone is fed ink, there is a certain proportion of ink left in its own zone and there is also a certain proportion of ink flow to its adjacent ink zones. These proportions are denoted as the impact factors of their own zone and their adjacent zones. That is, the impact factor of each ink zone is the proportion of the ink amount in each ink zone to the total ink amount.
The envelope curves are normal curves, so the impact factors of two symmetrical ink zones are the same. The integrations of each ink zone are calculated and divided by the total ink amount, then the impact factors are determined, as listed in Table 1.
In Table 1, the data columns of 0, 1, …, 5 are the impact factors of the ink feeding zone and the zones adjacent to it in the left. It can be seen in Table 1 that most of ink stays in the ink feeding zone, and its impact factor is the largest, the second largest impact factor is in thed=1inkzone,andtheimpactfactorsofotheradjacentinkzonesbecomesmallergraduallywiththeincreaseoftheirinkzonedistancesandtendingtobe0.Whentheoscillationrateisconstant,thegreatertheoscillationlengthis,thesmallertheimpactfactoroftheinkfeedingzoneis,andthemoreinkzonesareimpacted.Whentheoscillationlengthisconstant,thegreatertheoscillationrateis,thesmallertheimpactfactoroftheinkfeedingzoneis,andthemoreinkzonesareimpacted.
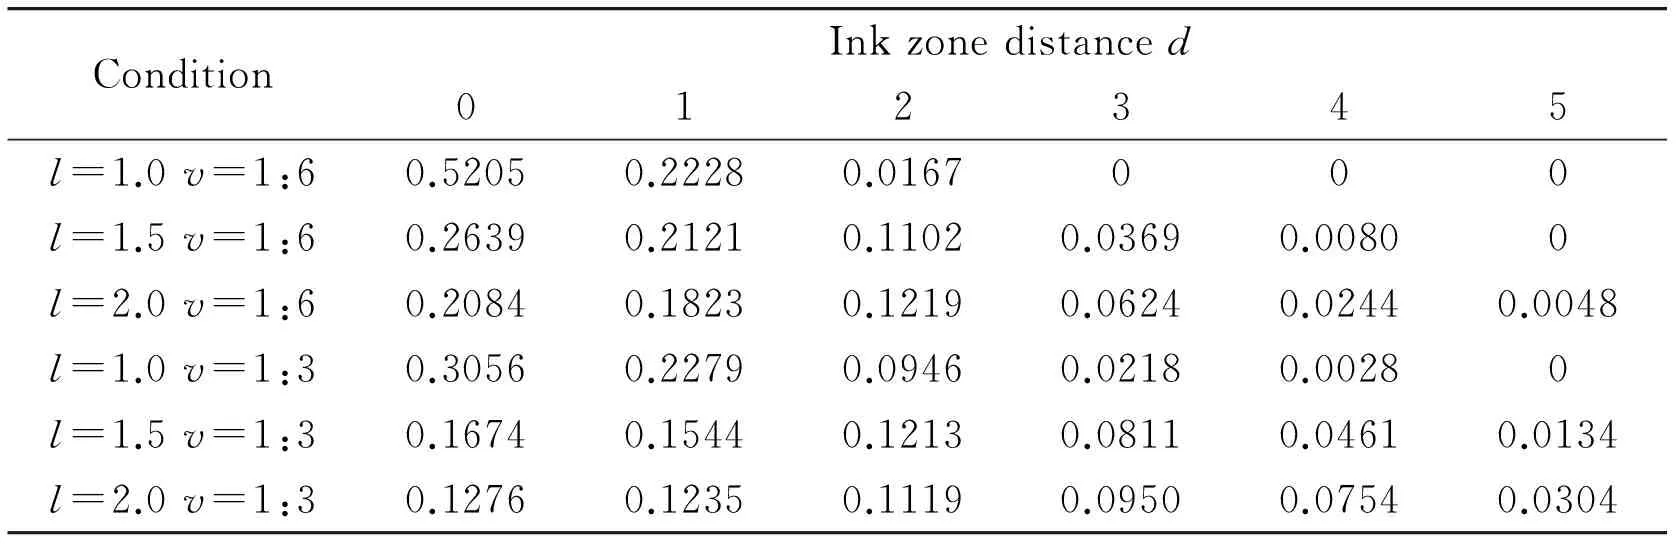
Table 1 Oscillation impact factors
Table 2 is generated from Table 1 for the following research. Data are rounded to 2 digits after the decimal point, and data of the symmetrical left and right ink zones are added to ensure that the errors of the ink feeding zones and thed=1inkzonesareassmallaspossiblewhencalculatingtheimpactfactorsthroughthefuzzycontroller,andthedatathatislessthan0.06isremoved.
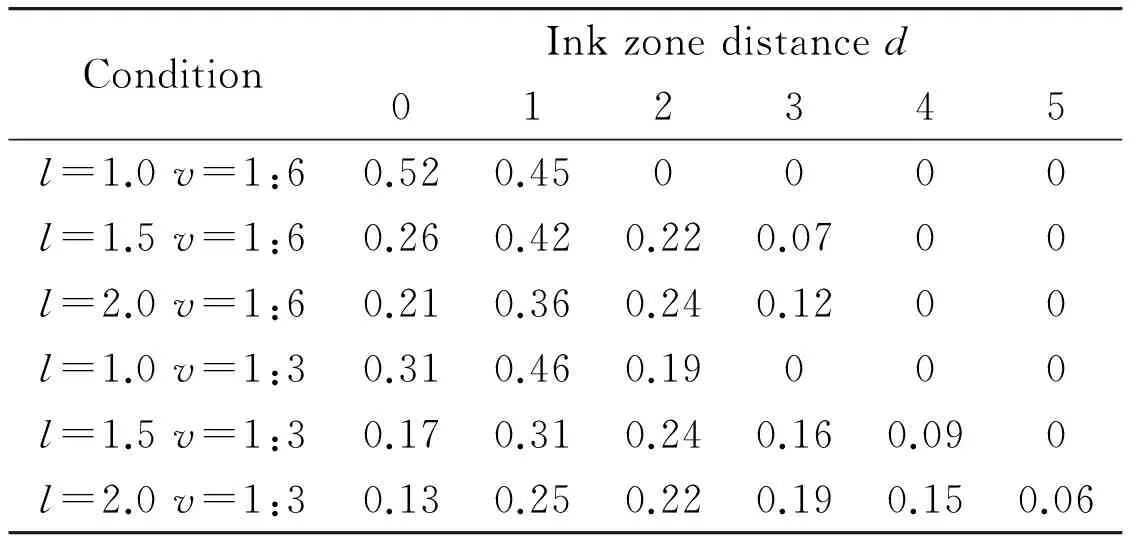
Table 2 Final oscillation impact factors
From Table 2, six groups of sample data (d、l、v、w)areobtained,wheredrepresents the ink zone distance,lrepresents the oscillation length,vrepresents the oscillation rate, andwis the impact factor. In this paper, the impact factorwof the ink feeding zone is the impact factor of the ink feeding zone itself, and the impact factorwof the adjacent ink zones is the sum of the impact factors of two symmetrical ink zones. For example, sample data (1,1.5,6,0.42) indicate that the oscillation length is 1.5; the printing plate cylinder rotates 6 circles while the vibrator roller oscillates 1 back and forth; 42% of the ink flows to the two symmetricald=1inkzones,andtheimpactfactorofoneofthezonesis42%/2=21%.
2 Fuzzycontrollerforimpactfactor
Whenoscillationperformancecurvesaregotthroughsimulation,impactfactorscanbecalculatedaccordingtotheabovemethod.Buttheimpactofoscillationiscomplexandwhentheprintingconditionschange,thesimulationandcalculationhavetobecarriedoutagaintogettheimpactfactors.Tosolvetheproblem,thispaperdesignsafuzzycontrollertocalculatetheimpactfactorsforanyprintingconditions.
2.1Inputandoutputvariables
Accordingtoaboveanalysis,theinputvariablesofthefuzzycontrolleraredeterminedtobetheinkzonedistance,theoscillationlength,andtheoscillationrate,andtheoutputvariableistheimpactfactor.ThispaperdesignsaMamdanifuzzycontrollerbasedonthesampledatainTable2,andusesageneticalgorithmtooptimisethemembershipfunctionsandgeneratethefuzzycontrolrulesautomatically.Thentheimpactofoscillationcanbecalculatedquantitativelyfordifferentprintingconditions.TheschematicdiagramofthefuzzycontrollerisshowninFig.2.D,L,Vare language variables corresponding tod,l,vrespectively.
2.2 Quantisation factor and scaling factor
Assuming that the ink feeding zone impacts at mostmink zones, the practical domain of variabledis [0m], the maximum oscillation length ispink zones,and the practical domain of variablelis [0,p], the printing plate cylinder rotatesqcircles at most while the vibrator roller oscillates 1 back and forth, and the practical domain of variablevis [0,q], the impact factorwis a positive number that is less than 1, supposing that the maximal value of the impact factor iss, and its practical domain is [0,s]. The practical domains ofd、landvare transformed into fuzzy domain [0,1],thenthequantisationfactorscanbeobtainedkd=1/m;kl=1/p;kv=1/q.Thefuzzydomainofwis the same as its practical domain, so the scaling factor iskw=1.
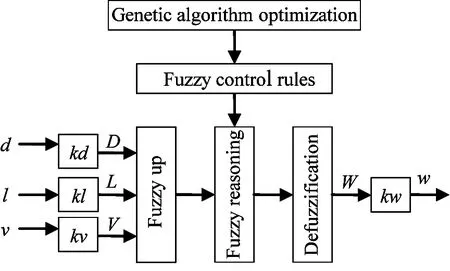
Fig.2 Schematic diagram of the fuzzy controller
Inthisresearch,themaximumoftheinputvariableisdeterminedaccordingtothesampledata:m=5,p=2,q=6,s=0.6,sokd=1/5,kl=1/2,kv=1/6,andthescalingfactoriskw=1.
Forapracticaloffsetprintingpress,theoscillationlengthandtheoscillationratemayexceedtherangeofthesimulationconditionsinRef.[5],thenthepracticaldomainoftheoscillationlengthland the oscillation ratevshould be determined according to the practical condition, and the practical domain ofdandsshouldbedeterminedafterperformingasimulationanalysis.Thenthequantisationfactorscanbecalculatedbytheappropriateformula.
2.3Membershipfunctions,controlrules,anddefuzzificationmethod
Here,eachinputvariablehas3fuzzysetsthataredenotedasS,M, andB, which represent small, medium, and large respectively. To obtain an accurate output, the output variable has 7 variable values denoted asS3,S2,S1,M,B1,B2, andB3. And the Gaussian function is chosen as the membership function of the input and output variable:
y(x,c,σ)=exp(-(x-c)2/2σ2)
(1)
wherecis the centre of the membership function, andσisthewidthofthemembershipfunction.
Thereare33=27rulestocovertheentireinputspace,thatis,toensurethecompletenessoftherules[6].The27rulesarelisted:
IFD=SL=SV=STHENW=?
IFD=SL=SV=MTHENW=?
……
IFD=BL=BV=MTHENW=?
IFD=BL=BV=BTHENW=?
where,Win each rule is the parameter to be optimised, i.e.,S3,S2,S1,M,B1,B2, andB3.
Finally, the centroid method is chosen as the defuzzification method.
3 Fuzzy controller optimisation
This research uses the genetic algorithm to determine the membership functions and the control rules simultaneously based on sample data. When calculating impact factors, the error between the output of the fuzzy controller and the sample data should be ensured to be the smallest.
3.1 Encoding and decoding
The researches on fuzzy control show that the shape of the membership function has little effect on the controller, and its coverage on the domain has great effect on the characteristics of controller[7]. So centrecof each membership function remains constant, its values are distributed evenly in the fuzzy domain, and widthσofeachmembershipfunctionistobeoptimised.Eachinputvariablehas3parameterstobeoptimised,so3inputvariableshave9parameterstobeoptimisedtotally,andtherangeofeachσispreliminarilydefinedas[0.05, 0.4]accordingtoexperience.Anoutputvariablehas7parameterstobeoptimised,andtheirrangesareall[0.01, 0.08].
The7languagevaluesoftheoutputvariableWare expressed as 1, 2, 3, 4, 5, 6, 7 in turn. To find the best solution as soon as possible, the range of the output variableWis given preliminarily based on the sample data: whenDisS, the range ofWis [1, 2], whenDisM, the range is [2, 5], whenDisB, the range is [2, 7]. Because there are 27 rules, there are 27 parameters to be optimised.
The membership functions and control rules are encoded together, so the final coding length is 9+7+27=43. The 43 values compose a chromosome. The decomposition schematic diagram of the code string is shown in Fig.3.
3.2 Fitness function
Because most of the ink stays in its own zone, then the adjacent ink zoned=1,andtheinkamountofotheradjacentinkzonesbecomesmallergraduallywith their ink zone distances increasing and tend to be 0. So in the optimisation process, when the conditionsd、l、vof sample data are the input variables of the fuzzy controller, we should ensure that all the errors between the output of fuzzy controller and the sample data are minimised, especially, the errors of the ink feeding zone and the adjacent ink zoned=1.Tomeettheaboverequirements,anerrorweightingtablemustbemade.
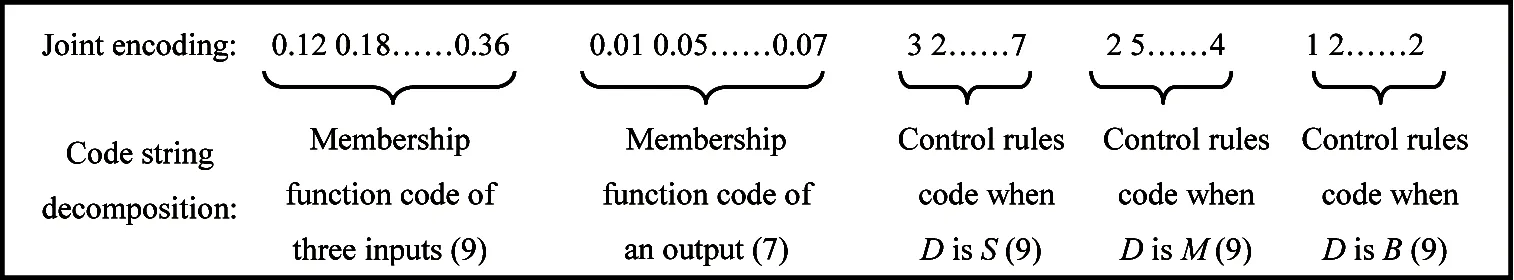
Fig.3 Decomposition schematic diagram of a chromosome encoded
Throughoptimisationbysettingtheerrorweightingtablerepeatedly,thispapersuggeststhatiftheimpactfactoroftheinkfeedingzoneisnotlessthan0.5,theerrorweightingsoftheinkfeedingzoneandtheadjacentinkzonesareequaltotheirimpactfactors;iftheimpactfactoroftheinkfeedingzoneislessthan0.5,theerrorweightingoftheinkfeedingzoneis0.4,andtheerrorweightingsoftheadjacentinkzonesarecalculatedby
(2)

ThefinalerrorweightingscorrespondingtoTable2areshowninTable3.

Table 3 Error weightings of impact factors
Therefore, whenl,vare determined (thejth condition), the accumulated error is
(3)
where,biistheerrorbetweentheoutputoffuzzycontrollerandthesampledata.
Thefinalobjectivefunctionis
(4)
where,zis the number of conditions, it is 6 in Table 3.
The fitness function must be non-negative and maximised, so it is given by
J=10-f
(5)
Thus,theproblemofdesigninganoptimalfuzzycontrolleristransformedintotheproblemofoptimisationofparametersthatmakesJthe largest.
3.3 Genetic operations
Here, the size of the initial population isN=100,theterminationgenerationisT=1000,thecrossoverprobabilityispc=0.9andthemutationprobabilityispm=0.1.
Thefitnessproportionalmodel(theroulettewheelselection)isadoptedsothatthebestindividualistransmittedcontinuouslywhileselectingtheexcellentindividual.Thegreatertheindividualfitnessis,thehighertheselectedprobabilityis[8].Thearithmeticcrossoverischosen.Twoindividualsarechosenasparents,andthelinearcombinationoftheparentsisusedtoobtaintwooffsprings[9].Uniformmutationisadoptedasthemutationoperation.Avariationpointisgeneratedrandomly,anditsoriginalvalueisreplacedbyarandomnumberthatisinthevaluerangeofthispoint’scorrespondinggene.
4 Optimizationresultsandanalysis
Sixgroupsofsampledataareusedforthemethodinthispaper.Themembershipfunctionsthatareoptimisedthroughgeneticalgorithmareobtained,asshowninFig.4.Fuzzycontrolrulesaregeneratedaswell,aslistedinTable4.
TheoptimizedfuzzycontrollerisobtainedusingthemembershipfunctionsinFig.4andthecontrolrulesinTable4.Whenthesampledataisinputtotheoptimizedfuzzycontroller,theoutputofthefuzzycontrollerisobtained,aslistedinTable5.
InTable5,theoutputoftheoptimisedfuzzycontrollerconformstothetrendofthesampledatainTable2,butthefollowingphenomenamaybepresent,forexample,whenl=2.0andv=1:3,theimpactfactoroftheinkfeedingzoneis0.12,andthatofoneoftheadjacentinkzonesd=1is0.26/2=0.13,thefactorsarealmostequal;Theimpactfactoroftheadjacentinkzonesd=4isequaltothatofd=5.
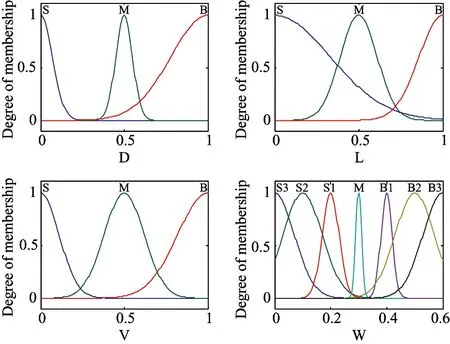
Fig.4 Optimization results of the membership functions

Table 4 Optimization results of the fuzzy control rules

Table 5 Output of the optimized fuzzy controller
The error between the output of the fuzzy controller and the sample data is shown in Table 6. In Table 6, Er. means error, and REr. means relative error.
From Table 6 it can be seen that the error between the output of the optimized fuzzy controller and the sample data is less than 0.07, which corresponds to the relative error of 15.22%; the maximal relative error is 85.71%, of which the absolute error is 0.06; the errors of the adjacent ink zonesd≥1arerelativelylarge,buttheyarethesumoftheerrorsoftwosymmetricalinkzones.Ingeneral,theoptimizationmethodthatconsiderstheerrorandtherelativeerrorsimultaneouslycanensurethat1)alltheerrorsbetweentheoutputoffuzzycontrollerandthesampledataareminimized, 2)theerroroftheinkfeedingzoneissmaller,and3)theerroroftheadjacentinkzonesd=1isalsosmaller.
Foranyprintingcondition,whenanintermediateinkzoneisfedink,theinkzonedistance,oscillationlengthandoscillationrateareinputtotheoptimizedfuzzycontroller,thentheimpactfactorscanbecalculated.Table7isanexample.

Table 6 Error between the output of the optimized fuzzy controller and the sample data
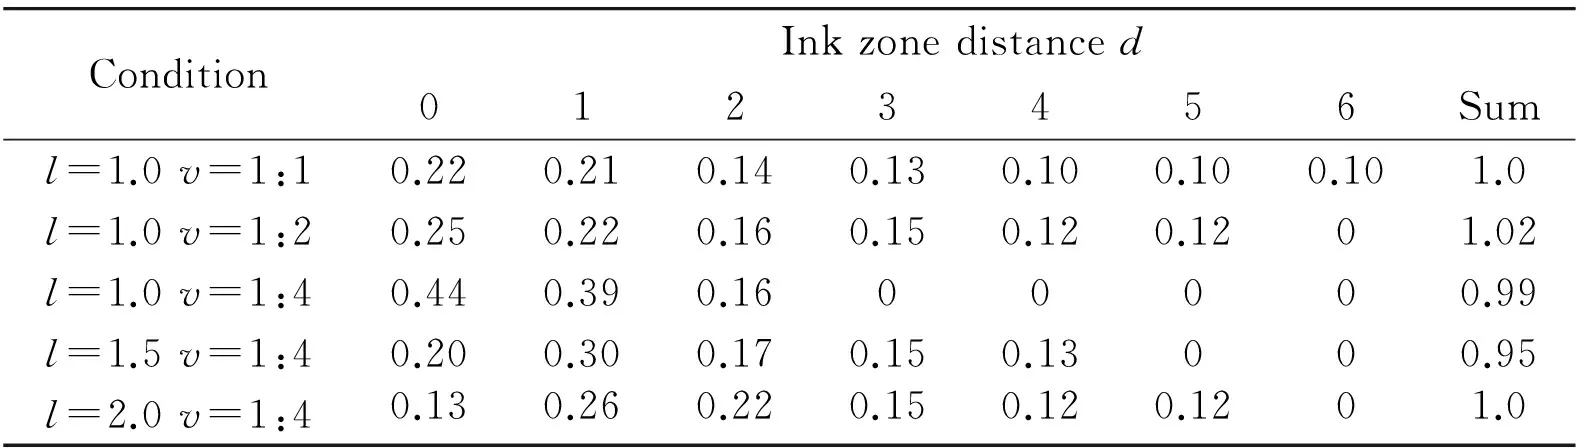
Table 7 Impact factors for different conditions
Comparing Table 7 with Table 2, it can be observed that they have the same trend. So the impact factors for any other printing conditions can be calculated through the optimized fuzzy controller, and the results conform to the simulation analysis of the oscillation performance.
5 Impact factors when the end ink zone is set as the ink feeding zone
The above optimized fuzzy controller can be applied to calculate the impact factors when the ink feeding zone is the intermediate zone. And when the ink feeding zone is the end ink zone, the impact factors may be different. For example, when the first ink zone is fed ink, ink only flows to one side. Yu and Liu[1]conducted some simulation analysis of oscillation performance for the cases when different ink zones are set to be the ink feeding zones, and it can be got from the analysis:
(1) When the first ink zone is the ink feeding zone, the impact factor of its own is almost the same as the sum of the impact factors of the ink feeding zone and that of its adjacent zone when the intermediate ink zone is the ink feeding zone.
(2) When the first ink zone is the ink feeding zone, the impact factors of the adjacent ink zones are almost the same as that of the intermediate ink zone acting as the ink feeding zone.
(3) When the second, third, or fourth ink zone is the ink feeding zone, the impact factors of their own and the adjacent ink zones are almost the same as that of the intermediate ink zone acting as the ink feeding zone.
According to the above description, when the end ink zone is the ink feeding zone for any printing condition, the impact factors of its own and the adjacent ink zones can be deduced as follows:
(1) The impact factor of the ink feeding zone and one of the two symmetrical ink zonesd=1arecalculatedthroughtheaboveoptimisedfuzzycontrollerwhenanintermediateinkzoneistheinkfeedingzone.Thentheimpactfactoroftheendinkzonecanbecalculatedasfollowswhenitselfistheinkfeedingzone:
y=x1+x2
(6)
where,yis the impact factor of the end ink zone;x1is the impact factor of the ink feeding zone,x2is the impact factor of one of the two symmetrical ink zonesd=1,whenanintermediatezoneistheinkfeedingzone.
(2)Theimpactfactorsofotherinkzonesarethesameastheimpactfactorswhenanintermediateinkzoneistheinkfeedingzone.
6 Conclusions
Afuzzycontrollerforoscillationimpactfactorisdesignedbasedonthesampledata,whichisextractedfromasimulationanalysisoftheoscillationperformance,andthegeneticalgorithmisusedtooptimizethemembershipfunctionsandthefuzzycontrolrulesautomatically.Thefuzzycontrollercanbewidelyusedtocalculatetheoscillationimpactfactorsforanyprintingcondition.Researchofthispaperisimportantforimprovingcolourquality.
Thereisstillsomethingspecialtobeexplained:
(1)Theoptimizedfuzzycontrollerinthispaperissuitableforanoffsetprintingpresswheretheinktransferratiobetweentwoinkrollersis0.5,oscillationlengthisnolargerthan2inkzones,andoscillationrateisnosmallerthan1:6.
(2)Whenusingthemethodinthispaper,therangeofinputvariablemaybeexpandedaccordingtotheactualconditions,andmoresimulationanalysismaybeneededtogetthesampledata.
[1] Yu J Y, Liu Z. Simulation the effects of vibrator oscillation of offset printing.PackagingEngineering, 2009, 30(11): 66-72
[2] Yu J Y, Liu Z. Study on the ink flow model of lithographic printing. In: Proceedings of the 4th International Congress on Image and Signal Processing, Shanghai, China, 2011. 4: 1757-1761
[3] Chou S M. Computer simulation of offset printing: II. Effects of vibrator oscillation and image layout. In: TAGA Proceedings - Disseminating Graphic Arts Research Internationally Since 1948, Chicago, USA, 1997. 94-118
[4] Ma R F. Property analysis and study on computer simulation of the web offset press inking system: [M.S dissertation]. Xi’an, China: Xi’an University of Technology, 2008. 31-32
[5] Wu Q M. Study for computer simulation of the offset inking system: [M.S dissertation]. Xi’an, China: Xi’an University of Technology, 2005. 37-42
[6] Qiao M L, Zhang J Y, Wen Y Y. Optimizing approach for fuzzy control rule based on genetic algorithm.ComputerMeasurement&Control, 2006, 14(10): 1349-1351
[7] Li H., Han H, Han, C Z, et al. Optimization of fuzzy logic controller based on genetic algorithm.JournalofXi’anJiaotongUniversity, 2002, 36(4): 385-389
[8] Liu X H, Kuai R, Guan P, et al. Fuzzy-PID control for ARC furnace electrode regulator system based on genetic algorithm. In: Proceedings of the International Conference on Machine Learning and Cybernetics, Baoding, China, 2009. 2: 683-689
[9] Lei Y J. MATLAB genetic algorithm toolbox and application. Xi’an, China: Xidian university press, 2005. 55-58
Chu Hongyan, born in 1972. She received her Ph.D degrees in Beijing University of Technology, in 2003. She also received her B.S. and M.S. degrees from Jilin University of Technology in 1994 and 1997 respectively. Her research interests include sheet metal forming, production planning and scheduling, and printing colour quality control.
10.3772/j.issn.1006-6748.2015.01.003
*Supported by the National Science and Technology Supporting Program (No. 2012BAF13B05-1), National Natural Science Foundation (No. 51105009) and Beijing Natural Science Foundation (No. 3113025).
*To whom correspondence should be addressed. E-mail: chuhongyan@bjut.edu.cnReceived on Oct. 15, 2013
猜你喜欢
杂志排行

High Technology Letters的其它文章
- Maneuvering target tracking algorithm based on cubature Kalman filter with observation iterated update*
- Realization of a tunable analog predistorter using parallel combination technique for laser driver applications*
- Data organization and management of mine typical object spectral libraries*
- Retrieval and analysis of sea surface air temperature and relative humidity*
- Filtered-beam-search-based approach for operating theatre scheduling*
- Research on assessing compression quality taking into account the space-borne remote sensing images*