In situ temperature measurement of vapor based on atomic speed selection
2023-03-13LuYu于露LiCao曹俐ZiqianYue岳子骞LinLi李林andYueyangZhai翟跃阳
Lu Yu(于露) Li Cao(曹俐) Ziqian Yue(岳子骞) Lin Li(李林) and Yueyang Zhai(翟跃阳)
1School of Instrument Science and Opto-electronics Engineering,Beihang University,Beijing 100191,China 2Research Institute of Frontier Science,Beihang University,Beijing 100191,China
Keywords: temperature measurement, saturated absorption spectrum, Doppler broadening, atomic velocity distribution
1.Introduction
Optical cells containing alkali atomic vapor are widely used in atomic precision instruments such as atomic clocks[1,2]and magnetometers.[3-6]The performance of these instruments is sensitive to the accuracy of temperature measurement of the alkali atomic vapor.Contacted temperature transducers such as thermistors and thermocouples are the most common method and can achieve high accuracy.[7-10]However,only the surface temperature rather than the internal temperature of the vapor cells can be sensed, and the internal temperature distribution is a controversial issue.[11-16]Optical thermometry is an approach that avoids the above-mentioned problems.[17-20]In particular,the Doppler effect can link thermal energy with atomic spectral lines to measure gas temperature.Under low-pressure conditions, the Doppler effect is the main source of line broadening.According to the Boltzmann distribution,with the transition frequencyν,the Doppler widtheliminates the overlapping caused by the simultaneous transition of hyperfine levels on the spectrum, thereby simplifying the physical modeling.depends on the atomic massmand thermal energykBT,wherecis the speed of light.Thisin situgas thermometry is called Doppler broadening thermometry(DBT)and is widely used as an approach for estimating the value of the Boltzmann constant.[21,22]The main challenge of this method is that it is difficult to obtain a good enough physical model to fit the experimental data, and relative standard uncertainties of less than 10 ppm are difficult to achieve.[23,24]
In this paper,a new method is proposed to obtain Doppler broadening of the atomic velocity distribution on the saturated absorption spectrum(SAS).The Doppler broadening obtained by this method only involves one hyperfine energy level of the alkali atom.Compared with DBT, thisin situthermometry
2.Theoretical method
In the absorption spectrum used in DBT,transitions of the hyperfine levels are submerged in Doppler broadening which is usually 100 MHz-10 GHz.The line width of SAS is close to the broadening of the atomic transition,and hyperfine splitting levels can be seen on the spectrum.[25]Figure 1(a)shows the SAS of the87Rb D2transition in our experiment.It can be seen that there are crossover peaks between every two natural resonance peaks.By analyzing the formation of crossover peaks, it is found that they can be used to select atoms with different velocities.[26-28]Taking the three-level system shown in Fig.1(b) as an example, the group of atoms with velocityV=±c(ν1-ν2)/(ν1+ν2) in the direction of the incident laser beam can resonate with both the pump beam and the probe beam at the frequency
at the same time according to the Doppler effect.In a conventional SAS, the pump beam and the probe beam are usually split from the same laser source and always have the same frequency.Therefore,the positions of the crossover peaks are fixed and always appear in the middle of two natural resonance peaks.
If two independently adjustable lasers are used as the pump beam and the probe beam,and the frequencies of them are no longer equal, the position of the crossover peaks may

the atom at the same speed can resonate with the probe beam and jump to levelν2.As shown in Fig.1(d), the crossover peaks appear at the position in Eq.(2)instead of(ν1+ν2)/2.By continuously adjusting the frequency of the pump laser,the speed of the atoms involved in the formation of the crossover peaks will continuously change,and the position of the crossover peaks also moves along the spectrum,as shown in Fig.1(e).When the speed is unchanged and the direction is the opposite,the situation is similar.So,two equal and opposite velocities of atoms correspond to a set of frequencies of pump beam and probe beam, and form a crossover.In the spectrum, there is a one-to-one correspondence between this position and the absolute value of the atomic velocity.
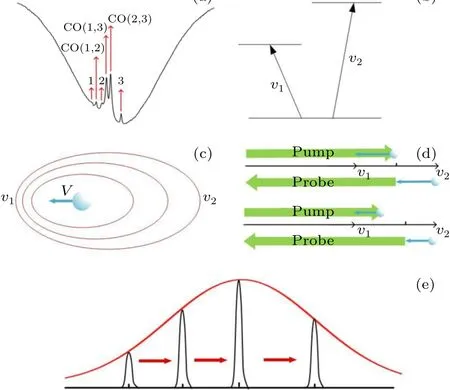
Fig.1.Schematic diagram of the temperature measurement principle: (a)saturated absorption spectrum of the 87Rb D2 transition; (b) a three-level atomic transition system;(c)the Doppler effect;(d)comparison of the positions of the traditional crossover peak and the shifted crossover peak;(e)the crossover peak moves along the spectrum.
Under low-pressure conditions where the thermal motion of the atoms conforms to a normal distribution,the atomic velocity distribution is Gaussian,and the number of atoms with zero velocity in the direction of the incident light is the largest.The greater the velocity in this direction,the fewer the atoms.Therefore,it can be inferred that a crossover peak will have a significant change in intensity during its movement,as shown by the red line in Fig.1(e).Assuming that the vapor cell environment does not change during the crossover movement,the relative intensity of the same crossover peak is determined by the atomic number density of the velocity group participating in peak formation,and the two are in direct proportion.[29]
3.Experimental setup and results
Figure 2 shows a schematic overview of our experimental setup.The pump and probe beams are from two laser sources that are both 780 nm which can resonate with the87Rb D2transition and have independent controllers.In this experiment,the laser source is operated to resonate with 5S1/2|F=2→5S3/2|F'=1,2,3 transitions.The frequency of the probe beam is modulated by a triangle wave,and its absorption spectrum is detected by the photodiode.In this paper, we choose the crossovers CO(1,3) and CO(2,3) as the target crossovers and manipulate them to move along the spectrum.According to the discussion in the previous section,the changing trend of the intensity will fit the Maxwell-Boltzmann distribution.

Fig.2.Experimental setup(HWP,half-wave plate;PBS,polarizing beam splitter;RTD,resistance temperature detector;HC,heating cylinder;PD,photodiode).
The Rb vapor cell used for this experiment is placed in a heating cylinder with two glass windows in the wall of the cylinder.The pump and probe beams are lifted by the reflectors so that they can travel through the windows and meet in the vapor cell in opposite directions.A platinum resistor is chosen as the temperature detector and is placed on the surface of the vapor cell.This is because temperature measurement with a platinum resistor has high precision and can be used as a reference.
A conventional SAS whose pump and probe beams are from the same laser source is also set up and its incident light from the probe beam is split.The spectrum of the conventional SAS and the SAS described in this paper can be shown in the spectrum at the same time, so that it is more convenient for distinguishing the crossovers.
The laser source of the probe beam is adjusted until the absorption spectrum of87Rb D2F=2-→F'can be seen on the oscilloscope.Then, the frequency of the pump beam is controlled to scan around the transition frequency.The movement of the crossover can be seen in the spectrum of the probe beam.We chose the strong crossover peaks CO(1,3)and CO(2,3)as the objects of observation.Figure 3(a)shows several positions of the crossovers while moving along the spectrum.The intensity variation of the crossovers is very obvious.In a temperature measurement period, the spectra at different positions are recorded as the crossovers traverse the range of Doppler broadening.In order to quantify the variation in the intensity of the crossovers,the spectrum needs to be Dopplerfree so that the relative intensity of the crossovers in different positions can be obtained.

Fig.3.(a) Three positions while crossovers move along the spectrum.Red dotted lines represent the intensities of CO(1,3), green dotted lines represent the intensities of CO(2,3).(b) The velocities of the crossover peaks at different positions.
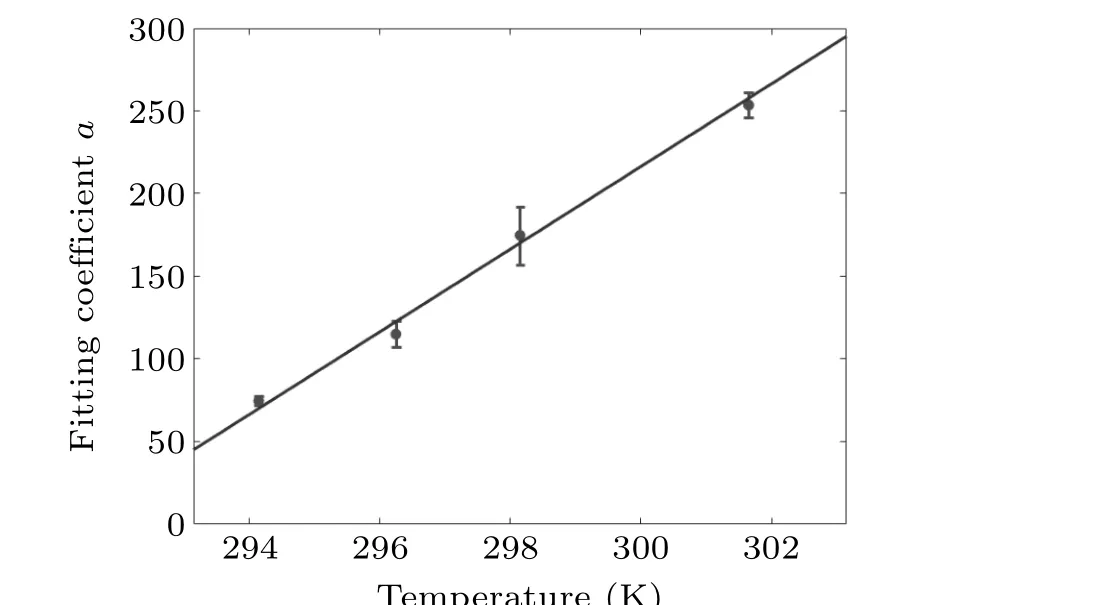
Fig.4.Experimental result.The abscissa is the temperature sensed by the thermistor and the ordinate is the fitting parameter.
Data processing of the spectrum includes obtaining the Doppler-free spectrum, extracting the peak of the crossovers CO(1,3) and CO(2,3) and calculating the relative intensity of the cross-absorption peak.The relative intensities of the crossover peaks at different positions are drawn in sequence on the same picture,as shown by the small circle in Fig.3(b).The intensity increases first and then decreases,which is consistent with the results predicted by the above theory.It can be seen that the changes in crossover intensity are highly similar to the Maxwell distribution of atomic velocity.
These data are then fitted with a Gaussian function.In the measured multiple sets of data,the correlation coefficient falls in the range 97.8%-99.6%.The fitted Gaussian distribution is normalized,and the approximate distribution curve of atomic velocity at this temperature can be theoretically obtained.According to the Maxwell-Boltzmann distribution
the temperature of the atom can be calculated from the fitting coefficients.
In the example experiment shown in Fig.4,several temperature points were selected between 297 K and 307 K.After the temperature of heating cylinder has been stabilized at a certain value, the pump beam frequency is adjusted back and forth several times along the spectrum and about 18-24 positions of crossover peaks are collected each time; multiple measurements can then be obtained at each temperature.Taking the temperature measured by the thermistor as the standard value,it can be found that the fitting coefficientaand the temperatureTconform to the following linear relationship:
The averaged result has an error of 0.3 K compared with the thermistor.Due to the small thermal conductivity of atomic vapor, the difference between the temperature inside the vapor cell and the temperature on the wall of the vapor cell is non-negligible.This will bring an error in the comparison and analysis if the value of thermistor serves as the standard,which is also a reason for the uncertainty of the data in our experiment.Our work can provide an experimental method for the study of vapor temperature distribution.The response time of our method is limited by the scanning speed of pump beam frequency and the calculation speed of data fitting.The calculation model we used is relatively simple, it can therefore achieve fast and real-time measurement of atomic vapor temperature.
4.Conclusion
This paper presents an innovativein situapproach for measuring the temperature of vapor cells.This new method is based on the principle that the crossovers in the SAS can select different velocity classes of atoms while moving along the spectrum.Then atomic temperature can be calculated according to the velocity distribution.This temperature measurement method can directly measure the temperature inside the vapor cell,which provides an effective approach for the experimental measurement of the temperature distribution of the vapor cell.We demonstrate the experimental setup and our results show good consistency with the platinum resistor method,thus demonstrating the potential of this method around room temperature.
Acknowledgment
Project supported by the National Natural Science Foundation of China(Grant No.61703025).
杂志排行

Chinese Physics B的其它文章
- Matrix integrable fifth-order mKdV equations and their soliton solutions
- Comparison of differential evolution,particle swarm optimization,quantum-behaved particle swarm optimization,and quantum evolutionary algorithm for preparation of quantum states
- Explicit K-symplectic methods for nonseparable non-canonical Hamiltonian systems
- Molecular dynamics study of interactions between edge dislocation and irradiation-induced defects in Fe-10Ni-20Cr alloy
- Engineering topological state transfer in four-period Su-Schrieffer-Heeger chain
- Spontaneous emission of a moving atom in a waveguide of rectangular cross section