Molecular dynamics study of interactions between edge dislocation and irradiation-induced defects in Fe-10Ni-20Cr alloy
2023-03-13TaoWenXiong熊涛文XiaoPingChen陈小平YePingLin林也平XinFuHe贺新福WenYang杨文WangYuHu胡望宇FeiGao高飞andHuiQiuDeng邓辉球
Tao-Wen Xiong(熊涛文) Xiao-Ping Chen(陈小平) Ye-Ping Lin(林也平) Xin-Fu He(贺新福)Wen Yang(杨文) Wang-Yu Hu(胡望宇) Fei Gao(高飞) and Hui-Qiu Deng(邓辉球)
1College of Materials Science and Engineering,Hunan University,Changsha 410082,China
2School of Physics and Electronics,Hunan University,Changsha 410082,China
3China Institute of Atomic Energy,Beijing 102413,China
4Department of Nuclear Engineering and Radiological Sciences,University of Michigan,Ann Arbor MI 48109,USA
Keywords: molecular dynamics simulation,edge dislocation,irradiation-induced defects,austenitic stainless steel
1.Introduction
Owing to the advantages of corrosion resistance, hightemperature oxidation resistance, and excellent mechanical properties,[1]austenitic stainless steels (e.g., Fe-10Ni-20Cr alloys) are selected to be one kind of core structural materials in fission reactors.However, a large number of defects will be produced under continuous high-energy particle irradiation,such as Frank loops,stacking fault tetrahedrons(SFTs),and voids, bubbles.[2,3]Under irradiation, as is well known,Frank loops are common interstitial-type defects,while voids and SFTs are vacancy-type defects in face-centered cubic(FCC)crystals.[4]These irradiation-induced defects will continue to accumulate and grow, which seriously impede the movement of dislocations, thus increasing the yield stress of materials significantly.[5]Besides, the irradiation-induced defects near the dislocation slip surface disappear after interacting with dislocations, which results in the localization of the plastic deformation.[6,7]As a result, the subsequent dislocations slip quickly in this area, which affects the properties of materials.[8]In these ways, radiation hardening, embrittlement, and corrosion damage, which occur inside the material[9,10]will result in the degradation of performance and thus unsafety of the reactors.[2,11]Therefore, an in-depth understanding of the microscopic mechanism of the interaction between irradiation defects and dislocations is of great significance in further optimizing and designing fusion structure materials.
Under the extreme conditions of nuclear reaction,theexsituexperiments exhibit low spatiotemporal resolution,[12]so that the related structure evolution remains unclear.Computer simulations can be used to study the microstructure evolution and to reveal the primary damage mechanisms of structural materials under high-energy radiation,[13]which may provide a significant insight into the selection of materials and structural design to ensure the safe operation of the nuclear power plant.[14,15]
Many simulations have been carried to explore the interaction between dislocations and these irradiation-induced defects, especially voids and Frank loops, in pure metals or alloys.[16-22]As for voids,the effects of stacking fault energy(SFE),void size,and temperature on their reaction with dislocations were studied in Cu,and the jog was found to form after their reaction.[16]It was also found that voids can transfer to SFTs in Fe-10Ni-20Cr alloys after interacting with dislocations at 900 K,which leads to a sharp increase in the value of critical resolved shear stress (CRSS).[17]As for Frank loops,after reacting with dislocations, it was shown that the original unpinning effects occur in Cu,[18]as well as the “superjogs” form after interacting with edge dislocations.Besides,“helical turns”happened on Frank loops after interacting with screw dislocations in Fe-10Ni-20Cr alloys, which may be a prerequisite for the formation of defect-free channels.[19-21]However, these studies almost focused on the specific reaction of dislocations with an individual defect type, and less research considered them comprehensively.Further, the researches about the reaction of SFT with dislocation are rare,and most of them only focus on pure metal systems,e.g.,Cu,Au, and Ni.[4,22-26]Although the interaction between screw dislocations and SFTs was investigated in Fe-10Ni-20Cr alloys and Ni,[4]the interaction of edge dislocations with SFTs has been ignored,which is also important.
In this work, we use the molecular dynamics (MD)method to systematically explore the interaction of edge dislocations with the three typical irradiation-induced defects(SFTs, voids, and Frank loop) with the sizes of 3 nm, 5 nm,and 7 nm at different temperatures(300 K,600 K,and 900 K)in Fe-10Ni-20Cr alloy.The CRSSs are compared among different defect types after interacting with edge dislocations.The results show that the CRSSs in all three defect types decrease with temperature increasing and defect size decreasing,except for the case of 3-nm Frank loops at 900 K.The increase of CRSS with temperature rising accords well with that of earlier studies.[17-20]According to a comparison, the CRSS in Frank loops is the highest among all defects, indicating that the Frank loops exhibit the strongest impeding effects on the movement of dislocations.The relationship between size,temperature,and CRSS for all defect types is also discussed.The atomic evolution of irradiation-induced defects after interacting with dislocations can provide a novel insight into the design of new structural materials.
2.Simulation method
In the present work, the large-scale atomic/molecular massively parallel simulator(LAMMPS)[27]was used to perform MD simulations.The potentials selected in the current study were the embedded-atom method(EAM)potentials developed by Bonnyet al.[15]The Fe-Ni-Cr interatomic potentials can well reproduce the atomic-level phenomena(e.g.,stable formation of irradiation-induced defects and stable dislocation slip) and a number of properties (e.g., SFE, elastic constants) in the alloys.For Fe, the target values come from DFT calculations which considered the effect of noncollinear magnetism and the stability of a ferromagnetic state.The Fe-10Ni-20Cr simulation cell was constructed by first creating a well-defined face-centered cubic (FCC) crystal which contained pure Fe elements,and then randomly replacing 10%of the Fe elements with Ni elements and 20%with Cr elements,respectively.This procedure was completed by the codes developed by our group.The box is shown in Fig.1, which is oriented alongX[-1-1-1],Y[-110],andZ[11-2].The periodic boundary conditions were applied to theYandZdirections,while no periodic boundary conditions were added to theXdirection.The method of constructing the edge dislocation model was based on the research by Osetsky and Bacon.[28]First,we introduced the edge dislocation along theZaxis with a Burger vector ofa/2[-110]along theYaxis after relaxation by the conjugate gradient method.Then, it was decomposed into two Shockley dislocations with a spacing of 10 nm in between on the (-1-1-1) plane.Subsequently, the three typical irradiation-induced defects with the sizes of 3 nm, 5 nm, and 7 nm were introduced into the box,respectively,each with approximately 13 nm being away from the center of the edge dislocation to avoid unnecessary effects between them before their interaction.The void was generated by deleting the atoms in the sphere at a specific position,and the Frank loop was obtained by adding a circular atomic layer on the(-1-1-1)plane.The SFT was created by deleting an equilateral triangle vacancy layer atom on the{111}plane with a static relaxation through the LAMMPS code.[4,29]During the simulation, the NPT ensemble was used to ensure that the pressure in the pressure reaction vessel does not change after increasing the temperature of the reaction system.After the system was heated to target temperatures (300 K, 600 K, and 900 K), it was relaxed for 30 ps, the time step for the whole MD simulation is chosen to be 2 fs.Then the edge dislocation moved towards each defect along theYaxis under the action of constant strain(3×10⁷s-1)driving force.The size of each simulation box was 86.6a0×141.4a0×112.7a0(containing 5.51 million atoms), wherea0is the lattice constant.We also used three different configurations with a random mixture of elements for each cell to explore the effect of initial element distribution on the reaction.
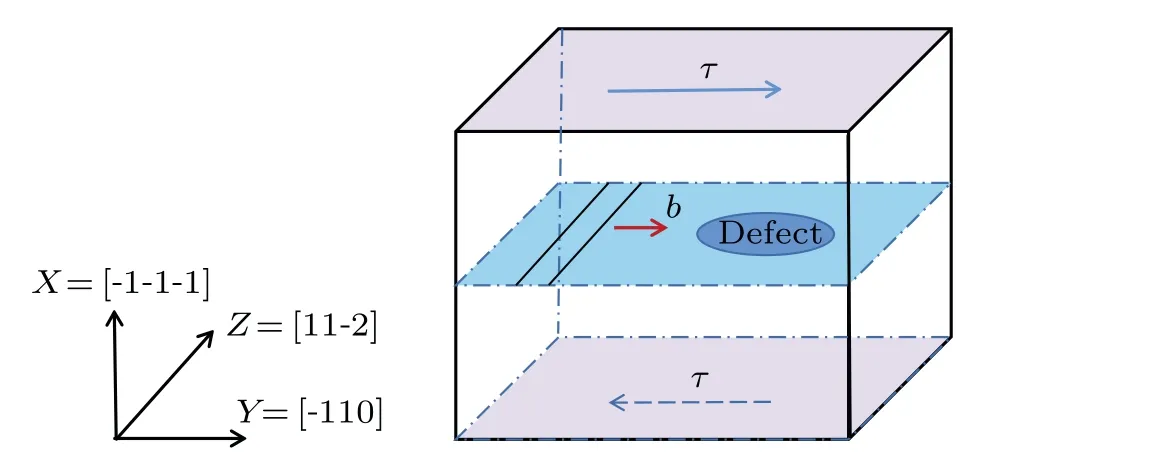
Fig.1.Schematic diagram of simulation box.
For the defect analysis and visualization of simulation results, the open-source application OVITO[30]was used.We used common neighbor analysis (CNA) and dislocation extraction algorithm(DXA)to identify stacking fault structures and dislocations.
3.Results and discussion
3.1.Interactions of dislocations with voids
The reactions of edge dislocations with voids of different sizes (3 nm, 5 nm, and 7 nm) at different temperatures(300 K, 600 K, and 900 K) are simulated.After the relaxation of the simulation system, the edge dislocation dissociates into two Shockley partial dislocations with stacking faults between them.The edge dislocation slides along the(-1-1-1)slip plane with the constant strain driven,passing through the middle plane of the void.First, we show the case at 900 K.Figures 2 and 3 illustrate the interaction morphology and the stress-strain behaviors of edge dislocations with voids of different sizes at 900 K,respectively.
As the edge dislocation approaches to the voids with different sizes, the leading partial dislocation begins to bend slightly (see Figs.2(a), 2(d), and 2(g)), showing the attraction between the leading partial dislocation and the void (see Figs.2(a), 2(d), and 2(g)).As the shear stress increases, the leading partial dislocation first detaches from the void (see Figs.2(b),2(e),and 2(h)).At the same time,the distance between two partials decreases, resulting in an increase in the repulsive force between them.The trailing partial dislocation pushes the leading partial and helps the leading partial dislocation to detach.After detaching,the leading partial dislocation can move readily,owing to no defects resisting its motion(see Figs.2(c),2(f),and 2(i)).During the detachment of the trailing partial dislocation, the distance between both partial dislocations increases and the repulsive force between them becomes weak.The trailing partial dislocation behaves as an isolated dislocation and its motion is hardly affected by the leading partial dislocation.There is a time lag between the detachments of the two partial dislocations.There are two peaks occurring in the process for all systems,corresponding to the detachment of the two partial dislocations.It should be noted that the second peak(detachment of trailing partial dislocation)is higher than the first one(detachment of leading partial dislocation)in all systems,reaching to a maximum value(defined as CRSS).Besides, the value and width of peak increase with void size increasing, indicating that the higher stress and longer interaction time occur when the dislocation interacts with a larger void.For example, the interaction of dislocation with the 3-nm void cannot keep so long.The leading partial dislocation starts to contact the void at 110 ps,and it detaches away from the void immediately at 236 ps while the trailing partial dislocation does not start to contact the void (see Fig.2(b)).As for the 5-nm void, the leading partial dislocation starts to interact the void at 119 ps and remains pinned until 265 ps when the trailing partial dislocation is also pinned by the void (see Fig.2(e)).For a 7-nm void, the leading partial dislocation takes longer time to detach(see Fig.2(h)).As for the void with larger size ((see Figs.2(e) and 2(h))), the leading partial dislocation and trailing partial dislocation are both pinned by the void at the same time,forming a constriction,which is in good agreement with previous result.[17]However, there is no intersection between leading partial dislocation and trailing partial dislocation,therefore,no complete dislocation forms after their interactions with the void, which is different from that in Cu.[17]At the lower temperatures, the mechanisms of the void reacting with dislocation are almost the same.It should be noted that the structure of the void after interacting with edge dislocation remains the same as that before interaction for each of all sizes and temperatures.

Fig.2.Visualizations of dislocation reaction of edge dislocation with void(3 nm,5 nm,and 7 nm)in Fe-10Ni-20Cr alloy at temperature T =900 K,showing state before reaction: (a)80 ps,(d)87 ps,and(g)95 ps; constriction formation: (e)265 ps and(h)281 ps;trailing partial breaks away from void: (c)360 ps,(f)385 ps,and(i)447 ps.
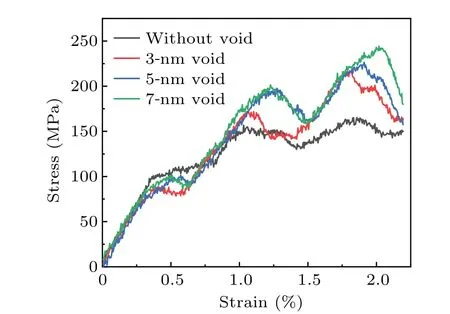
Fig.3.Stress-strain curve for interaction morphology in Fig.2,with color line representing the interaction between an edge dislocation and voids,and the black line denoting the situation without any void.
3.2.Interactions of dislocations with Frank loops
The reactions of edge dislocations with Frank loops of different sizes (3 nm, 5 nm, and 7 nm) are also simulated at the temperatures of 300 K,600 K,and 900 K.The edge dislocation slides along the(-1-1-1)slip plane,with constant strain driven, passing through the middle plane of the Frank loop which is similar in shape to a regular hexagon.As is well known, the dislocation needs to overcome the lattice friction resistance to slip in the matrix,which can be different for different natures of matrixes.Here, we consider three random models to observe the effect of the matrix on such a process.Figures 4 and 5 show the interaction morphology of the edge dislocations with 3-nm Frank loops in 3 matrixes with different element distribution at 900 K, and their stress histories,respectively.

Fig.4.Visualizations of dislocation reaction of edge dislocations with 3-nm Frank loops in Fe-10Ni-20Cr alloy at temperature T =900 K,showing comparisons among different models for states before reaction at(a)143 ps,(d) 146 ps, and (g) 156 ps; for leading partial dislocation breaking away from the Frank loop at (b) 298 ps, (e) 309 ps, and (h) 267 ps; for trailing partial dislocation breaking away from Frank loop at(c)466 ps,(f)318 ps,and(i)410 ps.
Like the voids,the partial dislocations begin to move and physically intersect with the loop after applying a shear stress to it(Figs.4(a),4(d),and 4(g)).It is observed that the attraction of the leading partial dislocation with the loop is weaker than that of the void (see Fig.2), as the edge dislocation approaches to the Frank loop.Under the action of shear stress,the leading and trailing partial dislocations successively intersect the Frank loop (see Figs.4(b), 4(e), and 4(h)).As the shear stress increases,the two partial dislocations detach from the loop, respectively, corresponding to the two stress peaks in model 1 and model 3 (Fig.5).However, the peak is not distinct in model 2,indicating different mechanisms for these matrixes.As for model 1, when the trailing partial is detaching from the Frank loop,the faulted loop remains unchanged,which is similar to that of the void.As a result, the stress reaches the first peak at this time (Fig.5).Afterward, it is found that the faulted loop transforms into a perfect dislocation loop with a Burgers vector of 1/2〈0¯11〉during the detachment of the trailing partial dislocation (Fig.4(c)), corresponding to the second peak in Fig.5.Such a transformation is generally called unfaulting mechanism,which has also been observed in previous studies.[20,21]The blue dislocation line in Fig.4(c)represents 1/2〈110〉(perfect), the green line represents 1/6〈112〉(Shockley), and the yellow line represents 1/3〈001〉(Hirth),which are analyzed by DXA.As for model 2, the transformation of a Frank loop into a perfect loop just occurs when the leading partial dislocation detaches from the loop(Fig.4(e)),which took place before the scenario in model 1.At this time, the stress reaches to a maximum value, indicating the lattice resistance for dislocation motion increases significantly.Subsequently, the perfect loop is unstable and becomes broken during the detachment of the trailing dislocation, resulting in the formation of a dislocation core (see Fig.4(f)).It is observed that two junctions between the leading dislocation and trailing partial dislocation are connected with either end of this dislocation core.Such a configuration is also called a “superjog”, and the generation of the superjog is due to the unfaulting mechanism, which has been observed in many other previous studies.[20,21]However, the stress does not decrease afterward,resulting in indistinct stress peak,which indicates that the formation of superjog delays the detachment of dislocation significantly.Generally, the generation of a unit jog in a dislocation will produce a dislocation segment with a line direction component normal to the previous glide plane of the dislocation,thus suppressing the dislocation motion.While the normal component of a unit jog only extends over a single inter-planar spacing,the extent of a superjog is over more than one inter-planar spacing.[31]Thus,the generation of a superjog can delay the dislocation motion more significantly than that of a unit jog.As for model 3,when the leading partial dislocation detaches from the Frank loop,there are several new stacking-faults forming on one side of the Frank loop, resulting in a stacking-fault complex (see Fig.4(h)).But such a stacking-fault complex is unstable and reforms as a faulted loop again during the further detachment of the trailing partial (see Fig.4(i)).The stress peak during this reaction is much lower than that of model 1,which is due to the absence of unfaulting.Therefore,the occurrence of unfaulting and formation of superjog both can delay the detachment of edge dislocation from the Frank loop.However,such phenomena are not observed at lower temperatures(300 K and 600 K)for the Frank loops with the same size.For the Frank loops of larger sizes (5 nm and 7 nm), we only observe the formation of stacking-fault complex during the detachment of partial dislocation but without unfaulting and superjog for different matrixes and temperatures (Figs.6(c) and 6(f)).The result indicates that the unfaulting and superjog occur conditionally, of which the probability decreases as temperature declines and loop size increases.
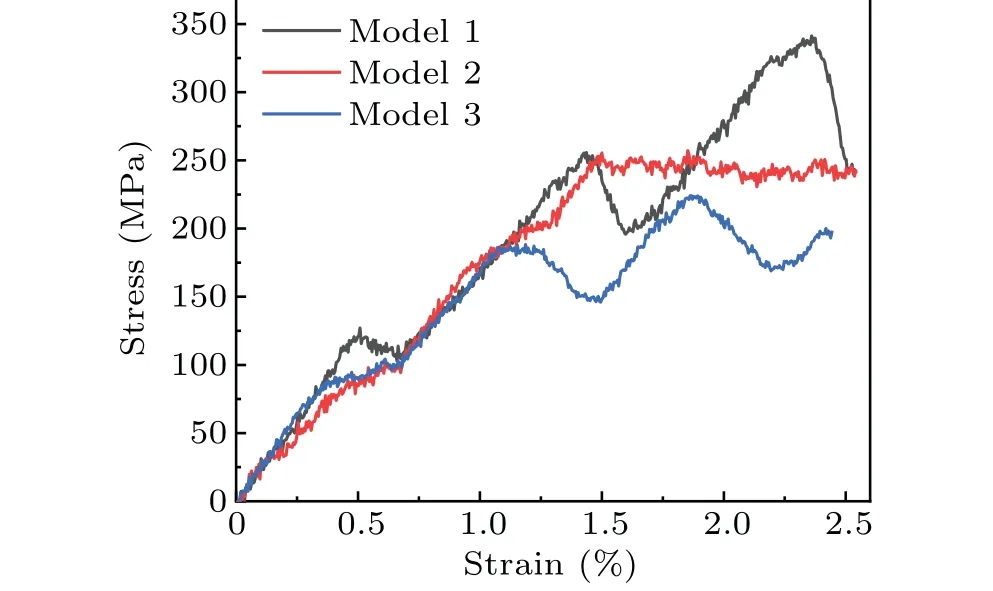
Fig.5.Stress-strain curves for interaction morphology in Fig.4.

Fig.6.Visualizations of dislocation reaction of edge dislocations (5 and 7 nm) with Frank loops in Fe-10Ni-20Cr alloy at temperature T =900 K,showing state before reaction at (a) 113 ps and (d) 84 ps; leading partial breaking away from Frank loop at(b)264 ps and(e)290 ps; trailing partial dislocation breaking away from Frank loop at(c)384 ps and(f)462 ps.
3.3.Interactions of dislocations with stacking fault tetrahedrons
Now, we come to consider the reactions of the edge dislocations with SFTs of different sizes(3 nm,5 nm,and 7 nm)respectively at temperature of 300 K,600 K,and 900 K.Figures 7 and 8 show the corresponding interaction morphologies at 900 K and their stress histories,respectively.Like the voids and Frank loops, the partial dislocations begin to move and physically intersect with the SFT after applying a shear stress to them.As the edge dislocation approaches to the SFT, the attraction of leading partial dislocations with the SFT is unapparent (Figs.7(a), 7(d), and 7(g)) until contacting with each other (see Figs.7(b), 7(e), and 7(h)).As the shear stress increases, the two partial dislocations detach from the SFT, respectively, corresponding to the stress peaks (Fig.8).However, the peak values are different from each other, indicating different mechanisms for SFTs with different sizes.As for the 3-nm and 7-nm SFTs, there occur two stress peaks,corresponding to the detachment of two partial dislocations,respectively,which is similar to that occurring during the dislocations interacting with loops or voids.However, the cases of 5-nm SFT are quite different,in which there is only a large and wide stress peak during the interaction.In order to understand the underlying mechanism for SFTs with larger sizes,we compare the differences in interaction morphologies (Fig.9)and stress histories(Fig.10)in different models for 5-nm SFT case.

Fig.7.Visualizations of dislocation reaction of edge dislocations (3 nm,5 nm, and 7 nm) with SFTs in Fe-10Ni-20Cr alloy at temperature T =900 K,showing state before reaction,at(a)85 ps,(d)94 ps,and(g)98 ps;SFT located in the middle of stacking fault at(b)176 ps,(e)229 ps,and(h)255 ps;trailing partial dislocation breaking away from SFT at(c)213 ps,(f)270 ps,and(i)305 ps.
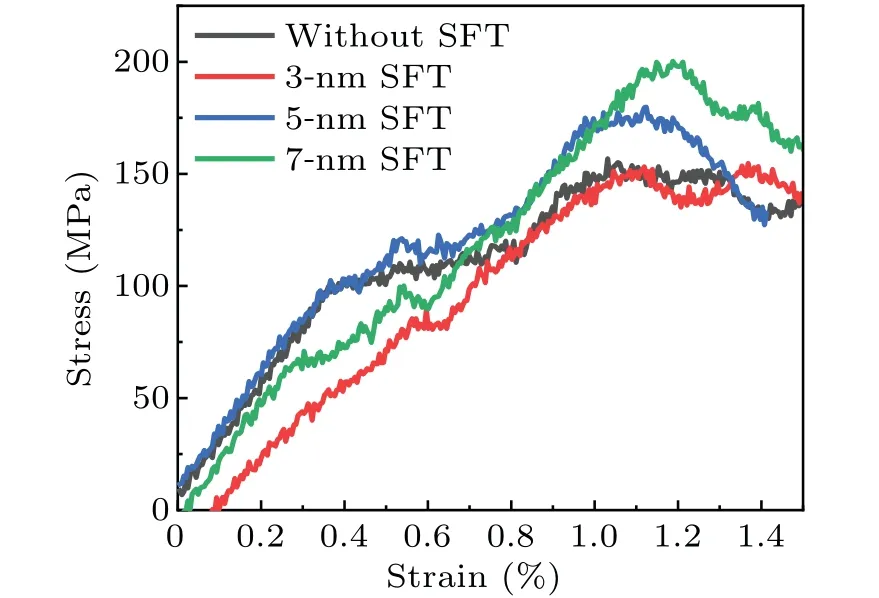
Fig.8.Stress-strain curves for interaction morphology in Fig.7.The color line represents the interaction between an edge dislocation and SFTs, and the black line represents the situation without an SFT.
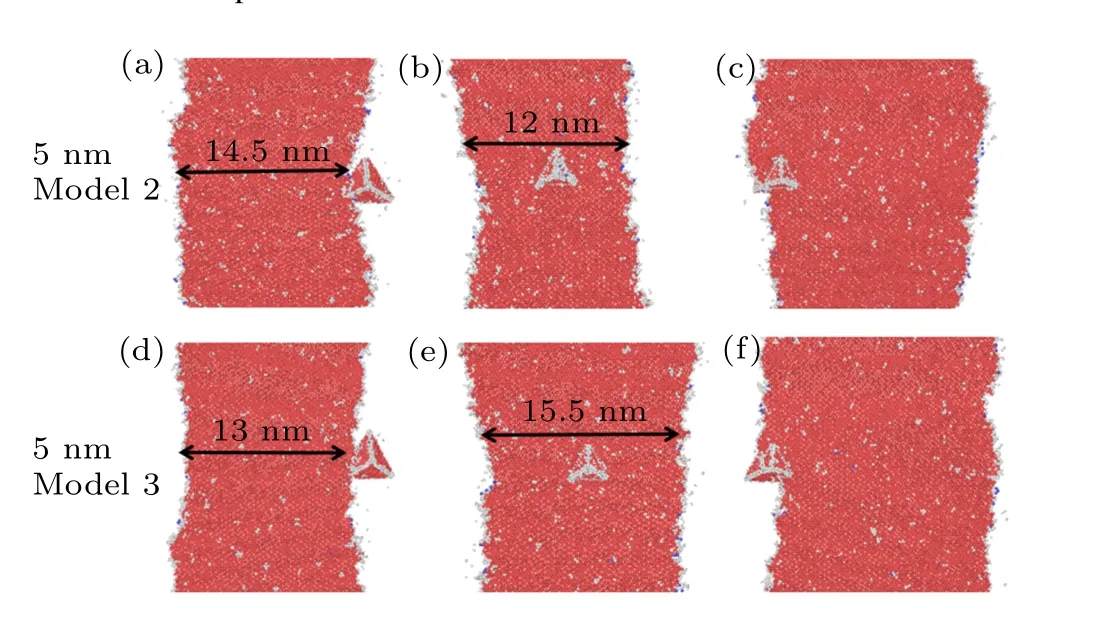
Fig.9.Visualizations of dislocation reaction of edge dislocations with 5-nm SFTs in Fe-10Ni-20Cr alloy at temperature T =900 K,showing state before reaction at (a) 135 ps and (d) 130 ps; SFT located in the middle of stacking fault, at (b) 200 ps and (e) 222 ps; trailing partial breaking away from SFT,at(c)238 ps and(f)276 ps.
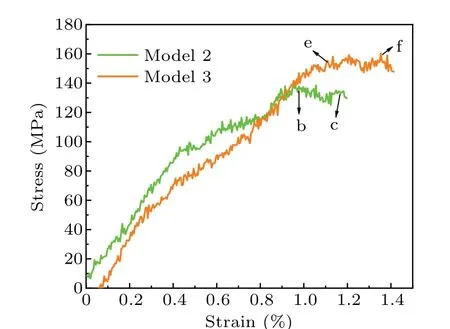
Fig.10.Stress-strain curves for interaction morphologyin Fig.9,with color lines representing the interaction between an edge dislocation and voids in model 2(green)and model 3(red).
Like the case of a 5-nm SFT(model 1)in Fig.7,the partial dislocations in Fig.9 begin to move and physically intersect with other two 5-nm SFTs(model 2 and model 3)under the action of shear stress.As the edge dislocation approaches to the SFT, the attraction of leading partial dislocation with the SFT is apparent when they contact each other (Figs.9(a)and 9(d)).As the shear stress increases, the two partial dislocations detach from the SFT,respectively,corresponding to the stress peaks(Fig.10).It should be noted that the detachment of two partial dislocation in model 1(Figs.7(d),7(e),and 7(f))and model 3(Figs.9(d),9(e),and 9(f))are much longer than that in model 2 (Figs.9(a), 9(b), and 9(c)), corresponding to the much larger stress in model 1 (Fig.8) and model 3 (Fig.10).The numbers of stress peaks in different models are also different from those in model 2.For example, there are two stress peaks in model 2(Fig.10),corresponding to the detachment of two partial dislocations, respectively, which is similar to that occurring during the interaction with loops or voids.However, the cases in model 1 and model 3 are quite different from those in model 2.There is only a large and wide stress peak in model 1(Fig.8),and the same is true in model 3 (Fig.10).Besides, it should be noted that the distance between partial dislocations increases during the interaction for these two models(e.g.,24 nm for model 1,15.5 nm for model 3,much larger than that before reaction(~13 nm)),while the distance in model 2 decreases.The decrease in distances is also observed during the interaction for loops or voids (see Figs.2, 4, and 6).By comparison, the increased distance between partials in model 1(Figs.7(d)and 7(e))is much larger than that in model 3(Figs.9(d)and 9(e)),corresponding to the much higher stress peak.The results indicate that the increase in distance between two partial dislocations can lead to an increase in stress.Such phenomena were also observed in other studies about SFTs,[4]suggesting that the mechanism for SFT interaction is different from that for other defect.
3.4.Comparison of interactions between dislocations and defects
To understand the differences among different defects after interacting with dislocations for different sizes and temperatures, we further compare their CRSS values by averaging all three models for each case, and the reseults are shown in Fig.11.As for the same defects,the CRSS increases with defect size increasing and temperature decreasing,except for the case of 3-nm Frank loops at 900 K.In general, the increase of stress with larger defect size is due to the increased interaction areas between dislocation and defects, resulting in the stronger delay of dislocation motion.The increase of stress with the lower temperature is due to the less mobility of dislocations in the matrix at the lower temperature.The 3-nm Frank loops exhibit a higher CRSS during the interaction than the Frank loop with larger sizes at 900 K,which is due to the occurrence of unfaulting and formation of superjog,resulting in the delay of dislocation motion.
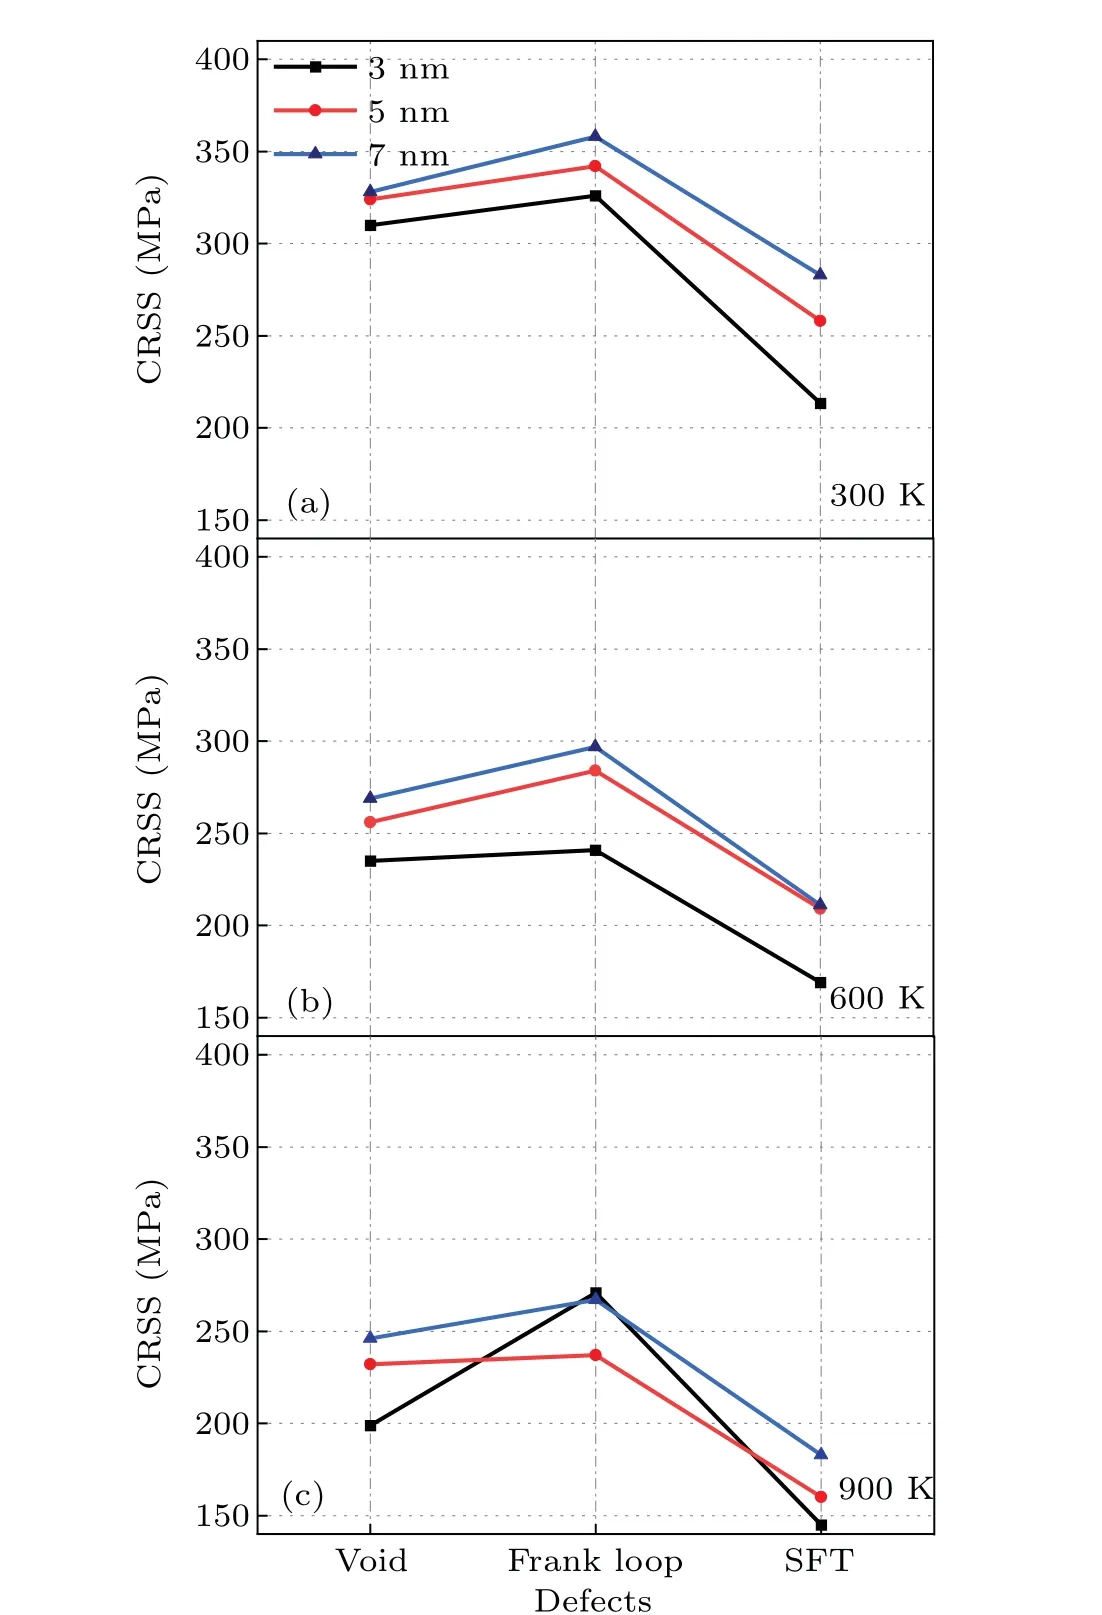
Fig.11.Comparison of CRSS obtained for different defects after interacting with an edge dislocation for different sizes and temperatures.The reaction temperature of irradiation defect and edge dislocation is 300 K-900 K,and the size of the defect is 3 nm-7 nm.
As for the CRSS with different defects, it is shown that the sequence for CRSS of defects, from weak to strong, is SFT, void and Frank loop, and the same is true for all temperatures and sizes (Figs.11(a)-11(c)).The results indicate that the Frank loop exhibits the strongest inhibition effects on dislocation motion as compared with other defects(voids and SFTs) for all temperatures and sizes, although the unfaulting and superjog occur conditionally and the corresponding occurrence probability decreases with temperature decreasing and loop size increasing.This should be due to the stacking-faults between the partial dislocation fully overlap with the plane of the Frank loop,resulting in the most effective interaction area as compared with other defects(voids and SFTs)and thus significantly inhibiting the dislocation motion.Besides,the lower CRSS in SFT than that in void might be due to the less effective interaction area for SFT than that for void during the interaction with dislocation.For example,when a dislocation slips through the middle plane of a void(e.g.,the diameter isN), the effective interaction area is a circle (the diameter isN).As for an SFT (e.g., the side length isN), the effective interaction area is a triangle area (the side length isN).It is correct that the area of a circle with the diameter ofNis larger than a triangle area with the side length ofN,resulting in the enhanced inhibition effect of void on dislocation motion than that of SFT.
4.Conclusions
In this work, we have simulated the interaction between edge dislocations and three common types of irradiation defects(Void,Frank loop,SFT)by using the MD methods.The sizes of the defects studied are 3 nm, 5 nm, and 7 nm, respectively, and the simulated temperature ranges from 300 K to 900 K.The results show that the CRSSs in all three defect types decrease with temperature increasing and defect size decreasing, except for the case of 3-nm Frank loops at 900 K.In general,the increase of stress with larger defect size is due to the increased interaction areas between dislocation and defect,resulting in the stronger delay of dislocation motion.The increase of stress with temperature lowering is due to the less mobility of dislocations in the matrix at the lower temperatures.However, the 3-nm Frank loops larger size exhibits a higher CRSS during the interaction than the Frank loops at 900 K,which is due to the occurrence of unfaulting and formation of superjog, resulting in the delay of dislocation motion.By comparison,the CRSS in Frank loops is the highest in all defects, indicating that the Frank loop exhibits the strongest inhibition effects on dislocation motion.This should be due to the most effective interaction area between Frank loops and dislocations during the interaction.The lower CRSS in SFT than that in void might be due to the less effective interaction area for SFT than that for void during the interaction with dislocation.The atomic evolution of irradiation-induced defects after interacting with dislocations can provide a novel insight into the design of new structural materials.
Acknowledgements
Project supported by the National MCF Energy Research and Development Program, China (Grant No.2018YFE0308101) and the China National Nuclear Corporation Centralized Research and Development Project(Grant No.FY18000120).
杂志排行

Chinese Physics B的其它文章
- Matrix integrable fifth-order mKdV equations and their soliton solutions
- Comparison of differential evolution,particle swarm optimization,quantum-behaved particle swarm optimization,and quantum evolutionary algorithm for preparation of quantum states
- Explicit K-symplectic methods for nonseparable non-canonical Hamiltonian systems
- Engineering topological state transfer in four-period Su-Schrieffer-Heeger chain
- Spontaneous emission of a moving atom in a waveguide of rectangular cross section
- Novel traveling quantum anonymous voting scheme via GHZ states