Power Battery Thermal Fault Warning of Electric Vehicles Based on Sparse Data*
2022-11-21ZhangHuaqinHongJichaoChenDelong
Zhang Huaqin ,Hong Jichao ,Chen Delong
(1.School of Mechanical Engineering,University of Science and Technology Beijing,Beijing 100083;2.Shunde Innovation School,University of Science and Technology Beijing,Foshan 528000;3.School of Systems Engineering,National University of Defense Technology,Changsha 410073)
【Abstract】To address the problem that is difficult for sparse temperature data to perform accurate early warning of thermal failure and thermal runaway for electric vehicle battery systems,a lithium battery thermal fault warning model based on long and short-term memory network and transfer learning is proposed.The model is trained using dense data in the source domain and transferred to the target domain using sparse data.During training phase in the source domain,the moving standard deviation is applied to pre-extract the temperature-related features from the input data.During training phase in the target domain,the loss function transfer model for the scaling exponent errors is proposed to make the fault warning model automatically tend to extract coarse feature information,and improve the accuracy of temperature prediction.The experimental results show that the neural network model with transfer learning can accurately predict the battery temperature and its trends to change,which are important for power battery thermal fault warning and thermal runaway prevention and control.
Key words: Electric vehicles,Thermal fault warning,Sparse data,Transfer learning,Moving Standard Deviation(MSD)
1 Introduction
With the pursuit of a high range for Electric Vehicles(EVs),the energy density of power batteries is increased.The explosion of power batteries has become a significant issue influencing EVs safety.The thermal fault prognosis is an effective means of early detection of power battery explosion risk[1-3].The big data platform is able to analyze the temperature data with a bigger calculation,detect the abnormal temperature changes,and start the warning of thermal faults earlier.However,due to the limitation of data transmission and storage costs,currently,most of the EVs data received by the big data platform are sparse data with low collection frequency and poor accuracy.Such sparse data can hardly reflect battery temperature changes in time and is not conducive to the early detection of abnormal temperature[4-5].In thermal fault prognosis,it is difficult to utilize the computation resources of the big data platform.Therefore,it is critical to perform a timelier and more accurate EV power battery thermal fault prognosis with sparse data.
1.1 Literature Review
With the popularity of EVs in recent years,the safety of EVs has drawn a lot of attention from the society.The safety of EVs is mainly due to the high energy density[6]of power batteries,which can easily cause serious damages in case of accidents,such as explosion and combustion.Therefore,it is of great significance to improve the safety of EVs power batteries.
In recent years,researchers have conducted many studies on power battery safety[7].The failures of power batteries include low battery capacity,excessive internal resistance,overcharge,over-discharge,overcurrent,overheat,internal short circuit,external short circuit,and internal open circuit.Small performance differences could appear between each cell in a battery pack in the process of manufacture and during vehicle operation,the environmental effects(e.g.,temperature)amplify the performance differences between cells,which are reflected as low capacity and high internal resistance[8].The active material at the electrode tabs,terminals,external connections,or welds of lithium-ion batteries may break or fall off under strong vibration,which may result in internal short circuits or external short circuits.The development of communication technology has led to recognize the potential of information utilization.In order to take more use of information resources,many industries have established specialized big data platforms which provide the possibility to apply vehicle-side data in real-time in recent years.The researches concerning safety services for EVs in real-time had also been conducted[9-10].
The big data platform itself also has problems need to be solved.Due to the limitations of information transmission methods and storage costs,most of the data collected and saved by the big data platform are not acquired with sufficient frequency and accuracy.This situation brings difficulties to data utilization and The effect of many methods used on low-frequency data will be greatly affected so as to fail to be applied in target vehicles.Some researches also study how to utilize sparse data for EVs.Lenz et al.[11]proposed an interpolation method to generate feature maps of battery cell parameters by sparse input data.To increase data amount,Lakshminarayanan et al.[12]used adversarial generative networks to generate high-fidelity synthetic battery parameter data.
With the development of computer technology,computing power is constantly increasing.Neural networks use computational resources to accomplish variety tasks,which have gradually received wide attention from researchers.Some classical neural network structures such as Convolutional Neural Nnetwork(CNN)[13],recurrent neural network[14],Long Short-Term Memory(LSTM)[15],and gated recurrent unit[16],have been applied to researches related to EVs safety.
Transfer learning[17-18]refers to acquiring knowledge in the source domain and applying it to the target domain.In general,transfer learning trains the neural network model in the source domain at first.Then some layers are frozen in the target domain[19].In this way,the sample amount in the target domain could be supplemented.However,the common transfer learning still requires the labeled samples for supervised learning in target domain.
To transfer the trained neural network model to the unlabeled target domain,Ganin et al.[20]proposed Domain-Adaptive Neural Network(DANN),which is frequently used in classification tasks.However,some researchers also upgraded DANN to regression tasks.Fang et al.[21]used DANN to solve the label-free regression problem.However,such neural network structures require multistep adversarial training with high training costs,which is difficult for vehicles to train and deploy on a big data platform.
1.2 Challenges for Thermal Faults Prognosis with Sparse Data on EVs Big Data Platform
The current big data platform presents a low sample frequency and poor precision of sparse temperature data.As the temperature changes slowly and lightly,the sparse temperature data remains at a fixed value for minutes,making it difficult to respond.This is not conducive for the early detection of thermal faults in power batteries.One solution is to transfer the trained neural network model on the dense dataset to the sparse dataset.However,the transfer learning also requires supervised training,and the sparse datasets are lack of the required dense labels.This problem makes the classical transfer learning approach inapplicable.Another idea based on transfer learning is to use DANN to train neural network models in the absence of labels.DANN is easier to perform with clear domain boundaries,however,data prediction is a regression task with fuzzy domain boundaries.Unlabeled deep learning methods such as domain adaptation and adversarial Training both require extensive training and are difficult to train.This is not conducive to use in bulk on big data platforms.
It is worth noting that the problem studied in this paper is not the unlabeled case.Sparse temperature data still have the values as labels for training regression models.Therefore,the key to solve the problem of sparse data thermal fault prognosis on big data platforms is extracting features reasonably in the source domain and rationally transferring to the target domain.
1.3 Problem Statement
Sparse temperature data generally have a long plateau period.The temperature data in the contrary remains constant for a few minutes.It is difficult to reflect the rate of temperature change.The poor data quality makes it difficult to use data driven based state estimation and parameter prediction methods.
To solve these problems,the models trained on dense data are transferred to sparse data.Meanwhile,the Scaling Exponent Error(SEE)Loss functions are proposed to ensure the transfer learning effect and avoid coarse information from sparse data overwriting the extracted detail information.
2 Sparse Data Reconstruction and Pre-Processing
The EVs big data platform concerns more about the economy so that the sparse data is mainly received and stored rather than dense data.The sparse data cannot verify the effectiveness of the proposed method.Thereforethe sparse data needs to be reconstructed by dense experimental data.It is guaranteed that the sparse data used has corresponding dense data.Furthermore,finer data information must be obtained from the dense experimental data.To make the neural network model extract the data features better,data preprocessing is also performed in this section.
2.1 Dense Experimental Data
The dense experimental data used in this paper is the lithium-ion battery drive data collected by Dr.Phillip Kollmeyer[22]from the University of Wisconsin-Madison.A brand-new 2.9 A·h Panasonic 18650PF cell is tested in an 0.226 m3thermal chamber with a 25 A,18 V Digatron Firing Circuits Universal Battery Tester Channel.Figure 1 shows the data collected in one drive cycle including voltage,current,power,battery temperature,capacities and the acquisition frequency is 10 Hz.
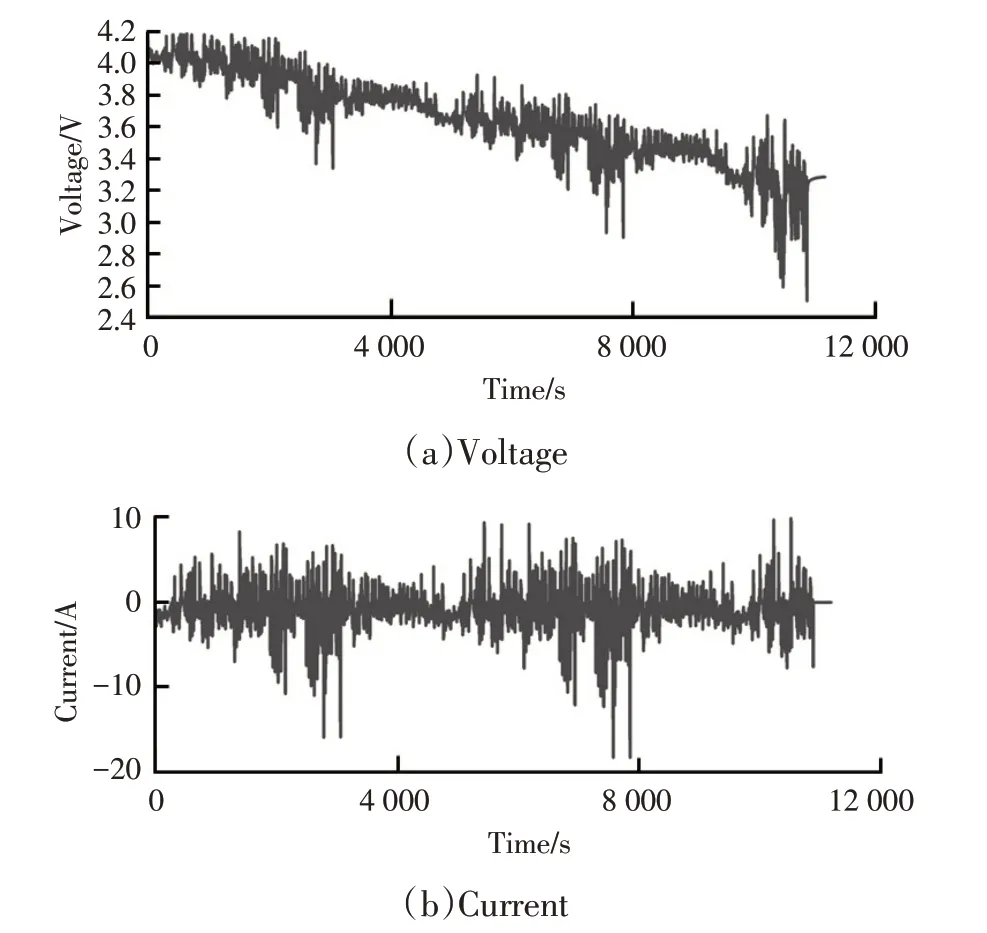
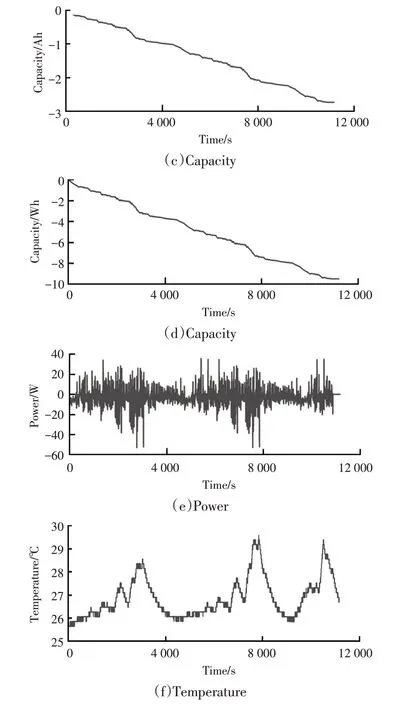
Figure 1.Dense experimental data in one drive cycle
2.2 Sparse Data Reconstruction
According to the data collection frequency and accuracy of the big data platform,the dense data is reconstructed into sparse data with a sampling frequency of 0.1 Hz,i.e.,collected once every 10 s,and the data accuracy is retained only to integer bits.Reconstructing sparse data and corresponding dense data shows in Figure 2.
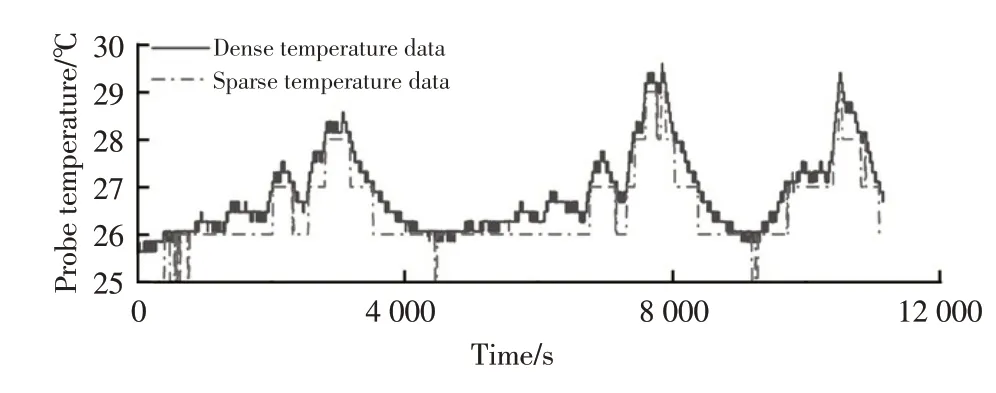
Figure 2.Reconstructing sparse data and corresponding dense data
It can be observed that sparse data generally has a long plateau period.The temperature data is located at the same value without change for minutes,and hardly reflects the rate of temperature change.It is difficult to reasonably analyze the rate of temperature rise if temperature data is only used,this is an important basis for predicting thermal runaway.To acquire temperature rate information in time and reduce the difficulty of extracting feature information during subsequent model training,the method in Section 2.3 preprocess the input data,and finally Section 3 presents the precision prognosis.
2.3 Data Pre-Processing
The neural network needs to extract feature information from the sparse input data to generate dense temperature data.The features lost from the sparse temperature data can be filled by other data items,which requires to be strongly correlated with the temperature data.Figure 3 shows the correlation matrix between the data items in Figure 1.
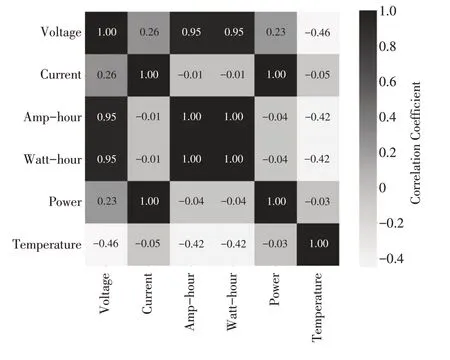
Figure 3.Correlation matrix
It can be seen that the correlation between other data items and temperature data is low,which increases the difficulty of feature extraction by the neural network model.Figure 1 shows that when temperature data has a peak,the voltage,current,and power are often accompanied by sharp fluctuations,however,the capacities significantly decrease.This phenomenon follows that the battery charging and discharging are accompanied by exotherm reaction[23].Therefore,the fluctuations of the input data items are extracted to replace the original data in the preprocessing stage,which is beneficial in reducing the difficulty of extraction.Moving Standard Deviation(MSD)is an analysis method to extract fluctuations in the sliding range of the data.A sliding window frames the data range,and the standard deviation data at the current position is obtained by Eq.(1)and(2).After the sliding window goes through the entire data sequence,a new data sequence consisting of standard deviation values is obtained.The MSD is shown as:
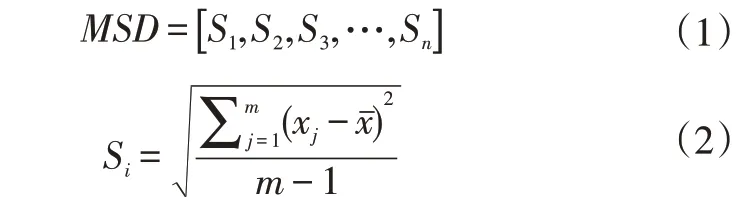
In which,MSDpresents the moving standard deviation sequence,npresents the length of the data sequence,Sipresents the standard deviation value of the data within thei-th window,mpresents the size of the sliding window,andxjpresents thej-th data value within the sliding window.
To enrich the information features of the model input and reduce the difficulty of feature extraction,5 data items of voltage,current,power,capacities are processed as components of model inputs by using MSD,as shown in Figure 4.
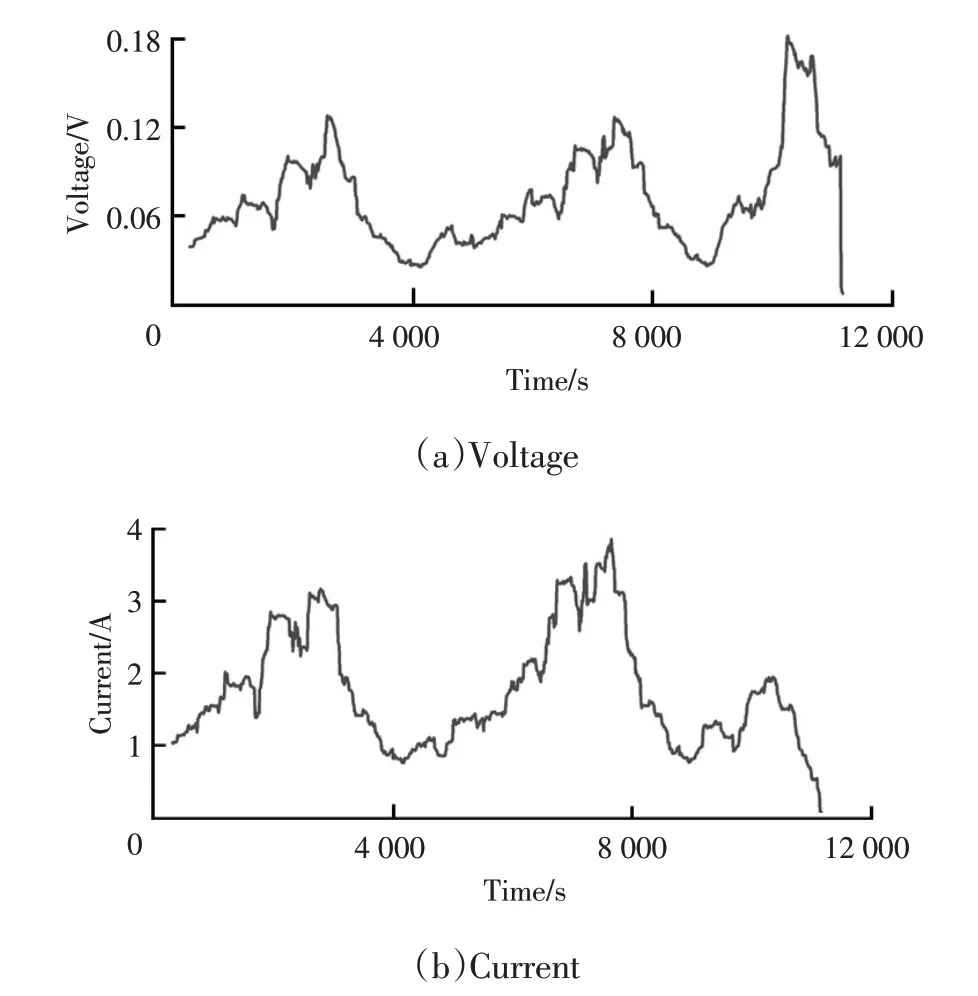
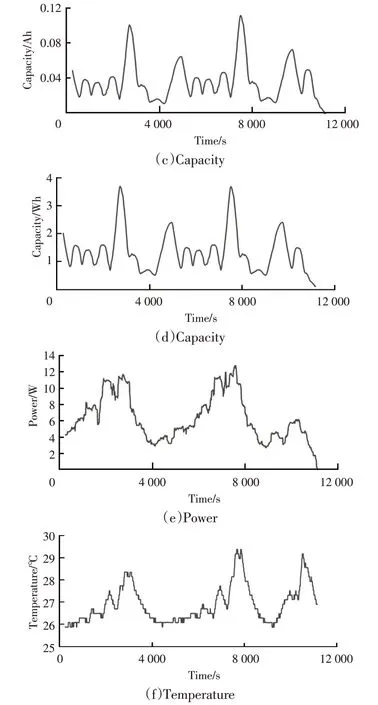
Figure 4.MSD output data
It can be seen that the moving standard deviation sequences of the other five data items are generally consistent with the fluctuations of the temperature data.And all the peaks of the temperature curves can correspond to the peaks in the other curves.This presents a high correlation between the other data items and the temperature data,which is easy for the neural network model to extract features.
In addition,to narrow the adjustment range of neural network parameters to facilitate neural network training,the data should be normalized before used.5 pre-processed data sequences and sampling frequency of 0.1 Hz for sparse temperature data are used as the input to the neural network model.The 10 Hz for dense temperature data are used as labels for the neural network model training.
2.4 The Sliding Window Sampling
To increase the amount and variety of training samples,the sliding window is applied to divide the data to obtain samples.The specific parameters of the sliding window are shown in Table 1.
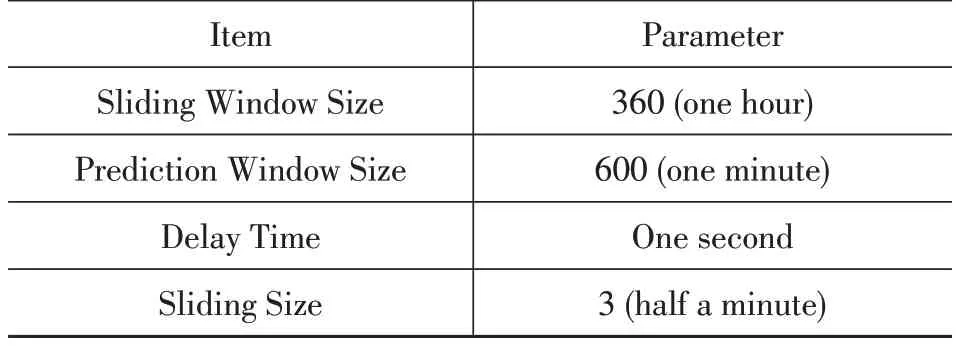
Table 1.Specific parameters of the sliding window
Use the sliding window to intercept 1 h of data(360 data points)on sparse data as the input sample.The prediction window intercepts 1 min data(600 data points)on the dense temperature data.In order to achieve temperature prognosis,the start time of the prediction window should be determined based on the input sample end time and the delay time.In order to reserve sufficient computation time for the actual fault prognosis,1 s is reserved as a delay time between the sliding window and the prediction window.The sliding size of the windows is a 30 s(3 data points).
3 Transfer Learning Method for Sparse Data
The main process of transfer learning method is shown in Figure 5.The first step is to train the neural network model on the source domain with dense labels so that it can generate dense temperature data with high accuracy.The second step is to transfer the trained model to the target domain without dense temperature data by a suitable loss function with sparse temperature data as labels.
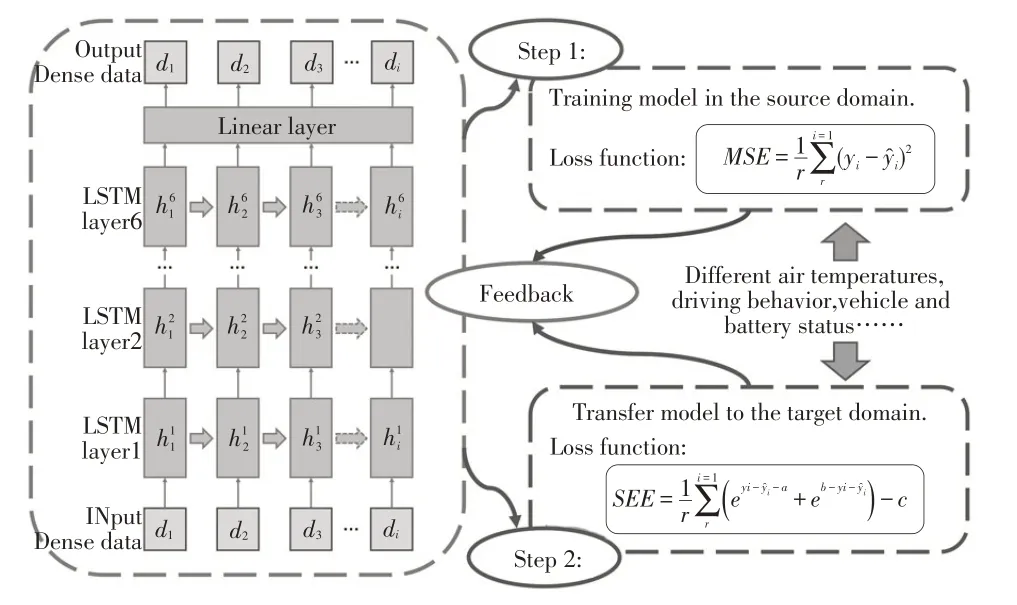
Figure 5.Transfer learning of neural network model
3.1 LSTM Neural Networks
The network schematic of a LSTM predictor is indicated in Figure 6,in which a cell block replaces the standard neural network layer.This block has several components called input gate i,forget gate f,and output gate o.The intermediate data is transformed by the logistic sigmoid function σ and the hyperbolic tangent function(i.e.tanh).The input gate controls the input activations to flow into the memory cell;the output gate controls the output of the cell activations to spill into the rest of the network;and the forget gate processes continuous input streams that are not segmented into subsequences[24].
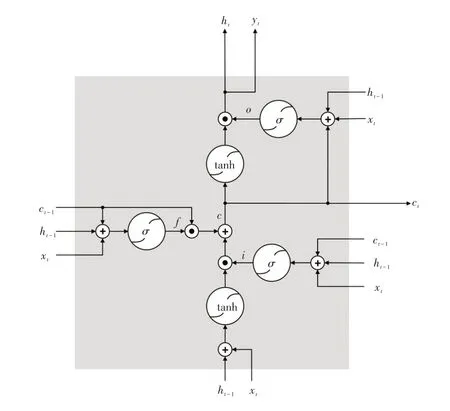
Figure 6.The network schematic of LSTM
The proposed LSTM network computes a mapping from an input sequencexto an output sequenceyby calculating the network activations using the following equations iteratively:
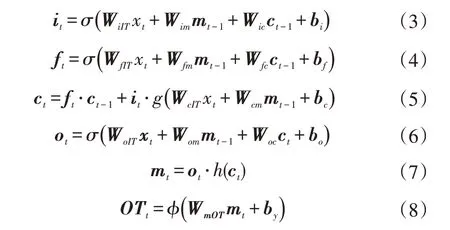
In which,the terms containingWdenote weight matrices;Wic,Wfc,andWocpresent diagonal weight matrices for peephole connections;the terms containingbdenote bias vectors;the cell activation vectors be represented byc.All vectors have the same size as the output activation vector m.The symbolOTpresents the output of the LSTM layer;gandhpresent the cell input and cell output activation functions,andφpresents the network output activation function.
3.2 Loss Functions of Transfer Learning
In source domain training,Mean Square Error(MSE)[25]is chosen as the loss function.The MSE loss function has 2 advantages.One is that at the beginning of training with large errors,MSEreturns larger loss values to accelerate the model parameter adjustment and make the model converge quickly.The other is that after the model gradually converges,the parameters need to be adjusted to avoid oscillations.MSEreduces the loss value multiply when the error is small,which facilitates to adjust the model parameters and improves the precision.The equation forMSEis:
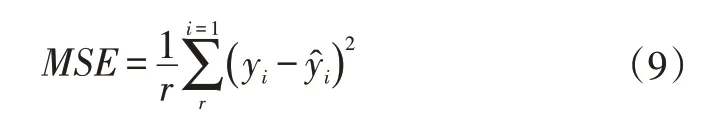
Where y presents the true value;presents the predicted value;and r presents the sample number.
However,there are two essentials need to be satisfied..Firstly,because the training labels are sparse data with low precision that can only provide coarser information during transfer learning,the detailed information extracted by the model on the dense source domain dataset should be retained as much as possible.Secondly,the collection accuracy truncates the information after integer bits,resulting in temperature data lower than the corresponding actual temperature values.Therefore,to improve the safety of the thermal fault prognosis method,the predicted value should be larger than the actual value.The two essentials require the predicted temperature should be as large as possible.The training effect of the model is greatly determined by the loss function.Therefore,a new loss function,SEE,is designed to address the two key points.The formula for SEE is:
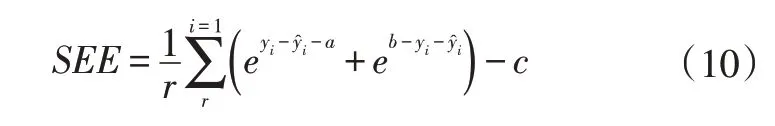
Where a presents the positive scaling factor;b presents the negative scaling factor;and c presents the bottom factor,Factora,b,and c should all take positive values.
The positive scaling factor and the negative scaling factor determine the positive and negative boundaries of the SEE-error curve respectively.Because the SEE contains 2 exponential functions added,the function value is larger than MSE,and the point where the function value equals zero is missing,which hinders the convergence of the model.Therefore,setting the bottom factor shifts the whole function down.The bottom factor should be set to the minimum value of the function,which is the function value when the error is the midpoint of the bottom region,to ensure the existence of points with zero function value.The function curves of MSE and SEE are shown in Figure 7.
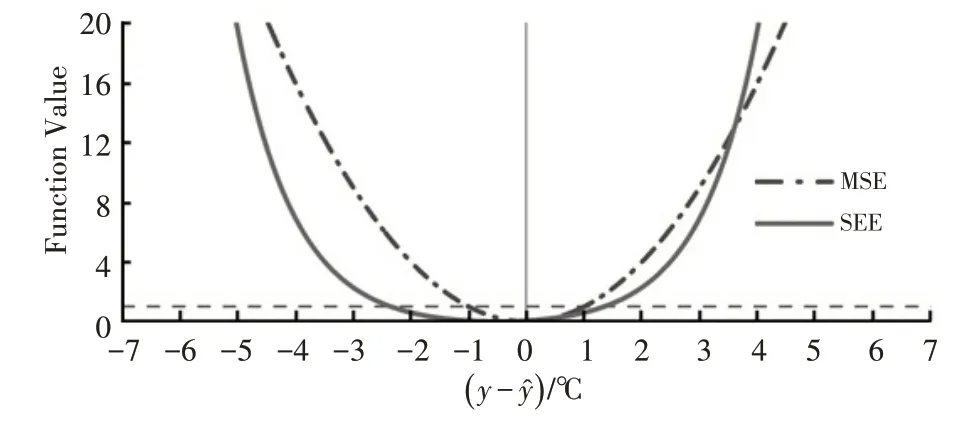
Figure 7.The function curves of MSE and SEE.
Figure 7 shows that the curve of SEE has a bottom zone near 0 in the interval from-2~1 ℃,which is longer than MSE.And the symmetry line of SEE is at-0.5 ℃,which is the same as the original design intention.The longer bottom region is beneficial for the LSTM to reduce the update of parameter and retain the detailed information if the error is small during training.This loss function biased towards negative values will lead the error also biased towards negative values.And the predicted value tends to be larger than the true value,which meets the requirement of temperature prediction with safety as the goal.
3.3 Thermal Fault Prognosis with the Threshold Alarm
The battery system temperature anomaly alarm thresholds and warning thresholds are shown in Table 2.It should be emphasized that this approach is also applicable to other types of battery systems,and the thresholds are slightly different due to the different battery performance and types.As shown in Table 2,temperature anomalies are divided into 3 levels based on severity.They are classified as Level 1 alarms,Level 2 alarms,and Level 3 alarms.Level 1 alarm status means that the battery system is in a dangerous thermal state and the driver needs to stop the car in a safe place for inspection to avoid accidents.Level 2 warning status indicates that the battery system is in a dangerous state and the place where the warning appears should be stopped for inspection under the permitted conditions.Level 3 warning state can be regarded as a safe state,but precautions need to be taken to prevent further deterioration of the detection temperature value.
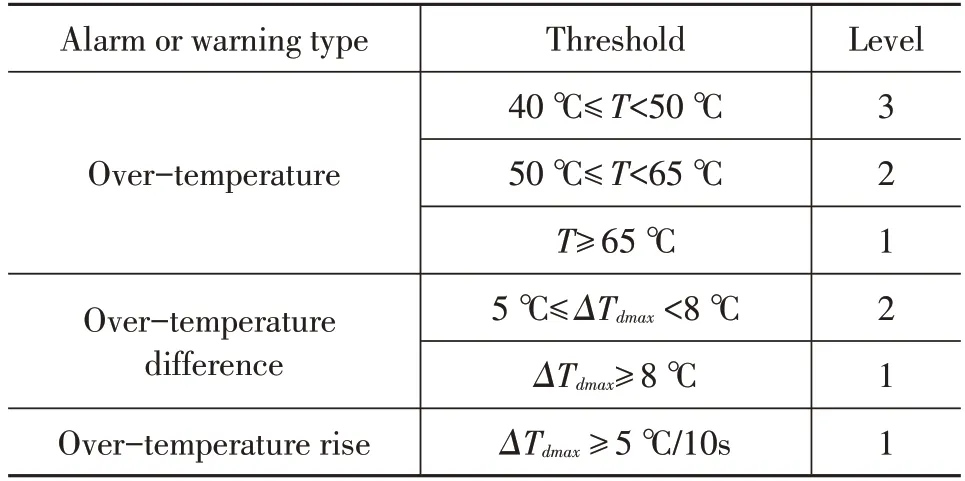
Table 2 Alarm or warning thresholds of temperature anomalies
4 Results and Discussion
4.1 Training Model in the Source Domain
The drive cycle data collected at 10 ℃are used as the source domain to train the LSTM model.The source domain dataset is processed according to Section 2 to obtain 4 068 samples.The sample set is divided into the training set,validation set,and test set accounting for 80%,10%,and 10%respectively.The training set is used to adjust the neural network parameters by returning errors during model training.The validation set is used to verify the accuracy of the LSTM in each epoch,and the neural network parameters of the best accuracy epoch are saved as the final parameters of the model.The test set is used to evaluate the performance of the LSTM after training.The loss curve of the LSTM model trained in the source domain is shown in Figure 8.The comparison of the predicted temperature from the LSTM with the actual temperature is shown in Figure 9.
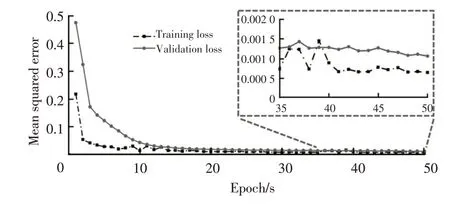
Figure 8.The loss curve of the LSTM model when trained in the source domain
Figure 8 shows that the model gradually converges after 10 s of epochs.The best loss value of the LSTM on the validation set is 0.001 06.The difference between the validation loss and the training loss is small,which indicates that the overfitting of the model training is not serious.
Figure 9 shows that the predicted temperature is quite similar to the real dense temperature data,which verifies that the LSTM can output highly accurate battery dense temperature data.Moreover,compared with the sparse real temperature data,the dense temperature data output by LSTM reflects the actual temperature more accurately and can respond the temperature change more timely.
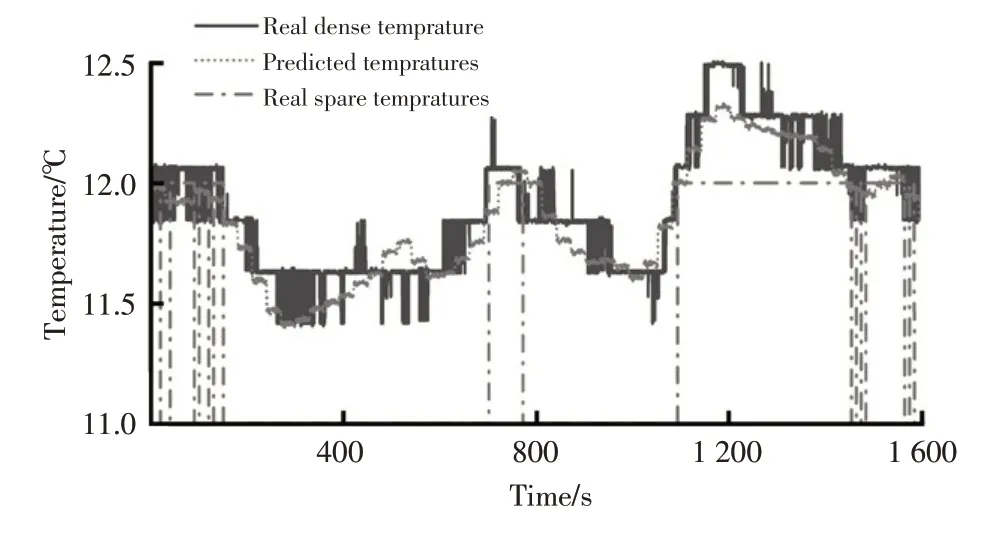
Figure 9.The comparison of the predicted temperature with the actual temperature
4.2 Transfer Model to the Target Domain
The EV battery temperature data collected by the big data platform is lack of corresponding high-precision dense temperature data to verify the effectiveness of the proposed method.Therefore,the experimental data provided in the reference[22]is used as the target domain.The 25 ℃drive cycle data is different from the air temperature data in the source domain,which is selected as the target domain data so that the target domain is sufficiently different from the source domain to verify the effectiveness of the transfer training method.The sample set of the target domain is also obtained according to the process in Section 2.The difference is that the sample amount is 1 000,which simulates the situation that vehicles connect to the big data platform with less data at the initial stage.
When transfer training is performed for the vehicles,the target domain needs dense temperature data.Therefore,the sparse temperature data of 0.1 Hz is resampled to the dense temperature data of 10 Hz as the sample's label before training.In addition,the loss function of transfer training should use SEE.Actual and predicted temperatures in the target domain is shown in Figure 10.
Figure 10 shows that the LSTM can predict the temperature accurately after transfer learning equipped with SEE.In contrast,the temperature output from the LSTM without transfer learning deviates greatly from the actual temperature.Although the predicted temperature after transfer learning deviates from the real dense temperature in some details,it became more sensitive to the temperature change.Moreover,it is more accurate at the temperature peak than the sparse real temperature.
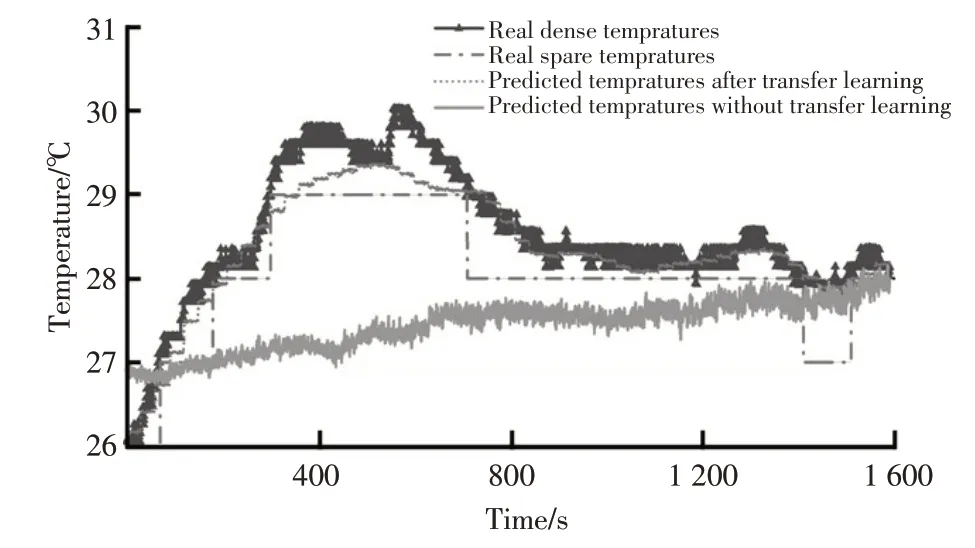
Figure 10.Actual and predicted temperatures in the target domain
4.3 Verification of Superiority
The SEE Loss function is the crucial innovation of the proposed method.In this section,the superiority of the SEE Loss function is verifyed by comparing with the MSE Loss function.The same sparse data is used to compare the transfer learning effect of SEE and MSE loss function.The SEE and MSE Loss functions are used to transfer the neural networks trained in the source domain respectively.The temperature prediction results are shown in Figure 11.
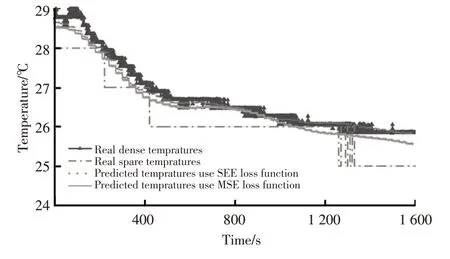
Figure 11.Temperature prediction results of neural networks trained with SEE and MSE loss functions
In Figure 11,it can be seen that the temperature prediction result of the neural network trained by the SEE loss function is closer to the real temperature,which verifies the effectiveness of the proposed SEE loss function in sparse data transfer learning.
4.4 Stability Analysis
To verify the stability of the LSTM after transfer learning on temperature prediction.The segment with the highest temperature in the source domain data is selected for temperature prediction.The temperature prediction results are shown in Figure 12.
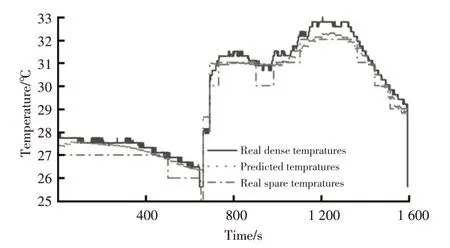
Figure 12.Results of the highest temperature segment prediction
In Figure 12,it can be seen that the LSTM accurately predict the temperature change at the highest temperature segment.This illustrates that the proposed method is well-performed in prediction even for a few samples In summary,the transfer learning method proposed in this paper is easy,accurate and stable to predict temperature,and suitable to be deployed in EVs big data platform for online thermal fault warning of many electric vehicle types.Figure 13 shows the flow chart of the method.
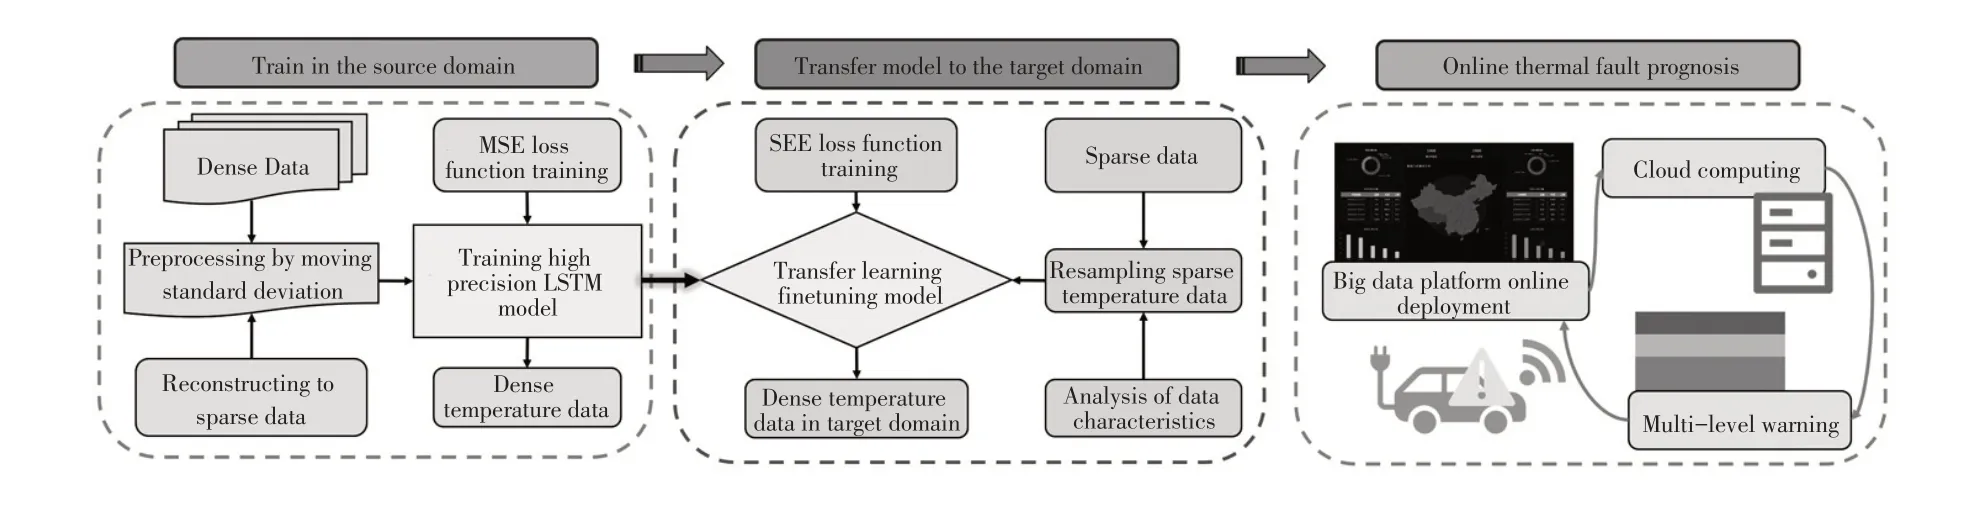
Figure 13.Online thermal fault prediction with the transfer learning method
5 Conclusions
This paper presents a neural network model for the accurate prediction of power battery temperature from sparse data and model training method by transfer learning.The MSD is used to pre-extract the temperaturerelated features from the input data.A novel transfer learning loss function retains detailed features that the model learned,and biases the model results to the beneficial range for thermal fault prognosis.
The data items of voltage,current,power,capacities are processed using MSD to extract vibration features greatly correlated with the temperature data as input to the neural network model,complementing the features lost from sparse temperature data.A neural network model is trained in the source domain to output dense temperature data with high precision.The trained model is transferred to the sparse target domain dataset.The error between the model output and the resampled sparse data is calculated using the scaling exponent error loss function,and the model is adjusted.The results demonstrate that the neural network model after transfer learning can accurately predict battery temperature and respond quickly to the temperature change.The prognosis feasibility and reliability of the model for various temperature anomalies are also validated,providing reliability for battery safety by determining the advent of thermal faults.
With the popularity of electric vehicles,more and more electric vehicles will be connected to the big data platform.Moreover,as the data amount increases,the precision of the model will be improved and the selection of better parameters will be confirmed.Moreover,the proposed neural network’s advantage of being easy to train will be more important.