Assessing 10 Satellite Precipitation Products in Capturing the July 2021 Extreme Heavy Rain in Henan, China
2022-11-07SongnanLIUJunWANG2andHuijunWANG
Songnan LIU, Jun WANG2,*, and Huijun WANG
1 Collaborative Innovation Center on Forecast and Evaluation of Meteorological Disasters,Nanjing University of Information Science & Technology, Nanjing 210044
2 Nansen–Zhu International Research Centre, Institute of Atmospheric Physics, Chinese Academy of Sciences, Beijing 100029
ABSTRACT On 20 July 2021, a sudden rainstorm happened in central and northern Henan Province, China, killing at least 302 people. This extreme precipitation event incurred substantial socioeconomic impacts and resulted in serious losses.Accurate monitoring of such rainstorm events is crucial. In this study, qualitative and quantitative methods are used to comprehensively evaluate the abilities of 10 high-resolution satellite precipitation products [CMORPH-Raw (Climate Prediction Center morphing technique), CMORPH-RT, PERSIANN-CCS (Precipitation Estimation from Remotely Sensed Information Using Artificial Neural Networks), GPM IMERG-Early (Integrated Multisatellite Retrievals for Global Precipitation Measurement), GPM IMERG-Late, GSMaP-Now (Global Satellite Mapping of Precipitation), GSMaP-NRT, FY-2F, FY-2G, and FY-2H] in capturing this extreme rainstorm event, as well as their performances in monitoring different precipitation intensities. The results show that these satellite precipitation products are able to capture the spatial distributions of the rainstorm (e.g., its location in central and northern Henan), but all products have underestimated the amount of precipitation in the rainstorm center. With the increase in precipitation intensity, the hit rate decreases, the threat score decreases, and the false alarm rate increases. CMORPH-RT is better at capturing the rainstorm than CMORPH-Raw, and it depictes the rainstorm process well; GPM IMERG-Late is more accurate than GPM IMERG-Early; GSMaP-NRT has performed better than GSMaP-Now; and PERSIANNCCS and FY-2F perform poorly. Among the products, CMORPH-RT performs the best, which has accurately captured the center of the rainstorm, and is also the closest to the station-based observations. In general, the satellite precipitation products that integrate infrared and passive microwave data are found to be better than those that only make use of infrared data. The satellite precipitation retrieval algorithm and the amount of passive microwave data have a relatively greater impact on the accuracy of satellite precipitation products.
Key words: heavy rain, CMORPH (Climate Prediction Center morphing technique), FY (Fengyun), GPM (Global Precipitation Measurement), PERSIANN (Precipitation Estimation from Remotely Sensed Information Using Artificial Neural Networks)
1. Introduction
On 20 July 2021 BT (Beijing Time), a record-breaking rainstorm occurred in central and northern Henan,during which the hourly precipitation at Zhengzhou station reached 201.9 mm between 1600 and 1659 BT. According to the 10th report of the Henan Province Flood Control and Disaster Relief Press Conference, this event caused 302 deaths and left 50 people missing as of 1200 BT 2 August 2021. Meanwhile, the Sixth Assessment Report of the Intergovernmental Panel on Climate Change points out that extreme precipitation events will become more frequent in the future; strong typhoons will increase, and extreme weather events will become more and more frequent (IPCC, 2021). Extreme precipitation events have substantial impacts on socioeconomic development and agricultural production. Therefore, how to accurately monitor these extreme precipitation events is very important.
In recent years, the techniques for estimating precipitation based on infrared and passive microwave data have developed rapidly, and their algorithms have been continuously improved (Kidd and Levizzani, 2011; Zhao et al., 2018; Tang et al., 2020). Satellite precipitation products obtain real-time global precipitation by retrieving microwave and infrared data. These products have spatial continuity and can compensate effectively for the uneven spatial distribution of station-based observation(Abdourahamane, 2021). At present, the most popular satellite precipitation products include CMORPH (Climate Prediction Center morphing technique; Joyce et al.,2004), GPM IMERG (Integrated Multisatellite Retrievals for Global Precipitation Measurement; Sorooshian et al., 2011), PERSIANN (Precipitation Estimation from Remotely Sensed Information Using Artificial Neural Networks; Hong et al., 2004), TMPA [Tropical Rainfall Measuring Mission (TRMM) Multisatellite Precipitation Analysis; Huffman et al., 2007], and GSMaP (Global Satellite Mapping of Precipitation; Okamoto et al.,2005). Researchers have evaluated the performance of satellite precipitation products in different regions and on different timescales, and found that their accuracy is related to the specific study region or timescale (Zhou et al., 2008; Zeng et al., 2018). Li et al. (2012) studied the accuracy of TRMM, CMORPH, and PERSIANN in the Yangtze River basin, and found that CMORPH performed best on the daily scale. Wang et al. (2016) analyzed the applicability of CMORPH, PERSIANN, and TRMM during the Zhouqu debris-flow event, and found that the bias of PERSIANN was large. He et al. (2018)analyzed the ability of hourly GPM IMERG, CMORPH,and PERSIANN to capture the heavy precipitation event in the Mentougou watershed on 18 June 2017, and found that PERSIANN performed poorly while CMORPH performed better. Li et al. (2018) analyzed the accuracy of GPM IMERG and TRMM in China from daily to monthly scales, and found that the performance of GPM IMERG was better. Gao et al. (2019) analyzed the ability of GSMaP_NRT, GSMaP_MVK, and GSMaP_Gauge to capture continuous heavy rainfall that occurred in Hunan Province from late June to early July 2017, and found that GSMaP_Gauge (with site correction) performed best. Zhang et al. (2021) analyzed the applicability of TMPA, TRMM RT, CMORPH, and PERSIANN in the Yellow River basin, and found that PERSIANN performed worse and TMPA better on the daily scale.
To date, several studies have evaluated the ability of satellite products to capture extreme precipitation (Gourley et al., 2011; Huang et al., 2014; Wang et al., 2017; Jiang et al., 2018). However, uncertainties still exist, and these uncertainties vary with the level of precipitation and the region being studied. This rainstorm in Henan is located in the middle and high latitude areas, where there is complex terrain. At the same time, the scale of this rainstorm in this region is large, and historical records in some parts of Henan Province have been broken. Consequently, the detection capability for this heavy precipitation event in Henan needs to be further studied.
This paper takes this rainstorm case that occurred in Henan on 20 July 2021 as an example to evaluate the performance of CMORPH-Raw, CMORPH-RT, PERSIANN-CCS, GPM IMERG-Early, GPM IMERG-Late,GSMaP-Now, GSMaP-NRT, FY-2F (China Fengyun),FY-2G, andFY-2Hdata in capturing this event, and therefore to analyze and discuss more broadly the ability of satellite precipitation products to monitor heavy precipitation. By analyzing the performance of each satellite precipitation product at different timescales, we hope to provide a useful reference for extreme precipitation monitoring and satellite product improvement.
2. Data and methods
Data from China’s national meteorological stations along with 10 sets of satellite precipitation products(Table 1) are used in this research. More specifically, the precipitation data of the national meteorological stations are obtained from the China Meteorological Data Network, the spatial distribution of which is uneven (approximately 50 km), and the temporal resolution is 1 h.

Table 1. Details and specifications of the 10 satellite precipitation products used in this research (TMI: TRMM Microwave Imager; SSM/I: Special Sensor Microwave/Imager; AMSU-B: Advanced Microwave Sounding Unit-B; AMSR-E: Advanced Microwave Scanning Radiometer for Earth Observing System; GEO: Geosynchronous Equatorial Orbit; GMI: GPM Microwave Imager; DPR: Dual-Frequency Precipitation Radar;SSMIS: Special Sensor Microwave Imager Sounder; AMSR2: Advanced Microwave Scanning Radiometer 2; MHS: Microwave Humidity Sounder; ATMS: Advanced Technology Microwave Sounder)
CMORPH is released by NCEP. It uses microwave data to retrieve the precipitation, and then it calculates the motion vector of the precipitation cloud system based on infrared images, which it uses to estimate the trend of the microwave-inverted precipitation to fill the gaps not covered by the microwave data. The temporal resolution is 30 min and the spatial resolution is 8 km. This study uses the raw and real-time satellite precipitation products(CMORPH-Raw and CMORPH-RT, respectively). The difference between them is that, with CMORPH-Raw,passive microwave precipitation features are propagated forwards through the infrared data without morphing.
PERSIANN-CCS (abbreviated simply to PERSIANN)is developed by the Hydrology and Meteorological Remote Sensing Center of the University of California,Irvine. It is mainly based on using infrared brightness temperature images to estimate precipitation by classifying cloud features, with a spatial resolution of 4 km and a temporal resolution of 1 h.
GPM is the successor of TRMM. In this paper, GPM IMERG-Early (abbreviated simply to IMERG-Early) and GPM IMERG-Late (abbreviated simply to IMERG-Late)are used. The main difference between these two products is that IMERG-Early only uses a forward propagation algorithm in the cloud motion vector propagation algorithm, while IMERG-Late also uses a backward propagation algorithm. They have a spatial resolution of 0.1° × 0.1° and a temporal resolution of 30 min.
GSMaP is developed by the Japan Aerospace Exploration Agency. It uses microwave data from low-orbit satellites and infrared data from geostationary satellites.Two sets of products are used in this study: real-time(GSMaP-Now) and near real-time (GSMaP-NRT).GSMaP-NRT uses more passive microwave data. The spatial resolution of these two sets of products is 0.1° ×0.1°, and the temporal resolutions are 30 min for GSMaP-Now and 1 h for GSMaP-NRT.
The FY series of satellite precipitation products are based on the visible light infrared spin-scanning radiometer of China’s Fengyun (FY) satellites. FY-2F,FY-2G, andFY-2Hare the names of the individual satellites in the series.
These 10 sets of satellite precipitation products use different infrared remote sensing and microwave data.Among them, the PERSIANN and FY satellite series precipitation products only use infrared remote sensing data,but the satellites used for detection are different. GSMaPNow did not use real-time passive microwave data for the event discussed in this study, whereas such data do exist in the CMORPH-Raw, CMORPH-RT, IMERGEarly, IMERG-Late, and GSMaP-NRT products.
In order to evaluate the precipitation products quantitatively, the correlation coefficient (CC) and relative error (Bias) are used, the formulae for which are as follows:

wherexirepresents the station-based precipitation at theith grid,yirepresents the precipitation of a satellite precipitation product at theith grid,andare the averages ofxandy,andnis the number of samples.
In addition, the probability of detection (POD), false alarm ratio (FAR), threat score (TS), and accuracy rate(AR) are also used to evaluate the precipitation products,the formulae for which are as follows:
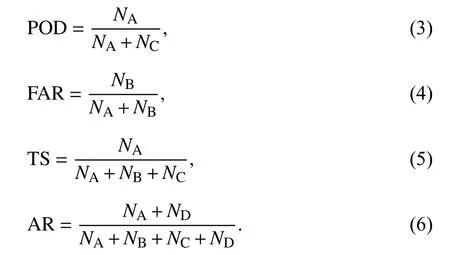
Here,NAindicates that both the station and satellite product show precipitation;NBindicates that the station shows no precipitation but the satellite product does;NCindicates that the station shows precipitation but the satellite product does not; andNDindicates that neither the station nor the satellite product shows precipitation.In this paper, precipitation is classified into five levels according to the classification standard of precipitation levels in China. At each grid, when precipitation at that grid is greater than or equal to the threshold value, it is included in the threshold score. The thresholds for light rain, moderate rain, heavy rain, storm, and extraordinary storm, in a 24-h period, are 0.1, 10, 25, 50, and 100 mm,respectively.
3. The spatial distribution of precipitation
Figure 1 shows the spatial distribution of 48-h accumulated precipitation (from 0800 BT 19 to 0759 BT 21 July 2021). As can be seen, the center of this precipitation event was located in the central and northern parts of Henan. The precipitation in Zhengzhou and its surrounding areas exceeded 500 mm, categorizing it as an extraordinary storm. All satellite precipitation products reproduced the spatial distribution of the precipitation to a certain extent, i.e., large values in the central and northern parts of Henan. As can also be seen from Fig. 1,CMORPH-Raw, CMORPH-RT, and IMERG-Late accurately reproduced the precipitation center, while that of IMERG-Early, GSMaP-Now, GSMaP-NRT, andFY-2Hwas located east of Zhengzhou, that of FY-2F was northeast of Zhengzhou, and that ofFY-2Gwas southeast of Zhengzhou. PERSIANN could not reproduce the rainstorm center.

Fig. 1. Accumulated precipitation amounts (mm) at the original resolutions of (a) the weather station network (OBS), (b) CMORPH-Raw, (c)CMORPH-RT, (d) PERSIANN, (e) IMERG-Early, (f) IMERG-Late, (g) GSMaP-Now, (h) GSMaP-NRT, (i) FY-2F, (j) FY-2G, and (k) FY-2H from 0800 BT 19 to 0759 BT 21 July 2021. The triangle represents Zhengzhou station.
The precipitation amount of each satellite product varied greatly. PERSIANN produced amounts that were too small to reach the rainstorm level, while other precipitation products did not. The precipitation amounts of CMORPH-RT and IMERG-Late were closer to observations.
In order to evaluate the accuracy of the various satellite precipitation products quantitatively, the observed precipitation and satellite precipitation products were interpolated to a 0.04° × 0.04° grid by using the Cressman method (Cressman, 1959) and bilinear interpolation method. We calculated the spatial CCs and Bias values of each satellite product. Among them, the spatial CC of CMORPH-Raw was the highest (0.84), while that ofFY-2Gwas the lowest (0.37) [the spatial CC ofFY-2H(0.46)was the highest among the FY satellite series products].In general, the performance of the satellite precipitation products (without real-time microwave data) in reproducing the spatial distribution of the precipitation of this event was poor. Except for the Bias of IMERG-Late,which was 1.76%, the Bias of all the products was below 0.
The upper-right corner of each sub-figure shows the coverage of real-time passive microwave remote sensing data used by each satellite precipitation product during the 48-h period. From the spatial distributions of GSMaP-Now and GSMaP-NRT, it can be seen that integrating more real-time passive microwave information can show more spatial distribution characteristics of precipitation. The performance of the PERSIANN and FY satellite series precipitation products without passive microwave data was poor. However, the performances of other satellite precipitation products were better than these infrared-based precipitation products, indicating that the accuracy of satellite precipitation products is greatly improved after the fusion of passive microwave data. The rainstorm center and precipitation magnitude were captured more accurately in the microwave-based products. The performance of CMORPH-RT was better than that of CMORPH-Raw, IMERG-Late was better than that of IMERG-Early, and GSMaP-NRT was better than that of GSMaP-Now, indicating that the satellite inversion algorithm and the amount of microwave data used have a marked impact on the performance of satellite precipitation products. The accuracy of the precipitation products of the different FY satellites also differed.
According to the China Meteorological Administration, the maximum hourly precipitation in Henan occurred during 1600–1659 BT 20 July 2021 in Zhengzhou. Figure 2 shows the spatial distribution of the accumulated hourly precipitation of the various satellite precipitation products in this period. The upper-right corner of each sub-figure marks the coverage rate of the realtime passive microwave data of each satellite precipitation product at this time.
It can be seen from Fig. 2a that the hourly precipitation at Zhengzhou exceeded 200 mm, and there was large-scale precipitation in the northern part of Henan.All satellite precipitation products were able to capture this spatial distribution, and the precipitation in the highvalue areas reached storm level. However, only CMORPH-Raw and CMORPH-RT were able to accurately display the location of the rainstorm center; the rainstorm center reproduced by the other precipitation products was located in the northeast of Zhengzhou.Moreover, all of the satellite precipitation products underestimated the precipitation at the center of the rainstorm. CMORPH-RT was the closest to the actual precipitation, producing a value of 40 mm.

Fig. 2. As in Fig. 1, but for the accumulated hourly precipitation amounts (mm) during 1600–1659 BT 20 July 2021.
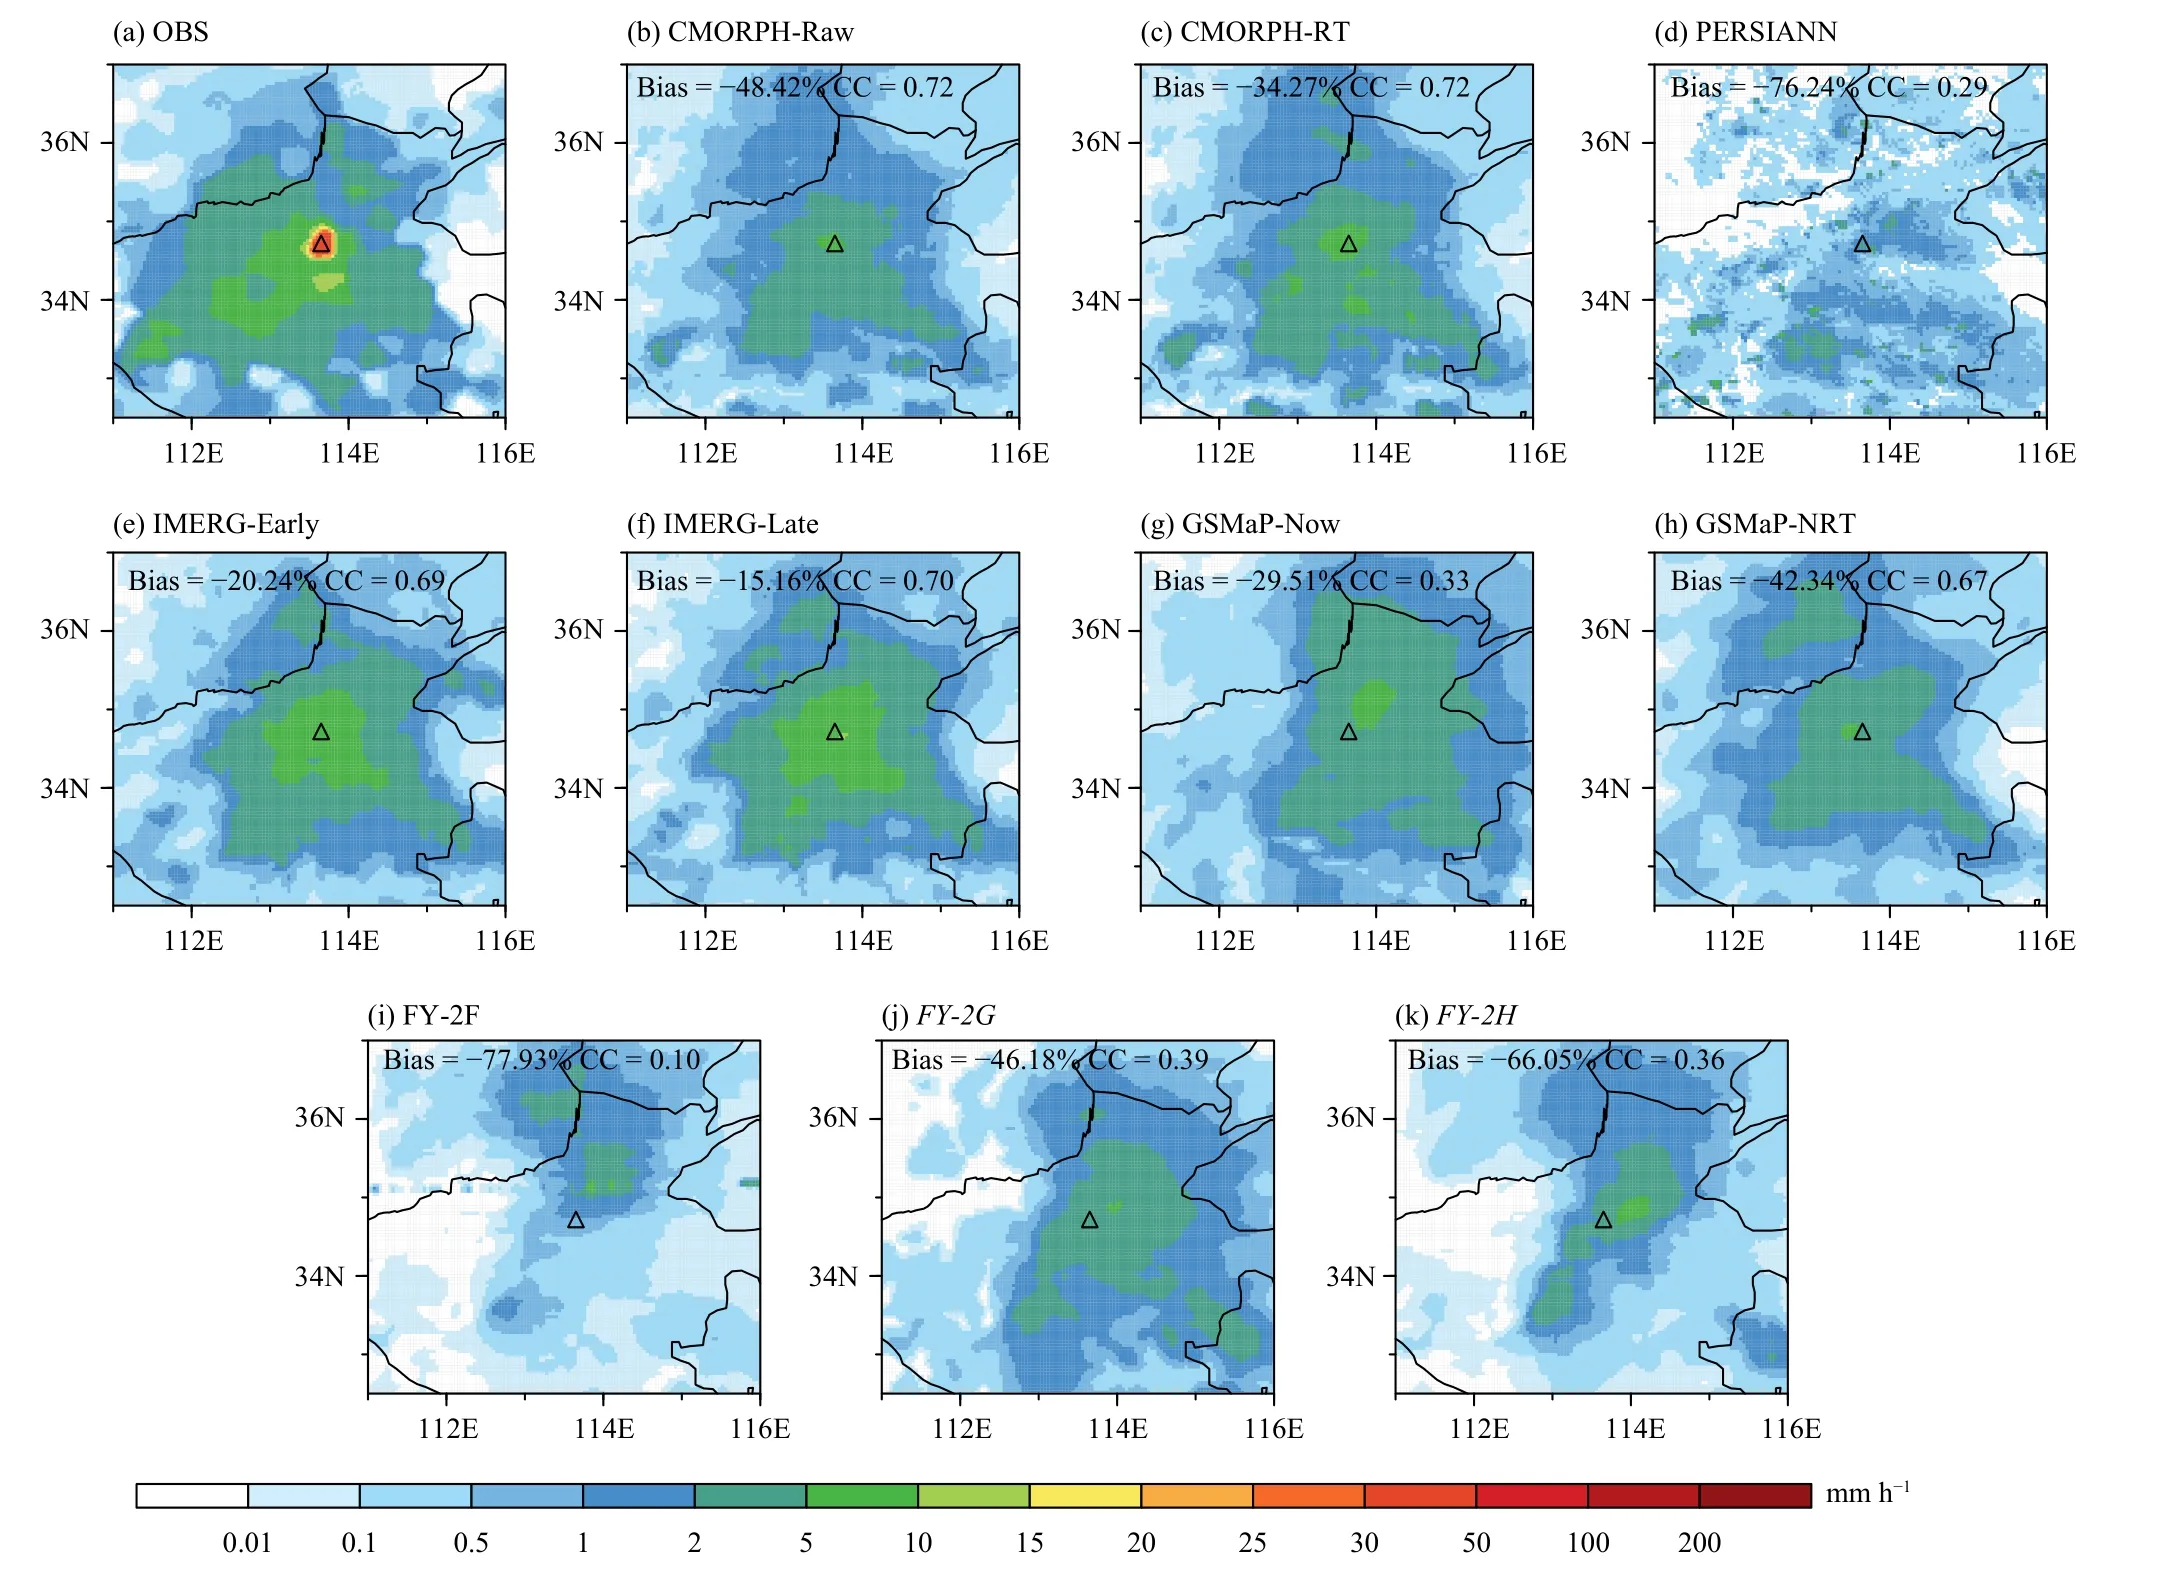
Fig. 3. As in Fig. 1, but for the precipitation amounts (mm h-1) with passive microwave data during 19–20 July 2021.
In addition to the northern precipitation area, there was a precipitation sub-center in southern Henan. With the exception of GSMaP-Now, all of the satellite precipitation products captured this precipitation pattern. Nevertheless, the precipitation centers reproduced by FY-2F,FY-2G, andFY-2Hwere located to the west of the actual center, and the precipitation centers of other precipitation products were located to the east.
On the basis of these results, we can conclude that the accuracy of CMORPH-RT was better than that of CMORPH-Raw, indicating that the satellite data processing method has a considerable impact on the accuracy of the precipitation product. The accuracy of IMERG-Late was better than that of IMERG-Early, and GSMaP-NRT was better than that of GSMaP-Now.IMERG-Late and GSMaP-NRT contain more real-time passive microwave data, indicating that the fusion of more passive microwave data can improve the accuracy of the product. The performances ofFY-2GandFY-2Hwere clearly better than that of FY-2F, demonstrating that the precipitation products of different satellites differ in their accuracy.
The spatial CCs of the satellite precipitation products at 1600 BT 20 July were lower than those of the 48-h accumulated precipitation, indicating that the satellite precipitation products have a stronger ability to capture the rainstorm process than to capture the rainstorm at a specific time. Among them, the spatial CCs of CMORPHRaw and CMORPH-RT were the highest (0.53), whereas FY-2F’s was the lowest (0.05).
All precipitation products greatly underestimated the precipitation amount (negative Bias). The PERSIANN,FY-2F,FY-2G, andFY-2Hproducts are obtained by infrared sensors, which are indirect estimates. In addition to infrared data, the three series products of CMORPH,GPM IMERG, and GSMaP also use passive microwave data. The passive microwave data used by CMORPHRaw and CMORPH-RT covered the study area during this time, as did those of GSMaP-NRT, and IMERGEarly and IMERG-Late had coverage of the study area from 1630 to 1659 BT. Due to the use of passive microwave data, these products performed better. However,the latest microwave data of GSMaP-Now in this area came from five hours prior to 1600 BT, so its accuracy was not quite as good. PERSIANN, FY-2F,FY-2G, andFY-2Honly use infrared remote sensing data, so their performances were poor compared with the other satellite products.
Figures 3 and 4 respectively show the capability of each satellite precipitation product to capture the precipitation with and without microwave data. The spatial CCs and Bias values between each satellite precipitation product and the observed precipitation are marked in the figure. As can be seen, for the satellite precipitation products that integrate infrared and passive microwave data, whether there was passive microwave satellite coverage at the current moment has little influence on the performance of the product. The accuracy of the GSMaP series products was lower than that of the CMORPH and IMERG series products, indicating poor applicability of the algorithm of the GSMaP to this event.
In order to compare the performances of the satellite precipitation products quantitatively, all products were interpolated into a 0.04° × 0.04° grid, and indicators(POD, FAR, TS, and AR) were used to objectively analyze and compare their results. Figure 5 shows the indicators under different levels of precipitation for all of the satellite precipitation products at 1600 BT 20 July. As can be seen, POD and TS decreased with the increase in precipitation level, while the opposite was the case for FAR. At the same time, the accuracy of the satellite precipitation products decreased with the increase in precipitation level. In terms of POD, IMERG-Early was the highest, while PERSIANN was the lowest. GSMaP-Now had the highest FAR, which was mainly related to the large precipitation area in the eastern part of the rainstorm area. For TS, the results were lower with PERSIANN, GSMaP-Now, FY-2F,FY-2G, andFY-2H, and the TS decreased with the increase in precipitation level.In terms of AR, GSMaP-Now was lowest. Overall, the accuracy of CMORPH-Raw, CMORPH-RT, IMERGEarly, IMERG-Late, and GSMaP-NRT were similar and higher than those of PERSIANN, GSMaP-Now, FY-2F,
FY-2G, andFY-2H.
4. The temporal evolution of precipitation
CC and Bias were selected to comprehensively describe the performance of each satellite precipitation product on the hourly scale. The results showed that CMORPH-Raw, CMORPH-RT, IMERG-Early, and IMERG-Late had higher CCs in central and eastern Henan. The CCs of GSMaP-Now, GSMaP-NRT,FY-2G,andFY-2Hwere higher in the eastern and northern parts of Henan. The CCs of PERSIANN and FY-2F in the storm area were lower, and these products were unable to reproduce the temporal changes in precipitation in the rainstorm area. In the storm area, all satellite precipitation products had negative Bias values, but values for CMORPH-RT and IMERG-Late were relatively smaller.Except for PERSIANN and FY-2F, all of the satellite precipitation products showed positive Bias values in eastern Henan (figure omitted).
Figure 6a shows the time series of all the satellite precipitation products in terms of hourly precipitation in the area shown in Fig. 1 since 0800 BT 19 July 2021. It can be seen that the precipitation increased from 0800 BT 19 July, decreased slightly at 1700 BT 20 July, and then increased. Except for PERSIANN, all of the satellite precipitation products were able to depict this change.However, they all underestimated the precipitation amount, with PERSIANN and FY-2F not capturing the event because of low precipitation.

Fig. 4. As in Fig. 1, but for the precipitation amounts (mm h-1) without passive microwave data during 19–20 July 2021.

Fig. 5. The (a) POD (probability of detection), (b) FAR (false alarm ratio), (c) TS (threat score), and (d) AR, under different precipitation levels,of various precipitation products (all data were interpolated to a 0.04° × 0.04° grid).

Fig. 6. Time series of (a) the average hourly precipitation (mm) in the domain shown in Fig. 1, and (b) the precipitation at Zhengzhou station(mm). An asterisk (*) indicates statistical significance at the 0.01 level according to the t test.
Figure 6b shows the time series of precipitation at Zhengzhou station. It can be seen that CMORPH-Raw and CMORPH-RT were able to reflect the temporal evolution of precipitation, while other precipitation products could not. All of the products underestimated the precipitation at 1600 BT 20 July. Overall, CMORPH-Raw,CMORPH-RT, IMERG-Early, IMERG-Late, GSMaPNow, GSMaP-NRT,FY-2G, andFY-2Hwere to a certain extent successful in showing the temporal evolution of precipitation in the rainstorm area; and among them,the performance of CMORPH-RT was the best.
5. Conclusions
The performances of the CMORPH-Raw, CMORPHRT, PERSIANN, IMERG-Early, IMERG-Late, GSMaPNow, GSMaP-NRT, FY-2F,FY-2G, andFY-2Hsatellite precipitation products were evaluated on the basis of the rainstorm event that occurred in Henan during 19–20 July 2021. The main conclusions are as follows:
(1) This study compared the capabilities of 10 satellite precipitation products in capturing the July 2021 extreme rainstorm event in Henan. It was found that CMORPH-Raw, CMORPH-RT, PERSIANN, IMERGEarly, IMERG-Late, GSMaP-Now, GSMaP-NRT, FY-2F,FY-2G, andFY-2Hwere to a certain extent able to capture the spatial distribution of this event. However,their ability to capture the accumulated precipitation amount was stronger than that to capture the extreme rainfall at a specific moment. CMORPH-Raw and CMORPH-RT accurately displayed the center position of precipitation at 1600 BT 20 July. Compared with observations, the satellite precipitation products underestimated the precipitation at the center of the rainstorm, with CMORPH-RT being the closest. Overall, CMORPH-RT performed best in capturing this event, while PERSIANN and FY-2F performed poorly.
(2) Different satellite precipitation products use different infrared and microwave remote sensing data. In this study, it is found that PERSIANN and the FY satellite series products, which only use infrared remote sensing data, were unable to accurately capture this rainstorm event. The satellite precipitation products that integrate infrared and microwave data performed better than those that only use infrared remote sensing data. Infrared remote sensing gives an indirect estimation of surface precipitation based on cloud-top information detected by infrared and visible light. It establishes the relationship between cloud-top brightness temperature and precipitation intensity, but cannot provide cloud particle information in the cloud or at the cloud base. Therefore, the accuracy of these products based on infrared remote sensing is poor. Compared with infrared detection, the passive microwave approach can detect cloud particles and rain particles in clouds. The physical basis of its inversion is better and the accuracy is higher compared to that of infrared remote sensing. However, due to the complexity of the surface radiation background, satellite precipitation products based on passive microwave data have certain errors.
(3) In general, the amount of passive microwave data and the satellite inversion algorithm are the factors affecting the accuracy of satellite precipitation products.However, only adding passive microwave data is not necessarily going to improve the accuracy of satellite precipitation products. The precision of satellite precipitation products obtained by different satellites also varies.This study found that the satellite precipitation products that integrate active and passive remote sensing data had a better ability to capture the location and magnitude of the rainstorm area in northern Zhengzhou, and were able to monitor the rainstorm. However, for the extreme precipitation center (1600 BT 20 July), the monitoring capability was found to be lacking. At present, satellite precipitation products greatly underestimate the precipitation of this type of event. The accuracy of such products can be further improved by increasing the spatiotemporal coverage of the passive microwave data and the satellite scanning radius, improving satellite inversion algorithms,and fusing more satellite information.
(4) At present, satellite precipitation products cannot accurately capture extreme rainstorms like this event in Henan. Mainstream satellite precipitation products and algorithms are mainly developed by foreign institutions,but there are also many meteorological satellites operated by China. The differences between the various satellite precipitation products are large. The development of a multisatellite precipitation product suitable for China,based on Chinese satellite data and the actual situation in China, should be considered.
杂志排行
Journal of Meteorological Research的其它文章
- Progress and Prospects of Research on Subseasonal to Seasonal Variability and Prediction of the East Asian Monsoon
- An Empirical Model of Tropical Cyclone Intensity Forecast in the Western North Pacific
- Intensified Impact of the Equatorial QBO in August–September on the Northern Stratospheric Polar Vortex in December–January since the Late 1990s
- Interannual Relationship between Summer North Atlantic Oscillation and Subsequent November Precipitation Anomalies over Yunnan in Southwest China
- Stochastically Perturbed Parameterizations for the Process-Level Representation of Model Uncertainties in the CMA Global Ensemble Prediction System
- Assimilation of All-Sky Radiance from the FY-3 MWHS-2 with the Yinhe 4D-Var System