Assimilation of All-Sky Radiance from the FY-3 MWHS-2 with the Yinhe 4D-Var System
2022-11-07ShuoMAWeiminZHANGXiaoqunCAOYanlaiZHAOandBainianLIU
Shuo MA, Weimin ZHANG, Xiaoqun CAO, Yanlai ZHAO, and Bainian LIU
College of Meteorology and Oceanography, National University of Defense Technology, Changsha 410073
ABSTRACT Compared with traditional microwave humidity sounding capabilities at 183 GHz, new channels at 118 GHz have been mounted on the second generation of the Microwave Humidity Sounder (MWHS-2) onboard the Chinese FY-3C and FY-3D polar orbit meteorological satellites, which helps to perform moisture sounding. In this study, as the allsky approach can manage non-linear and non-Gaussian behavior in cloud- and precipitation-affected satellite radiances, the MWHS-2 radiances in all-sky conditions were first assimilated in the Yinhe four-dimensional variational data assimilation (YH4DVAR) system. The data quality from MWHS-2 was evaluated based on observation minus background statistics. It is found that the MWHS-2 data of both FY-3C and FY-3D are of good quality in general. Six months of MWHS-2 radiances in all-sky conditions were then assimilated in the YH4DVAR system. Based on the forecast scores and observation fits, we conclude that the all-sky assimilation of the MWHS-2 at 118- and 183-GHz channels on FY-3C/D is beneficial to the analysis and forecast fields of the temperature and humidity, and the impact on the forecast skill scores is neutral to positive. Additionally, we compared the impacts of assimilating the 118-GHz channels and the equivalent Advanced Microwave Sounding Unit-A (AMSUA) channels on global forecast accuracy in the absence of other satellite observations. Overall, the impact of the 118-GHz channels on the forecast accuracy is not as large as that for the equivalent AMSUA channels. Nevertheless, all-sky radiance assimilation of MWHS-2 in the YH4DVAR system has indeed benefited from the 118-GHz channels.
Key words: Microwave Humidity Sounder-2, data assimilation, Yinhe four-dimensional variational data assimilation, all-sky radiance, Fengyun-3
1. Introduction
At present, global meteorological satellites collect massive amounts of data daily. The ability to fully utilize these data is crucial for improving the forecast accuracy of numerical weather prediction (NWP) systems for all operational NWP centers. Satellite radiances were originally only assimilated in clear-sky conditions due to the lack of a rapid radiative transfer model for accurate complex scattering calculations and inaccurate descriptions of the non-linear nature of moist atmospheric processes in the NWP system. Thus, satellite observations affected by cloud and precipitation are usually abandoned, resulting in a vast majority of satellite observations having vital information that cannot be fully utilized (Bauer et al., 2010). After years of joint efforts, the community has addressed some core issues associated with the assimilation of satellite data sensitive to clouds and precipitation. Fast radiative transfer models have been developed, such as Radiative Transfer for TOVS(RTTOV; Saunders et al., 2018) and Community Radiative Transfer Model (CRTM; Han et al., 2006; Weng,2007), for satellite radiance simulations at cloud and precipitation conditions. Additionally, some advanced cloud schemes (Tiedtke, 1993; Tompkins and Janiskova, 2004;Forbes and Tompkins, 2011) and moist convection schemes (Tiedtke, 1989; Bechtold et al., 2014) can also describe moist processes with increasing accuracy. With the developmental of these technologies, operational NWP centers have been dedicated to assimilating the satellite radiance data in all-sky (i.e., clear, cloudy, and precipitation) conditions (Geer et al., 2018). In particular,achievements have been made with respect to the assimilation of microwave data (Chambon et al., 2020).
Spaceborne passive microwave instruments are mainly divided into two categories: microwave sounders(MWSs) and microwave imagers (MWIs). MWIs contain imaging channels that can receive radiance from the surface, and are mainly used to sense the column-integrated humidity over the ocean. Otherwise, MWSs contain temperature or humidity sounding channels sensitive to temperature or water vapor, clouds, and precipitation. As reported by NWP centers, these microwave observations exhibit significant impacts on large-scale forecasting scores, extreme events, and precipitation forecasts (Geer et al., 2017). Microwave observations sensitive to humidity, clouds, and precipitation in all-sky conditions were first assimilated in the ECMWF operational system (Bauer et al., 2010). The results from the forecast sensitivity to observation impact (FSOI) tool demonstrated that the impact of these observations on the forecast errors had increased from 8% to approximately 20%from 2012 to 2020 (Forbes et al., 2020). The Met Office assimilated microwave radiances from Microwave Humidity Sensors (MHS) in all-sky conditions and found an overall root mean square error (RMSE) reduction and significant improvements in extratropical wind and temperature forecast skill (Chambon et al., 2020; Candy and Migliorini, 2021). In the Gridpoint Statistical Interpolation analysis system (GSI) at the NCEP, the all-sky radiance assimilation of Advanced Technology Microwave Sounder and Advanced Microwave Sounding Unit-A(AMSUA) was tested, and the temperature and relative humidity forecasting were improved (Zhu et al., 2016,2019). Microwave radiance assimilation under all-sky condition has also been developed by the Japan Meteorological Agency (JMA) global NWP system and the experimental results showed significant positive impacts(Kazumori, 2019). In addition, the impact of all-sky assimilation of MWSs and MWIs radiance on hurricane forecasts was also tested; tropical cyclone track predictions for all ocean areas were significantly improved via all-sky assimilation (Chambon et al., 2020). Thus, the all-sky assimilation of microwave observations sensitive to humidity, clouds, and precipitation is key to improving global and regional weather forecasts.
The China Meteorological Administration’s (CMA’s)
Fengyun-3C(FY-3C) andFengyun-3D(FY-3D) polar orbiting satellite were launched in September 2013 and November 2017, respectively, with the aim to improve the accuracy of atmospheric detection and provide observations for operational use within the China Meterological Administration-Global Positioning Systems (CMA-GPS)(Li et al., 2016; Wang et al., 2019). The Microwave Humidity Sounder-2 (MWHS-2) and Microwave Radiation Imager (MWRI) are mounted on the two satellites to obtain humidity, cloud, and precipitation information.Lawrence et al. (2018) first attempted to assimilate the MWHS-2 data fromFY-3Cin all-sky conditions in the ECMWF assimilation system, with positive impacts on forecast accuracy. Furthermore, the MWHS-2 radiance has become the input source for the operational assimilation system of the ECMWF. Recently, the impacts from the FY-3 satellite series, which includes data from the MWHS-2, MWRI, and radio occultation receiver(GNOS), was evaluated; an observational system experiment showed that the FY-3 instruments jointly contributed significantly to the forecast skill in the ECMWF system (Bormann et al., 2021). Moreover, the data quality of microwave instruments onboard theFY-3Dsatellite was evaluated (Carminati et al., 2021) and the all-sky assimilation of MWHS-2 can benefit the Met Office NWP global system (Carminati and Migliorini, 2021). In addition, all-sky assimilation ofFY-3CMWHS-2 observations was also researched to the forecasts of cloud-associated weather processes such as Meiyu precipitation(Li et al., 2021) and binary typhoons (Xian et al., 2019).In some cases, all-sky assimilation provided more cloud and precipitation information, which then benefited the forecasting of these weather processes. However, all-sky radiance assimilation is under developed and these water vapor, cloud, and precipitation-sensitive data have not yet been assimilated in the CMA-GPS. To fully utilize these valuable microwave observations, we first attempted to assimilate the radiance data from the MWHS-2,mounted onFY-3CandFY-3D, under all-sky conditions in the Yinhe four-dimensional variational assimilation(YH4DVAR) system (Zhang et al., 2012) and to evaluate the impacts on global forecast accuracy. The purpose of this study is to implement and test these microwave observation assimilations under all-sky conditions in the near real-time YH4DVAR operational system.
The paper is organized as follows. Sections 2 and 3 introduce the characteristics of the MWHS-2 channels and YH4DVAR system. Section 4 includes an extension of the all-sky approach to the MWHS-2. Section 5 describes the observation minus background calculations and compares our results to those of similar instruments.Section 6 describes the assimilation experiments and the impacts of MWHS-2 assimilation in all-sky conditions.Finally, Section 7 draws conclusions and discusses the limitations of this study and future research directions.
2. MWHS-2 characteristics
The MWHS-2 retains the 183-GHz channel frequency of its predecessor, MWHS, but has been expanded to five channels, which are sensitive to humidity, clouds, and precipitation. Moreover, eight 118-GHz channels sampling an oxygen line were first mounted on passive microwave instruments for the Fengyun satellites (Li et al.,2016). Five channels near the band center are sensitive to temperature and the three other channels are also sensitive to clouds and precipitation. Finally, the MWHS-2 contains the 89- and 150-GHz window channels sensitive to surface properties and water vapor. The observations of the two window channels are usually used to retrieve surface emissivity and analyze cloud and precipitation effects. In the YH4DVAR operational system, observations from the AMSUA temperature-sounding channels and MHS humidity-sounding channels mounted on MetOp and NOAA series satellites have already been assimilated, yielding significant improvements. Thus, we compared the MWHS-2 channels to the equivalent channels on these similar instruments to evaluate its performance. Table 1 details the central frequencies and approximate peak heights of the MWHS-2 channels, as compared with those of the MHS and AMSUA. The MHS has two window channels and three traditional 183-GHz channels; the polarization of some channels is different from that of the MWHS-2 channels. Moreover, a single oxygen line at 118 GHz is sampled to eight bands; most bands are sensitive to temperature, except for some surface-sensitive bands. In contrast, AMSUA samples between 50- and 57-GHz oxygen lines and channels have lower noise than the MWHS-2 118-GHz channels. The central frequency and polarization of the MWHS-2 channels are partially different from that of the AMSUA and MHS channels, but similar channels are sensitive to temperature or humidity at nearly the same approximate peak heights. We calculated the Jacobians using the RTTOV model and normalized the results, as shown in Fig. 1. The approximate peak heights of the MWHS-2 channels compared with those of the AMSUA and MHS channels, are also provided in Table 1.
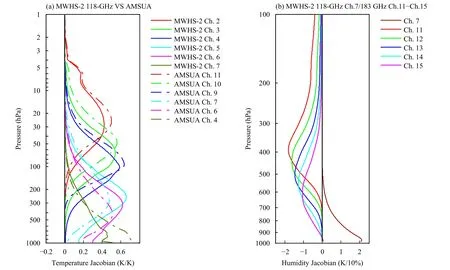
Fig. 1. (a) Temperature Jacobians for the MWHS-2 118-GHz channels and AMSUA channels under clear-sky conditions, and (b) humidity Jacobians for MWHS-2 channels 7 and 11–15 under clear-sky conditions.

Table 1. MWHS-2 channels, central frequency, and approximate peak height compared with MHS and AMSUA
3. Operational YH4DVAR system
The YH4DVAR system is an operational 4DVAR system that uses the global spectral model as a constraint to impose a dynamic balance on assimilation with a 12-h window, which improves the initial conditions of the atmosphere (Zhang et al., 2012; Zhu et al., 2014). The modified nonhydrostatic moist global spectral dynamical core based on a dry-mass vertical coordinate, as presented by Peng et al. (2019), was performed to operate the global forecast spectral model. Furthermore, the incremental method proposed by Trémolet (2004) was employed. In this method, multiple outer loops at high resolutions were iterated to improve the accuracy of the analysis field. At each outer loop, the objective function was minimized through the iteration of inner loops at a lower resolution to obtain the analysis increment. The analysis increment was interpolated to the full resolution and then added to the background to update the analysis. At each inner loop, the physical parameterization schemes and observation operators were linearized to improve the computational efficiency. In the latest version, the outer loop resolution was TL1279L137, with three inner loop resolutions of TL159L137, TL255L137, and TL255L 137. The maximum 80, 40, and 40 inner iterations were set for the three inner loops. As an important component of data assimilation, the flow-dependent background error covariance was generated by using Ensemble Data Assimilation (EDA)-like technology which was adaptedin the ECMWF and Mete-France (Bonavita et al., 2012).The members of EDA were generated at a lower resolution data assimilation system by perturbing background,observations, and SST. However, a major limitation of this approach is the high computation cost, which imposes the ensemble size to rather small one, such asN=10. Such a small ensemble size implies a negative sampling noise that cannot be ignored. In order to improve estimation accuracy, a low-pass filter as well as the hybrid method combining the climatic covariance and the flowing one were implemented to reduce the sampling noise (Liu et al., 2016; Xing et al., 2020).
Conventional data on Global Telecommunication System (GTS), Global Positioning System Radio Occultation (GPSRO), and radiance data from the microwave sounder instruments were assimilated in the YH4DVAR system. Considering the tangent point drift, the 2D bending angles operator was used to improve the accuracy of the bending angles simulation. For the satellite radiance data, radiance observations from AMSUA instruments in clear-sky conditions were assimilated. Otherwise, radiance observations from MHS instruments in all-sky conditions were already assimilated. The fast radiative transfer model RTTOV version 11.2 was used to calculate the at-aperture radiance based on background fields. The allsky radiative transfer model, RTTOV-SCATT, was especially utilized to simulate the at-aperture radiance in allsky conditions considering the scattering, absorption, and emission of hydrometeors. Owing to the radiance observation bias caused by instrument calibration and radiative transfer calculations, the variational bias correction scheme (Dee, 2004) was introduced based on the constraint of the objective function using a bias correction term.
4. All-sky assimilation of MWHS-2
In the operational YH4DVAR system, the AMSUA temperature-sensitive channels and MHS humidity-sensitive channels were assimilated and the results showed that there was significant improvement to the anomaly correlation coefficient (ACC) and RMSE of the 500-hPa geopotential height forecasts. To further enhance the performance of the YH4DVAR system, we developed and implemented the all-sky assimilation of theFY-3C/3DMWHS-2 observations. The MWHS-2 contains 183- and 118-GHz channels sensitive to temperature and humidity.Although the method for assimilating the approximate equivalent channels of the AMSUA and MHS can be adapted to assimilate the MWHS-2 observations, the characteristics of the MWHS-2 channels are partially different from those of the AMSUA and MHS. Thus, some important components in the all-sky assimilation of the MWHS-2, such as observation quality control, observation error model, surface emissivity assignments, and variational bias corrections, are provided below.
4.1 MWHS-2 observation quality control
At the beginning of data assimilation, some observations, which could degrade the analysis, had to be rejected. Observations of MWHS-2 118-GHz channels 8 and 9, which are highly sensitive to the surface, were first rejected. As the emissivity and skin temperature calculations have reduced accuracy over land, MWHS-2 118-GHz channels 5–7, which provide troposphere temperature and humidity information, were only assimilated over the ocean. The observations of MWHS-2 183-GHz channels over high orography were also screened out owing to their high surface sensitivities. According to the humidity Jacobian, the orography thresholds were set to 1500, 1300, 1000, 900, and 800 m for channels 11–15,respectively. Additionally, the observations of MWHS-2 channels 7, 14, and 15 on the surface over snow, sea ice,and mixed features were also abandoned as surface emissivity retrieval was difficult. To avoid the uncertainty in radiative transfer simulations, caused by field interpolation, and reduce the spatial correlation (Bédard and Buehner, 2020), the observations were thinned to the nearest Gaussian grid at the TL255 resolution; only one observation from each grid point was retained at each timeslot of the assimilation time window. Then, the first guess check was utilized to reject the problematic observations if the observation minus the background (OmB)was three-fold greater than the assigned observation error.
4.2 Observation error
In the clear-sky condition, observation errors can be diagnosed through statistics on the background and analysis departures (Desroziers et al., 2005). Taking the observation error assignment of the AMSUA channels in the operational YH4DVAR system as an example, the product of the background and analysis departures was first calculated to obtain the observation error covariance matrix. Assuming that there was no error correlation between the different channels, the observation errors could be retrieved by the diagonal values of the matrix.Then, the final observation error for each channel was inflated owing to influencing factors, such as the spatial correlation. According to temperature Jacobians for the MWHS-2 118-GHz channels shown in Fig. 1, this method can be used to assign the observation errors to MWHS-2 channels 2–4, which are not sensitive to the surface.However, this method cannot be used for all-sky conditions because observation errors highly rely on the scattering effect of clouds and precipitation, both of which are scene dependent.
The scattering index (SI) should be first defined to describe the scattering effect. Owing to different sensitivities to hydrometeor particles, the bright temperatures of a low-frequency window channel and high-frequency window channel are usually used to identify cloud-affected observations (Bennartz et al., 2002). For the MWHS-2,the 89- and 150-GHz window channels just met this condition. Over land, the SI is defined by the difference in the bright temperatures of the two window channels.Over ocean, the bright temperature of each channel at the clear-sky condition, which was simulated by the radiative transfer model, should be removed to eliminate the vapor effect (Zhu et al., 2019):

As the observed cloud and precipitation may not be precisely simulated by the forecast model, the symmetric cloud predictor,Csym, as proposed by Baordo and Geer(2015), was calculated based the average observation scatter index and background scatter index to resolve the representative errors. The bright temperatures in the two channels in the scatter index formula were all simulated by the radiative transfer model, RTTOV, using the background field to obtain the background scatter index.
The scene dependent observation errors in all-sky conditions should be assigned based on the scattering indicator. In this study, the adaptive observation error model provided by Geer and Bauer (2011) was introduced with the following observation error, σ:
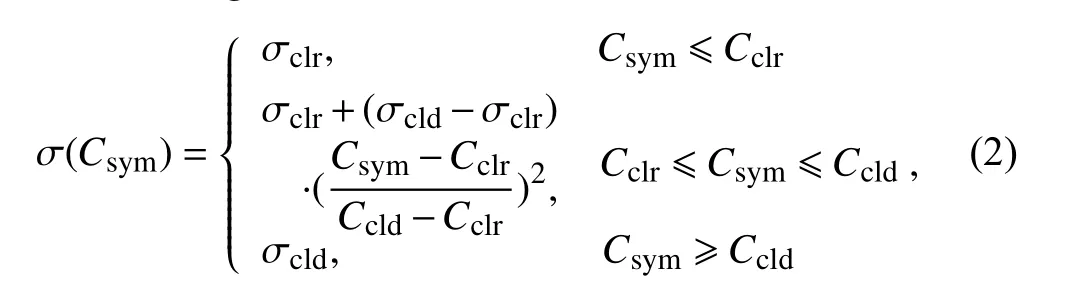
whereCclrandCcldare two threshold values of the piecewise quadratic function, and σclrand σcldare the corresponding clear sky and saturation observation error, respectively. Between the two cloud threshold values, the quadratic fit was modeled between the standard deviations of OmB andCsym. Owing to the uncertainty of the surface emissivity over different surface types, four parameters were separately fitted for different channels over the land and ocean.
Figure 2 provides the standard deviation of the OmB with respect to the symmetric cloud predictor for theFY-3C/DMWHS-2 surface-sensitive channels over land(top) and ocean (bottom). Moreover, the quadratic fits of these channels are also shown. In Fig. 2, the estimated values of the four parameters for the surface sensitive channels ofFY-3C/DMWHS-2 over ocean and land were utilized for observation error assignment. The results showed that there were partial differences between the plots of theFY-3CandFY-3DMWHS-2 channels,perhaps due to the slightly different characteristics of the two instruments. Furthermore, there were significant correlations between the observation errors of different channels; however, these correlations varied with the symmetric cloud predictor. These correlations were not considered in this study but will be investigated in the future.
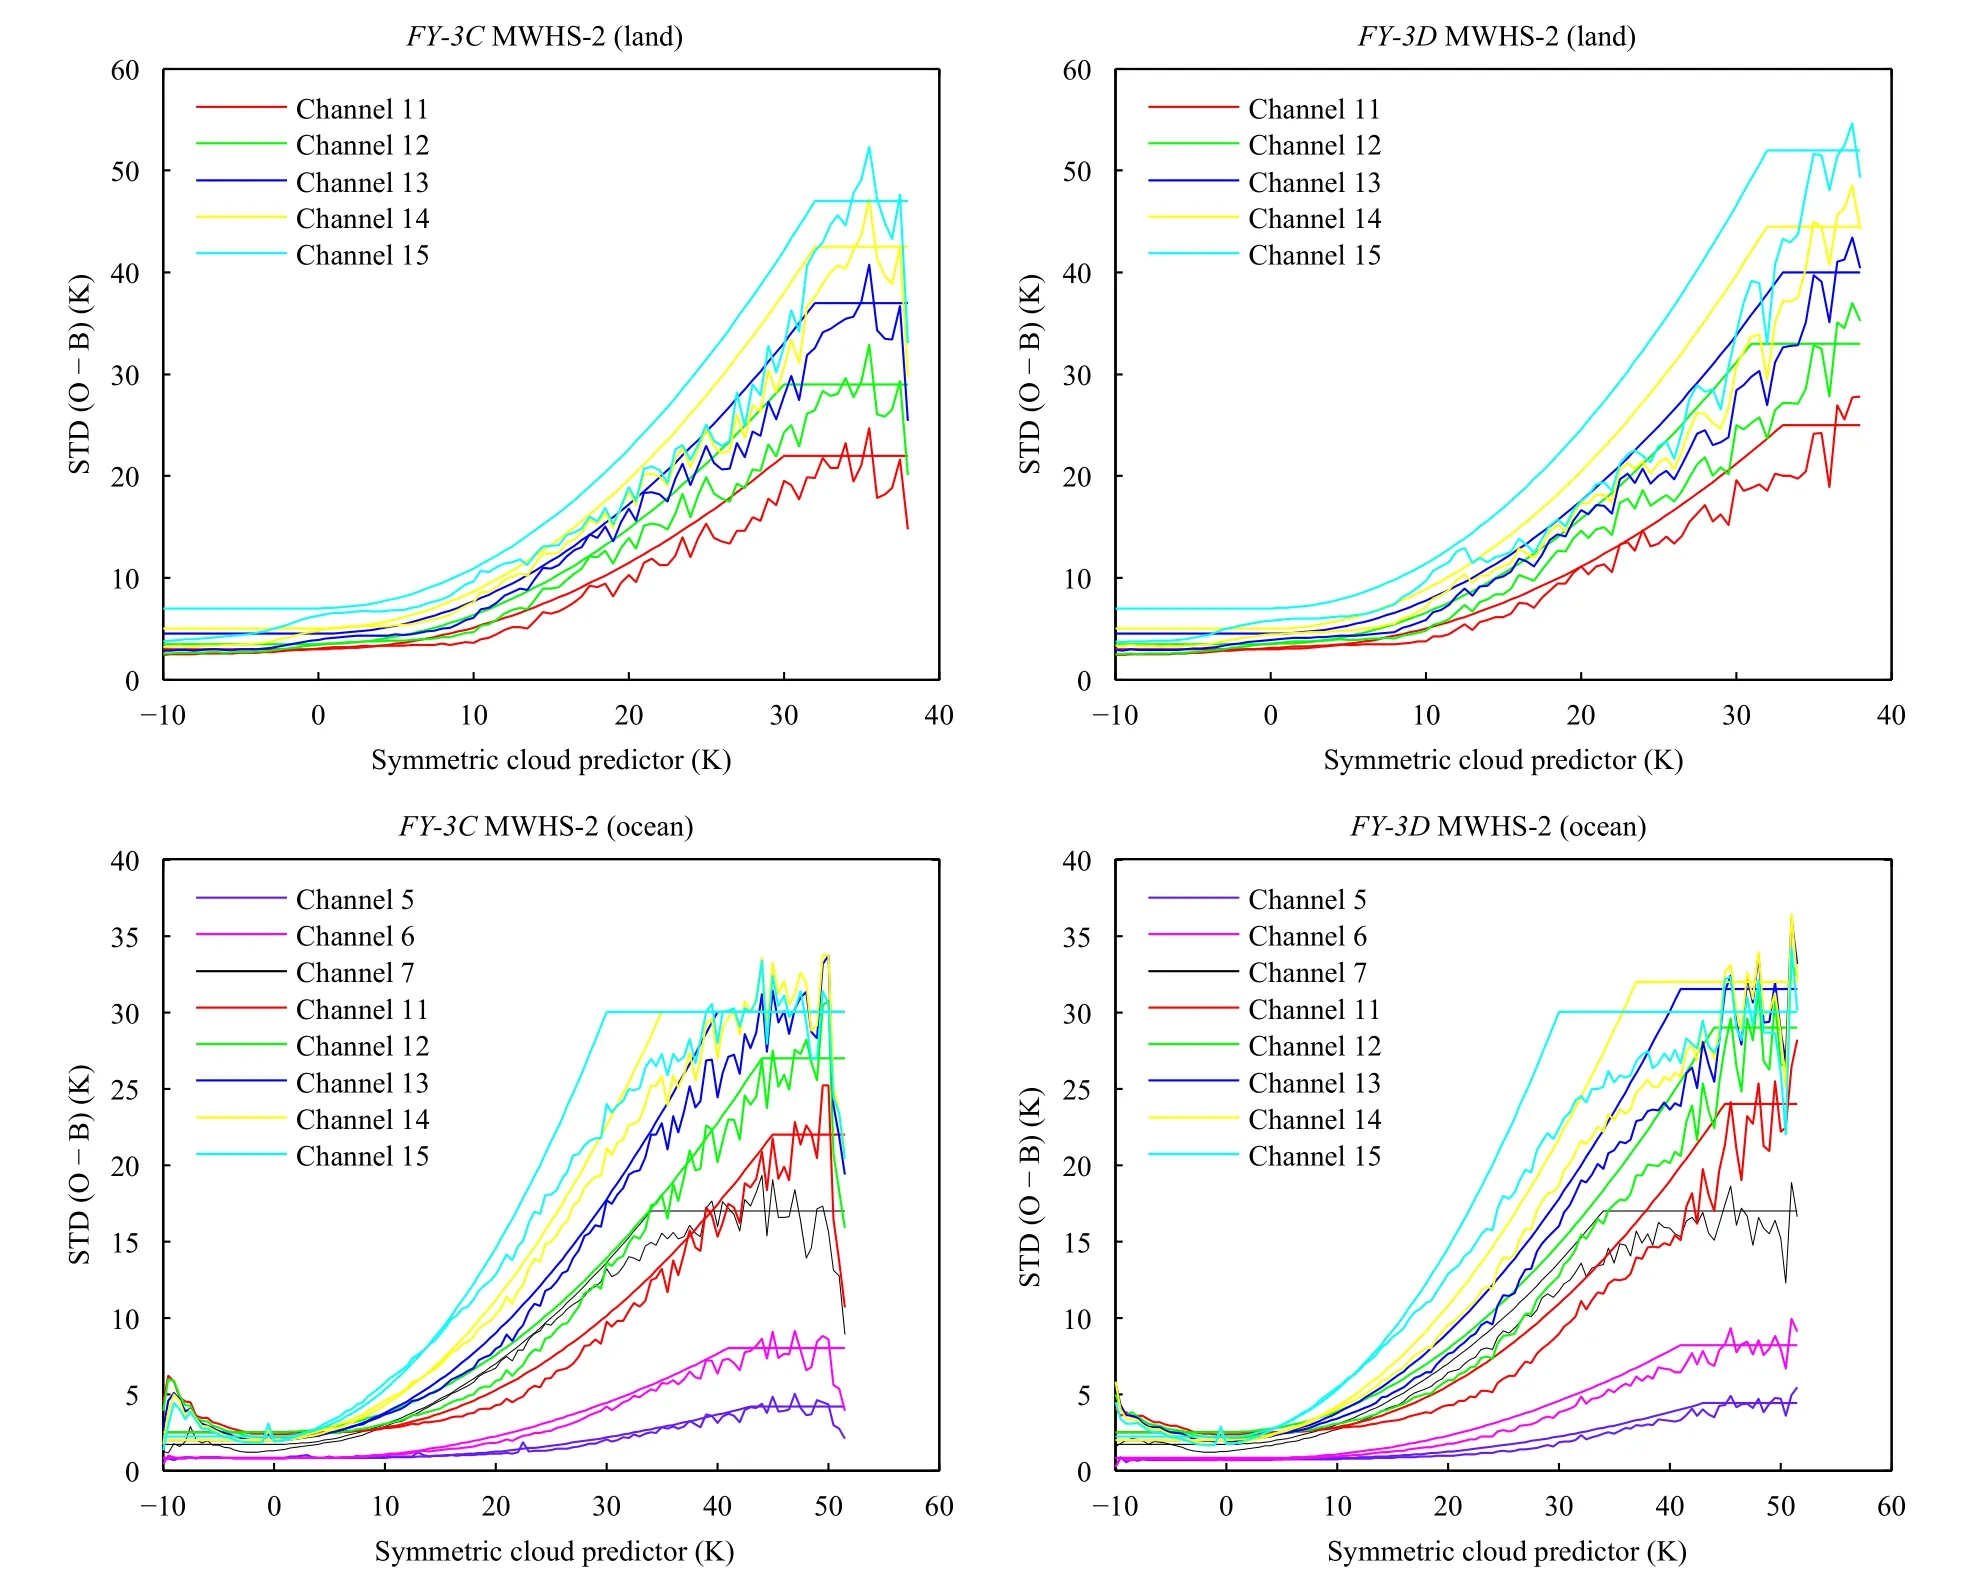
Fig. 2. Standard deviation of the OmB with respect to the symmetric cloud predictor for the FY-3C/D MWHS-2 surface-sensitive channels over land (top) and ocean (bottom).
Fig. 3. Distribution of the mean differences between the assigned emissivities at 89 H and corresponding atlas values for July 2019.
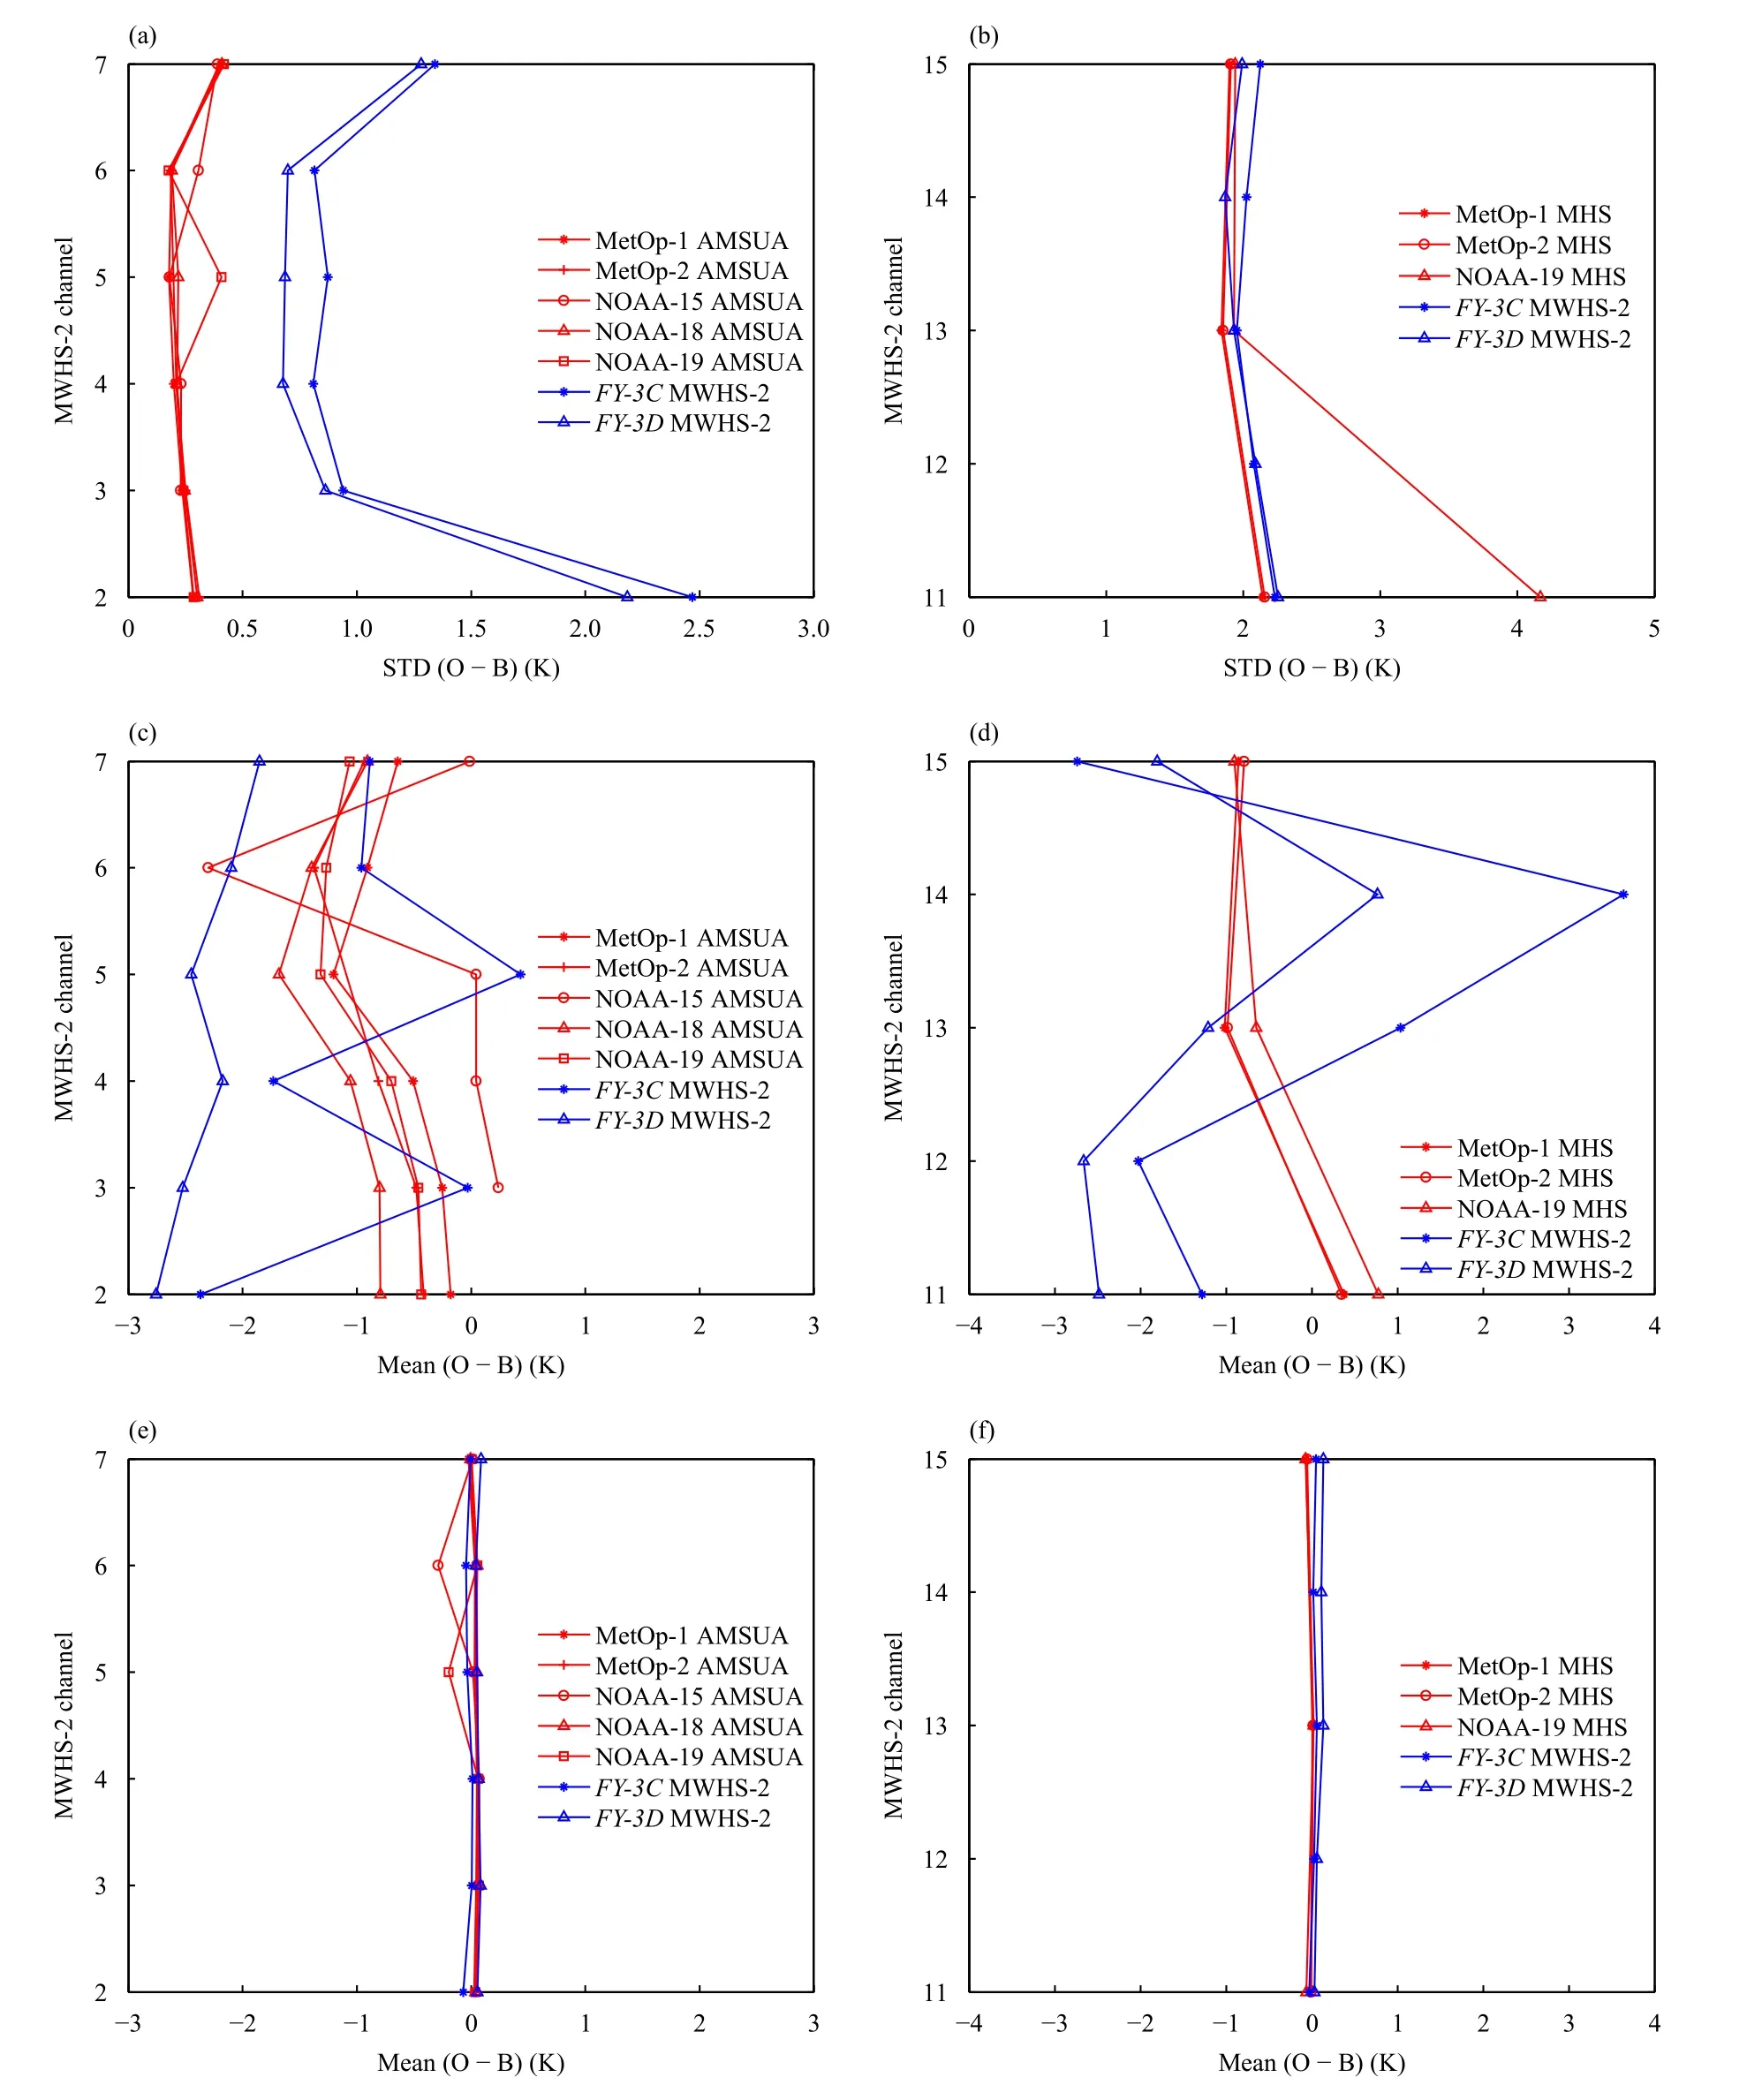
Fig. 4. (a) Standard deviation of the OmB for the MWHS-2 118-GHz channels on FY-3C and FY-3D, as compared with the approximate equivalent channels of the AMSUA on the MetOp and NOAA series, after variational bias correction. (b) Standard deviation of the OmB for the MWHS-2 183-GHz channels on FY-3C and FY-3D, as compared with the corresponding channels of the MHS on the MetOp and NOAA series,after variational bias correction. (c) Mean of the OmB for the MWHS-2 118-GHz channels on FY-3C and FY-3D, as compared with the approximately equivalent channels of the AMSUA on the MetOp and NOAA series, before variational bias correction. (d) Mean of the OmB for the MWHS-2 183-GHz channels on FY-3C and FY-3D, as compared with the corresponding channels of the MHS on the MetOp and NOAA series before variational bias correction. (e) is the same as (c) after variational bias correction. (f) is the same as (d) after variational bias correction. The statistics were calculated for the period of 1–30 July 2019.
4.3 Surface emissivity retrieval
As the climate surface emissivity can yield significant uncertainties in the bright temperature simulations of surface sensitive channels, a more accurate surface emissivity was needed to be supplied or retrieved. The surface emissivity retrieval method proposed by Karbou et al.(2005) was employed in the YH4DVAR system. First,we modified the rttov_eddington procedure from the RTTOV package to retrieve the surface emissivity in the all-sky conditions over land based on the observations of the window channels. Constrained by the Tool to Estimate Land Surface Emissivities at Microwave Frequencies(TELSEM) atlas emissivity, as provided by RTTOV, the surface emissivity values over land were finally obtained.Additionally, the FAST Microwave Ocean Surface Emissivity Model (FASTEM) version 6 was used to retrieve the surface emissivity over the ocean.
Figure 3 displays the geographical distribution(50°N–50°S, 0°–360°) of the mean differences between the assigned emissivities at 89 H and the corresponding atlas values for July 2019. The map is composed of 1° ×1° binned grids. The differences between the assigned emissivities at 89 H and the corresponding atlas values were averaged for the full sampling period at each grid cell. Notably, there were deviations in almost all land areas, where the mean differences mainly ranged from-0.02 to 0.03. Therefore, the adaptive surface emissivity could improve the accuracy of the radiative transfer simulation of the MWHS-2 surface-sensitive channels.
4.4 Variational bias correction
In the YH4DVAR system, the variational bias correction scheme (Dee, 2004) was adopted based on the constraint of the objective function using the bias correction term to reduce the radiance observation bias caused by instrument calibration and radiative transfer calculations.The bias correction term (b) was written as a linear bias term as a function of the predictors (pk), such as the constant thickness of different layers, total column water,surface temperature, or satellite observation geometry:
The predictors were selected for each channel based on the sensitivity of the observations to them. Here, βkrepresents the bias parameters, which are iterated at each outer loop. The increments of the parameters were decreased as the control vectors were updated along with the model state variables at each inner loop.
The bias predictors of MWHS-2 channels 2–7 were identical to those of the approximate equivalent AMSUA channels. The bias predictors of MWHS-2 channels 11–15 were identical to those of the corresponding MHS channels. Thus, constant thicknesses of 1000–300,200–50, 10–1, 50–5 hPa, as well as the viewing angle and square of the viewing angle correction terms, were selected as the bias predictors for MWHS-2 channels 2–7 and 11–15. Furthermore, the total column water and surface temperature bias term were added for the two window channels. Similar to Zhu et al. (2016), the bias parameters were retrieved based on the data where the clouds were consistent with both the observation and background, which were then applied to all radiances.
To test the effect of the variational bias correction method, the monthly mean of the background departures of the MWHS-2, AMSUA, and MHS radiances were examined before and after variational bias correction for July 2019. The radiances not contaminated by thick clouds were selected over the ocean and between 60°N and 60°S. Section 5 describes the detailed configuration of the experiments, with results presented in Figs. 4c–f.Notably, there were biases in the observations of all channels before variational bias correction. The monthly mean of the background departures was approximately 0 K after variational bias correction, which indicated that the variational bias correction method operates optimally for the microwave radiances.
5. Observation minus background statistics
The observation minus background statistics (OmB)was first calculated to assess the radiance data from the MWHS-2 onboardFY-3CandFY-3D. To perform a more efficient assimilation experiment, the outer loop resolution was set to TL799L137 with three inner loop resolutions of TL159L137, TL255L137, and TL255L137, which were lower than the operational configurations. The monitoring experiment was run during 1–30 July 2019. In this experiment, the MWHS-2 radiance observations were not assimilated, but monitored in the YH4DVAR system. The satellite radiance observations were all bias-corrected based on the variational bias correction scheme. The bias predictors of MWHS-2 channels 2–7 were identical to those of the approximate equivalent AMSUA channels. The bias predictors of MWHS-2 channels 11–15 were identical to those of the corresponding MHS channels. Owing to large errors caused by the radiative transfer calculations under cloudy conditions, the cloud-affected observations were removed to assess instrument performance. The filter method proposed by Lawrence et al. (2018), based on the symmetric cloud predictor, was used to filter the observations affected by thick clouds.
Figures 4a and 4b shows the standard deviations of the OmB for the MWHS-2 channels onboardFY-3CandFY-3D, as compared with those from channels in Advanced TIROS-N Operational Vertical Sounder (ATOVS) on the MetOp and the NOAA series, which peak at a similar height after variational bias correction. The statistics were calculated for 1–30 July 2019. Figure 4a shows that the standard deviations of the OmB for the AMSUA channels on different satellites were approximately identical, but were < 0.5 K. The exception was that the standard deviations of AMSUA channel 6 on NOAA-15 and AMSUA channel 7 on NOAA-19 were 0.1 and 0.15 higher than that those on other satellites, respectively.Additionally, the standard deviations of the OmB for the MWHS-2 channels were notably different from those of the approximately equivalent AMSUA channels. In other words, the standard deviations of the MWHS-2 were significantly higher than those of the AMSUA. This result was mainly due to the different central frequencies between the MWHS-2 and AMSUA, which led to different instrument noise. Furthermore, the bias pattern for the MWHS-2 onboardFY-3CandFY-3Das a function of the channel number was consistent. However, the standard deviations of the OmB for the MWHS-2 118-GHz channels onFY-3Dwere all less than those onFY-3C, indicating that the performance of the MWHS-2 onFY-3Dwas better than that of its predecessor. The standard deviations of the OmB for MWHS-2 channels 2 and 7 were approximately 1.5 and 2.5 K, respectively; otherwise,those for channels 3–5 were < 1 K. Figure 4b shows that the bias patterns for MWHS-2 and MHS were similar,with the exception of MHS channel 11 on NOAA-19,whose bias was two-fold higher than others. Thus, the radiance observations of MHS channel 11 on NOAA-19 were not assimilated in the following experiments. In addition, the standard deviations of the OmB for the MWHS-2 183 GHz channels onFY-3Dwere also less than those onFY-3C.
Figures 4c and 4d show the monthly mean OmB for the MWHS-2 channels onFY-3CandFY-3Dcompared with those for the approximately equivalent channels of the ATOVS on the MetOp and NOAA series before variational bias correction. As shown in Fig. 4c, the biases of AMSUA on different satellites were similar, with notable negative biases for all channels, except for some channels of the NOAA-15 AMSUA. The bias pattern of theFY-3CMWHS-2 118 GHz channels had a Z-shaped feature. The biases of channels 2 and 4 were cooler than those of the corresponding AMSUA channels. The biases of theFY-3DMWHS-2 118-GHz channels were especially observed to be 1–2 K cooler than those the AMSUA temperature-sounding channels. For the monthly averaged mean OmB of the 183-GHz channels of the MHS on different satellites, the biases were approximately 0 K, as shown in Fig. 4d. However, there were notably negative or positive bias for all of the 183-GHz channels in the MWHS-2 onFY-3CandFY-3D, despite some similar bias patterns. The instrument-related noise may have accounted for these results. Furthermore, the biases of theFY-3DMWHS-2 channels were 0.5–2.5 K cooler than those of theFY-3CMWHS-2 channels, except for that of channel 15.
6. Assimilation experiments
6.1 All-sky assimilation of the MWHS-2
Two groups of experiments were run to test the impact of the all-sky assimilation of the MWHS-2 radiance on the YH4DVAR system. The control run (CTL) used all observations, which were employed in the operational YH4DVAR system. This included conventional data from GTS, GPSRO bending angles, and radiances from microwave sounder instruments. GPSRO bending angles were obtained from the TERRASAR-X, TANDEM-X,METOP/GRAS, and COSMIC series. The microwave radiances were obtained from the AMSUA at clear-sky conditions and MHS at all-sky conditions (MetOp and NOAA series). Compared with the control run, the observations fromFY3C/DMWHS-2 at all-sky conditions were also assimilated into the all-sky MWHS-2 experiment (MWHS-2_allsky). The experiments were performed based on the latest version of the YH4DVAR system for a total period of 6 months in the summer and winter (June–August 2019 and December 2019–February 2020). However, in contrast to the operational YH4DVAR system, which was at a model resolution of TL1279L137, with three inner loop resolutions of TL159L137, TL255L137, and TL255L137, the lower horizontal model resolution of TL799 was used in the assimilation experiments for enhanced efficiency in terms of computational cost and memory. Notably, the background error covariance matrix for the assimilation trials was generated by the ensembled data assimilation experiment without MWHS-2 observations. Furthermore, data assimilation trials had already been performed 10 days before the beginning of the assimilation experiments owing to a system spin-up phenomenon caused by the MWHS-2 radiance assimilation.
The impact of the MWHS-2 data assimilation on the 1–10 day forecast accuracy was examined in Fig. 5,which showed the normalized difference of the RMSE of the two experiments as a function of the forecast day.The normalized difference can be defined as [RMSE(MWHS-2_allsky) – RMSE(CTL)]/RMSE(CTL), where a negative value indicates an improvement in the MWHS-2_allsky experiment compared with the control experiment. Besides the geopotential height at 500 hPa,the temperature and vector wind at 100, 500, and 850 hPa were also compared. In the Northern Hemisphere(NH), the impact of the all-sky assimilation of MWHS-2 radiances on the relatively longer-range forecast accuracy was 1%–2% improved in geopotential height for up to 4 days at 500 hPa and for temperature for up to 6 days at 500 hPa. Otherwise, neutral impacts on the RMS scores for the geopotential, temperature, and vector wind at other levels were observed. In the Southern Hemisphere (SH), there was a 1%–4% improvement in the forecast accuracy for geopotential height for up to 8 days at 500 hPa. Additionally, there was a significant improvement in the forecast accuracy for temperature for days 2–10 at 100 hPa, days 2–8 at 500 hPa, and days 5–10 at 850 hPa. For the vector wind RMSE, positive impacts were observed from days 3–10, except at 850 hPa from days 8–10. Nevertheless, a generally neutral impact was observed for all of the other forecast results,except for that of the vector wind at 850 hPa, which notably improved for forecast days 3–10. Overall, in terms of the forecast scores, the all-sky assimilation of the MWHS-2 observations in the YH4DVAR system had a neutral to positive impact on longer-range forecasts.
Furthermore, the standard deviation of the background departures for the radiosonde observations and AMSUA radiances as a percentage relative to those of the control experiment were also computed, as displayed in Fig. 6 and Fig. 7 respectively, to assess the accuracy of short-range forecasts. As shown in Fig. 6, the standard deviations of the background departures for all radiosonde observations generally improved from the all-sky assimilation of the MWHS-2 radiances. In the Northern Hemisphere, there was a 0.5% improvement in the fit to the radiosonde temperature observations over 150–850 hPa and the radiosonde humidity observations over 100–850 hPa. In addition, a significant impact (1% improvement) was observed in the radiosonde wind observations over 200–500 hPa. In the tropics, the largest impact (2% improvement) occurred for the radiosonde humidity observations over 300–400 and 700–850 hPa.Furthermore, a 1% improvement was observed for radiosonde wind observations over 250–850 hPa and for radiosonde temperature observations over 150–400 hPa.However, a degradation was observed for the radiosonde wind observations over 50–100 hPa. As shown in Fig. 7,the improvement for the AMSUA temperature-sensitive observations decreased with an increase in the channel number in the Northern Hemisphere, indicating that the temperature improvements decreased with pressure. Additionally, a significant reduce occurred in channels 5–7 and 9 in the AMSUA in the tropics, which demonstrates the significant improvement for the temperature fields of their corresponding atmosphere layers. Based on Table 1,the peak heights of channels 5–7 and 9 of AMSUA were 300–450 and 100 hPa, respectively. According to the peak height, the improvements in the AMSUA temperature-sensitive observations were consistent with those for the radiosonde temperature observations.

Fig. 5. Normalized differences of the RMSE with respect to the forecast day: geopotential height at 500 hPa; temperature at 100, 500, and 850 hPa; and vector wind at 100, 500, and 850 hPa. Error bars indicate the statistical significance at the 95% confidence level and the statistics were averaged for a total period of 6 months.
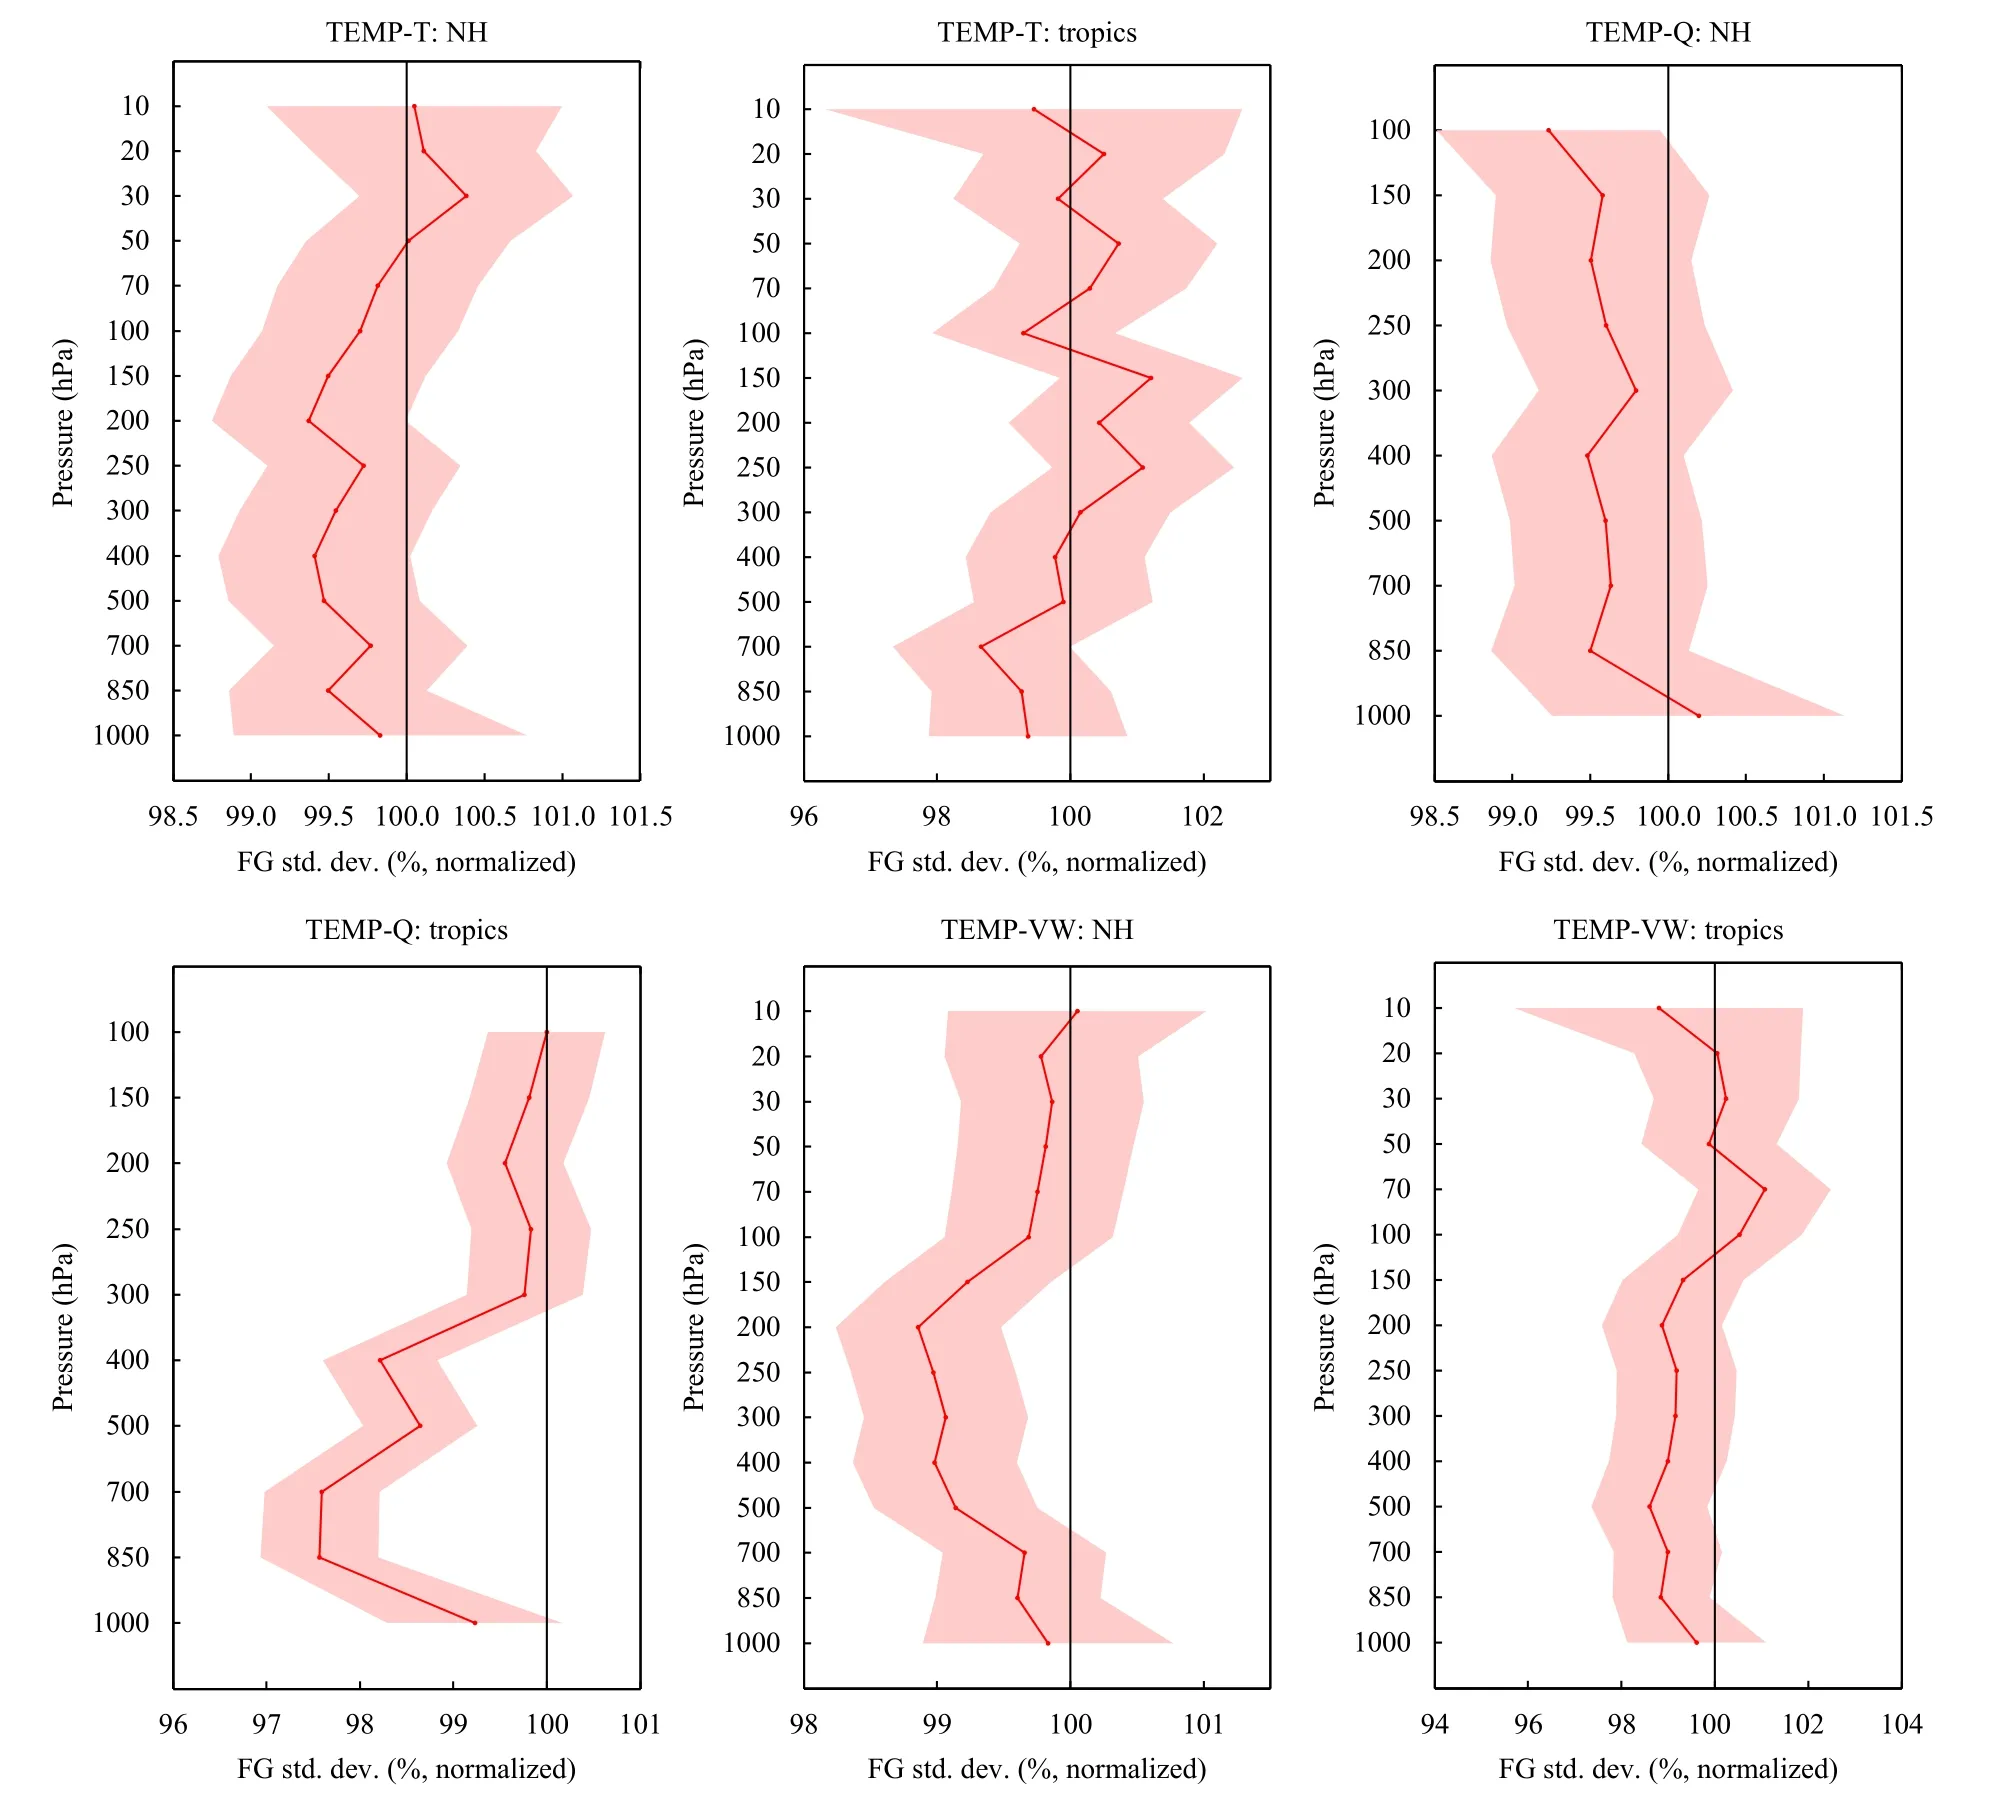
Fig. 6. Standard deviations of the background departures for the temperature, humidity, and wind observations from the radiosondes as a percentage relative to those of the control experiment. Error bars indicate the statistical significance at the 95% confidence level and the statistics were averaged for a total period of 6 months. FG indicates first guess.
Overall, the all-sky assimilation of the MWHS-2 118-and 183-GHz channels onFY-3C/Dbenefited the temperature and humidity analyses and forecast fields. The impact on the forecast skill was neutral to positive based on a comparison of the forecast scores and standard deviation of background departures for the observations.
6.2 Assimilation of the MWHS-2 118-GHz channels
New channels at 118 GHz were first mounted on MWHS-2 for the Fengyun satellites. Thus, we then analyze the impact of assimilation of radiances from the MWHS-2 118-GHz channels. As the information contents of the MWHS-118-GHz channels and AMSUA channels have been widely discussed because of the similar characteristics, we first ran three groups of experiments to compare the impact of the assimilation of the MWHS-2 118-GHz channels to that of the AMSUA channels on the YH4DVAR system. The control run(CONV) only assimilated the conventional data from GTS. In contrast with the control run, the MWHS-2 118-GHz channels 2–7 and AMSUA channels (5, 6, 7, 9, 10,and 11) were assimilated separately in the MWHS-2-118 GHz experiment (EXP1) and AMSUA 50–60-GHz experiment (EXP2). In order to evaluate the impact of a single instrument on the forecast accuracy, the observing system experiments for theFY-3DMWHS-2 and MetOp-C AMSUA were performed for the period 1 June–10 July,2019. All forecasts were verified against each experiment’s own analysis.
Compared to assimilating the conventional data, the data assimilation of both instruments resulted in great improvements in the forecast accuracy of different variables (geopotential height, temperature, relative humidity, and vector wind) at different atmospheric heights in the Northern Hemisphere, Southern Hemisphere, and tropics. In addition, the impacts on forecast accuracy were more pronounced over the Southern Hemisphere.Also, we compared the forecast impact of assimilating the radiances of the MWHS-2 118-GHz channels to that of the corresponding AMSUA channels. The anomaly correlation (AC) of geopotential height and temperature at 250 and 500 hPa for the Northern Hemisphere is presented in Fig. 8. The assimilation of MWHS-2 118-GHz radiances had more positive impacts on the AC of geopotential height and temperature at 250 and 500 hPa in the Northern Hemisphere, especially on days 5–10.Additionally, the relative RMSE differences in temperature and geopotential height between EXP2 and EXP1 are shown in Fig. 9. The results showed that in the Northern Hemisphere the temperature, and geopotential height RMSEs were reduced by 2%–6% in the AMSUA experiment over nearly all pressures, except for geopotential height for 50–100 and 850–1000 hPa. However, in the Southern Hemisphere, the improvement was small and typically not statistically significant. Moreover, the geopotential height, temperature, and vector wind RMSE reductions were significant at the 95% confidence level at nearly all pressure levels from day 1–6 except for geopotential height at 850 hPa, which indicated that there were most positive impacts in the tropics. Overall, the impact of the MWHS-2 118-GHz channels on the forecast accuracy was not as large as that for AMSUA channels in the YH4DVAR system.

Fig. 7. Standard deviation of the background departures for observations from AMSUA temperature-sensitive channels as a percentage relative to those of the control experiment. Error bars indicate the statistical significance at the 95% confidence level and the statistics were averaged for a total period of 6 months.

Fig. 8. Anomaly correlation of geopotential height and temperature at 250 and 500 hPa for the Northern Hemisphere.

Fig. 9. Relative RMSE differences of temperature and geopotential height in the Northern Hemisphere between the MetOp-C AMSUA experiment and FY-3D MWHS-2 118-GHz experiment during the period from 21 May to 30 June 2019.
Although the MWHS-2 118-GHz channels and AMSUA channels have similar peak heights of weighting functions, different frequencies may show different influences in assimilation. In order to further analyze the impact of assimilation of radiances from the MWHS-2 118-GHz channels, we then ran experiment without assimilating 118-GHz channels (no118-GHz) as a comparison against the MWHS-2_allsky experiment. The experiments were performed from 1 July to 10 August 2019 and from 1 December 2019 to 10 January 2020. The normalized differences of the relative humidity RMSE with respect to the forecast day are shown in Fig. 10. In the Northern Hemisphere, neutral impacts on the RMS scores were observed for the relative humidity at 500 and 850 hPa. However, the assimilation of MWHS-2 118-GHz radiances had positive impacts on the forecast accuracy in relative humidity at 500 and 850 hPa. In the Southern Hemisphere, the impact showed a 1%–2% improvement for up to 6 days at 500 hPa and for forecast days 3–8 at 850 hPa. In the tropics, the impact showed a 1%–2% improvement for forecast days 2–7 at 500 hPa and for days 3–10 at 850 hPa. Additionally, a generally positive impact (not shown) was observed for geopotential height, temperature, and vector wind in both the tropics and Southern Hemisphere area. Thus, all-sky radiance assimilation of MWHS-2 in the YH4DVAR system benefited from the data assimilation of the 118-GHz channels.

Fig. 10. Normalized differences of the RMSE with respect to the forecast day: relative humidity at 500 and 850 hPa. Error bars indicate the statistical significance at the 95% confidence level.
7. Conclusions
The MWHS-2 radiances in all-sky conditions were assimilated in the YH4DVAR system. In this study, the data quality of the MWHS-2 was evaluated based on the monthly average of the OmB, and was then compared with that of similar instruments. There were notably negative or positive biases for all channels of the MWHS-2 onFY-3CandFY-3D. The biases of theFY-3DMWHS-2 channels were 0.5–2.5 K cooler than those of theFY-3CMWHS-2 channels, except for channel 15 before variational bias correction. In addition, the standard deviations of the OmB for the MWHS-2 channels onFY-3Dwere all less than that onFY-3C, which indicated that the performance of the MWHS-2 onFY-3Dwas slightly better than its predecessor. Six months of MWHS-2 radiances were then assimilated in all-sky conditions in the YH4DVAR system, which were compared with the control experiments. Based on the forecast scores and observation fits, we concluded that the all-sky assimilation of the MWHS-2 118- and 183-GHz channels onFY-3C/Dbenefited the temperature and humidity fields, while the impact on the forecast skill scores was neutral to positive. Additionally, we compared the impact of assimilating the 118-GHz channels with that of equivalent AMSUA channels on the global forecast accuracy in the absence of other satellite observations. Overall, the impact of the 118-GHz channels on the forecast accuracy was not as large as that for the equivalent AMSUA channels.Nevertheless, all-sky radiance assimilation of MWHS-2 in the operational YH4DVAR system also benefited from the 118-GHz channels.
However, there were some limitations in this study.First, the observation error correlations among different channels, which could yield unexpected impacts on the forecast skills, were not considered in this study. Based on the statistics of the standard deviation of the OmB with respect to the symmetric cloud predictor, we found that there were significant correlations between the observation errors of different channels and the correlations varied with the symmetric cloud predictor. The ability to manage these scene dependent correlations is our future focus. Furthermore, hydrometeors in data assimilation should be accounted to retrieve realistic analyses of clouds and precipitation and improve the initial balances. Finally, some surface sensitive observations were not assimilated in the YH4DVAR system. A more accurate surface emissivity retrieval method could improve the quality of the observation operator. Although the all-sky assimilation of the MWHS-2 onFY-3C/Dimproved the forecast skill, its impact was relatively small.The already assimilated MHS radiances from the NOAA and MetOp series satellites could account for this result,which have approximately equal equatorial crossing times compared toFY-3C/Dat all-sky conditions.FY-3E,which is the first early-morning-orbit satellite in the FY series, was launched on 4 July 2021. In addition, microwave sounders will be mounted on the next generation of geostationary satellites and future constellations in CubeSats. Therefore, the density of observations may significantly increase in space and time. The ability to optimally use the massive amount of microwave data to improve the forecast skill remains a significant scientific challenge, which should be the focus of future research.
Acknowledgments.The authors thank the anonymous reviewers for their constructive comments and suggestions.
杂志排行

Journal of Meteorological Research的其它文章
- Progress and Prospects of Research on Subseasonal to Seasonal Variability and Prediction of the East Asian Monsoon
- An Empirical Model of Tropical Cyclone Intensity Forecast in the Western North Pacific
- Intensified Impact of the Equatorial QBO in August–September on the Northern Stratospheric Polar Vortex in December–January since the Late 1990s
- Interannual Relationship between Summer North Atlantic Oscillation and Subsequent November Precipitation Anomalies over Yunnan in Southwest China
- Stochastically Perturbed Parameterizations for the Process-Level Representation of Model Uncertainties in the CMA Global Ensemble Prediction System
- Direct Radiative Effects of Dust Aerosols over Northwest China Revealed by Satellite-Derived Aerosol Three-Dimensional Distribution