Interannual Relationship between Summer North Atlantic Oscillation and Subsequent November Precipitation Anomalies over Yunnan in Southwest China
2022-11-07ShabinHAOJiandongLIandJiangyuMAO
Shabin HAO, Jiandong LI, and Jiangyu MAO
1 State Key Laboratory of Numerical Modeling for Atmospheric Sciences and Geophysical Fluid Dynamics (LASG),Institute of Atmospheric Physics, Chinese Academy of Sciences, Beijing 100029
2 University of Chinese Academy of Sciences, Beijing 100049
ABSTRACT The summer North Atlantic Oscillation (SNAO) strongly affects the climate variability over Europe and downstream East Asia similar to its winter counterpart. This study thus investigates the interannual relationship between SNAO and the subsequent autumn precipitation anomalies over Yunnan, Southwest China and related physical mechanisms based on reanalysis data during 1958–2020. The results show that the interannual variations in SNAO exhibit a significant positive correlation with anomalies of Yunnan precipitation in November. Composite analyses demonstrate that for the positive SNAO phase, the positive sea surface temperature anomalies (SSTAs) in midlatitude North Atlantic as part of a tripole SSTA tend to weaken from summer to November through changes in surface heat fluxes.In turn, the predominately negative SSTA in tropical North Atlantic that persists into November induces an anomalous cyclone at midlatitudes, which triggers two middle–upper tropospheric wave trains propagating from midlatitude North Atlantic to Yunnan. The subtropical wave train propagates eastward along the subtropical westerly jet, and the mid–high latitude wave train follows the great circle path across Scandinavia and central Asia to the Tibetan Plateau.Both wave trains favor development of an anomalous cyclone over the southern Tibetan Plateau. The upper-tropospheric divergent condition on the southeastern side of the anomalous cyclone is dynamically conducive to locally ascending motion over Yunnan, thus producing above-normal precipitation. The opposite situation occurs in the negative SNAO phase. A coupled model reproduces well the wave train propagation and thereby confirms the positive relationship between SNAO and Yunnan precipitation in November.
Key words: summer North Atlantic Oscillation (SNAO), Yunnan precipitation, interannual variability, Rossby wave propagation
1. Introduction
Autumn precipitation in China is climatologically characterized by a remarkable peak in Southwest China,contributing more than 20% of the total annual precipitation (Bai and Dong, 2004; Wang L. et al., 2018). The strong precipitation during autumn dominates over Yunnan Province, with autumn-mean precipitation amount exceeding 80 mm month-1(Fig. 1a). The powerful southwesterlies from tropical oceans prevail in the lower troposphere over Southwest China (Fig. 1a), which transport water vapor to converge over Yunnan (Zhu et al.,2020). Furthermore, the autumn precipitation over Yunnan has considerable interannual variability, with the standard deviation mostly in excess of 20 mm month-1(Fig. 1b), accounting for nearly 25% of autumn precipitation. Since autumn is the transition season from summer to winter, precipitation deficiency often results in sustained drought into the subsequent season (Xu et al.,2016; Ma et al., 2017). In particular, Yunnan has been susceptible to recurrent drought-hit in recent decades(Wang et al., 2015b, Wang L. et al., 2018; Li et al.,2019). Such disruptive natural hazards profoundly affect agriculture production (Lu et al., 2011) and regional water resources because Yunnan is the upstream source of several large transboundary rivers including the Lancang River (Li et al., 2019). For instance, from autumn 2009 to spring 2010, Yunnan underwent record-breaking extreme drought with the precipitation deficit exceeding 50% (Zhang et al., 2013; Feng et al., 2014), which causes severe drinking water shortages, crop failures, and casualties (Lu et al., 2011; Tan et al., 2017). Hence, it is of great socioeconomic significance to investigate underlying mechanisms behind the interannual variability of autumn precipitation over Yunnan.
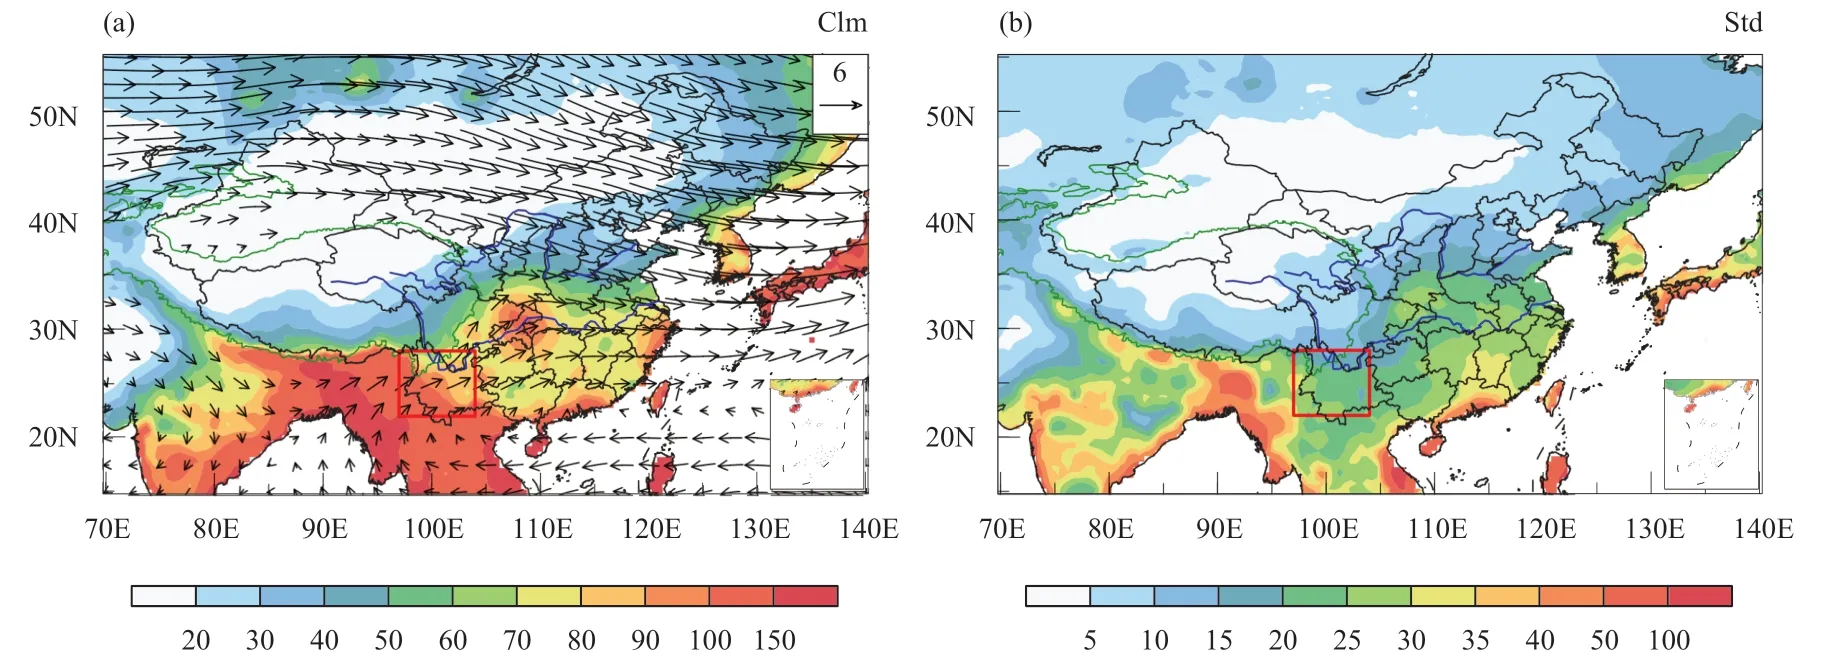
Fig. 1. (a) Climatological distributions of autumn (September–November) mean precipitation (color shading; mm month-1) and 700-hPa winds(vector; m s-1) and (b) interannual standard deviation (mm month-1) of autumn mean precipitation over China for 1958–2020. The green curve is the 2000-m terrain altitude to outline the Tibetan Plateau, the blue curve represents the Yangtze River and the Yellow River over China, and the red rectangle denotes the Yunnan domain (22°–28°N, 97°–104°E).
Previous studies have examined the impacts on interannual variability of autumn precipitation in Southwest China primarily from various tropical climate drivers.The El Niño–Southern Oscillation Modoki can reduce autumn precipitation in Southwest China through the anomalous cyclone over the western North Pacific (Zhang et al., 2013; Xu et al., 2016). The northwestern Pacific sea surface temperature (SST) affects autumn precipitation over Southwest China by modulating the western North Pacific subtropical anticyclone and local Hadley cell (Wang et al., 2015a; Ma et al., 2017). The Indian Ocean dipole can influence autumn precipitation in Southwest China by changing circulation over the Bay of Bengal (Liu and Yuan, 2006; Liu and Liu, 2016).However, little attention has been paid to the potential impacts of extratropical factors on autumn precipitation variability in Southwest China, especially over Yunnan.
The North Atlantic Oscillation (NAO) is manifested primarily as the dipolar contrast in sea level pressure(SLP) anomalies between the Azores high and the Icelandic low, especially during winter (Wallace and Gutzler, 1981). It constitutes a dominant atmospheric teleconnection pattern of variability within the extratropical Northern Hemisphere climate (Van Loon and Rogers, 1978; Jones et al., 1997), and greatly influences local weather and global climate (Hurrell and van Loon,1997). As the summertime counterpart of NAO, the summer NAO (SNAO) has a more poleward location and a smaller spatial extent than during winter (Portis et al.,2001). Some studies highlighted that SNAO, as an important upstream climate driver, can significantly affect Asian summer climate variability via quasi-stationary Rossby wave (Linderholm et al., 2011; Wang Z. Q. et al.,2018). The SNAO affects circulation over the Mediterranean Sea and Asian jet entrance region and then triggers wave train propagating downstream across Eurasia along the Asian jet waveguide (Linderholm et al., 2011,2013; Bollasina and Messori, 2018). During the positive phase of SNAO, the wave train generates anticyclonic and cyclonic flow over northern and southern East Asia,respectively. Such north–south opposite circulation produces more precipitation over Northeast Asia but less precipitation over the Yangtze River during summer, and vice versa (Wang Z. Q. et al., 2018; Wu et al., 2021).Moreover, Xu et al. (2013) suggested that SNAO can prolong its impact to the subsequent autumn through induced tripolar sea surface temperature anomalies (SSTAs) across North Atlantic. To date, it remains unclear how are the SNAO linked to the subsequent autumn precipitation variability over Yunnan. This kind of study about potential dynamics responsible for the time-lagged effects of SNAO can provide the potential for improving seasonal predictions of autumn precipitation over Yunnan.
To tackle the issue mentioned above, this study investigates the interannual impact of SNAO on the subsequent autumn precipitation over Yunnan in Southwest China and explores potential physical mechanisms. The remainder of this study is organized as follows: Section 2 introduces the data and methods. Section 3 examines the interannual relationship between SNAO and the subsequent November precipitation anomalies over Yunnan.Section 4 investigates the wave train propagation in November and its influences on Yunnan precipitation.Further, we analyze the mechanism that the air–sea interaction in North Atlantic prolongs the SNAO impacts into the subsequent November that initiates the influencing wave trains. Section 5 shows the simulated results in a coupled model to verify observational results. Section 6 presents the conclusions and discussion.
2. Data and methods
2.1 Data
To examine autumn precipitation anomalies over Southwest China associated with SNAO, the monthly land precipitation data derived from the Climate Research Unit of the University of East Anglia is used. The precipitation data has a high horizontal resolution of 0.5°latitude × 0.5° longitude and is available from 1901 to 2020 (Harris et al., 2020). To reveal SNAO-related anomalous atmospheric conditions along with air–sea interaction, the monthly meteorological variables and surface heat fluxes extracted from Japanese 55-yr Reanalysis(JRA55) data are used. The JRA55 data of a 1.25° ×1.25° horizontal resolution spans from 1958 to 2020(Kobayashi et al., 2015). Daily JRA55 data are utilized to calculate variables related to eddy-mean flow interaction.We also use the NCEP Reanalysis I (NCEP1) data (Kalnay et al., 1996) to verify results from the JRA55 data.
The monthly centennial in-situ observation based estimates (COBE) SST data at 1.0° × 1.0° horizontal resolution developed by the Japan Meteorological Agency(Ishii et al., 2005) are available from 1891 to 2020. Additionally, the Met Office Hadley Centre Sea Ice and SST(HadISST) data at 1.0° × 1.0° horizontal resolution spanning 1870–2020 (Rayner et al., 2003) and the NOAA Extended Reconstructed SST (ERSST) data at 2.0° × 2.0°horizontal resolution covering 1854–2020 (Huang et al.,2017) are applied to verify results from the COBE SST data.
To verify the mechanism relating SNAO with the subsequent November precipitation over Yunnan, we also use simulated data from the UKESM1-0-LL coupled model (UK Natural Environment Research from the Met Office Hadley Centre in the UK) (Tang et al., 2019).Tian et al. (2021) demonstrate that the UKESM1-0-LL model reproduces well the interannual precipitation over China. This study uses available variables from historical simulations (r1i1p1f2) for 1850–2014.
2.2 SNAO index
The definition mode of the NAO index can be classified into two main categories, in which the index defined based on principal component (PC) is independent of season and observing station’s location (Chronis et al.,2011). Thus, the PC-based index can better portray the SNAO that migrate-northward and has a smaller spatial extent than its winter counterparts (Hurrell et al., 2003;Folland et al., 2009; Pokorná and Huth, 2015), and is widely used in recent decades (Bollasina and Messori,2018; Wang Z. Q. et al., 2018; Liu et al., 2021). Following Hurrell et al. (2003), the SNAO is described as the first empirical orthogonal function (EOF) of SLP from June to August over the North Atlantic region(20°–80°N, 90°W–40°E). The SNAO index is defined as the normalized PC time series corresponding to the first leading EOF pattern, which can be retrieved from NCAR(available online at https://climatedataguide.ucar.edu/).
2.3 Analysis methods
2.3.1 Data treatment
All analyses are conducted on the overlapping period from 1958 to 2020, except for model data for 1958–2014 because of its limited availability period. Anomalies are constructed by subtracting the long-term climatological mean. Correlation and composite analyses are applied to examine the association of SNAO with climatic fields.The statistical significance is inferred when composite differences or correlation coefficients are significant at the 90% confidence level based on Student’st-test. The summer season refers to the average from June to August (JJA), and the autumn season refers to the average from September to November (SON).
2.3.2 Key diagnosis methods
Wave activity flux is adopted to characterize the quasi-stationary Rossby wave propagation (Takaya and Nakamura, 2001), and only the horizontal propagation of wave trains is considered. A Lanczos filter is applied to extract fluctuations with 2.5–6.0 days to retain the synoptic-scale parts of mean flow (Duchon, 1979). The maximum Eady growth rate is adopted to depict atmospheric baroclinicity instability (Eady, 1949). Synoptic-scale eddy-induced geopotential height tendency is applied to estimate the quantitative aspects of eddy-mean flow interaction. The enhanced transient eddies can induce westerly accelerations, including cyclonic (anticyclonic) forcing and negative (positive) geopotential height tendency to its north (south), and the opposite is true for the weakened transient eddies (Lau, 1988; Fang and Yang,2016). Only the tendencies associated with eddy vorticity fluxes are considered due to the stronger forcing in geopotential height (Lau and Holopainen, 1984).
3. Interannual relationship between SNAO and subsequent November precipitation anomalies over Yunnan
To examine the interannual impact of SNAO on subsequent precipitation anomalies over Southwest China,the time-lagged correlations of the SNAO index with precipitation anomalies in the subsequent autumn and months from September to November are calculated during 1958–2020. As shown in Figs. 2a–d, the statistically significant correlation in Southwest China is only observed in autumn and November. Hence, the significant correlation between autumn precipitation anomalies in Southwest China and SNAO is contributed mainly from November precipitation anomalies (Figs. 2a, d). Areas with significant positive correlation are mostly confined to Yunnan, indicating more Yunnan precipitation in autumn and November during the positive SNAO phase and vice versa. During the negative SNAO phase, insufficient precipitation and associated drier conditions increase the occurrence possibilities of meteorological droughts over Yunnan (Ma et al., 2017; Li et al., 2019).Based on Fig. 2d, we select a key domain (22°–28°N,97°–104°E) encompassing most parts of Yunnan with significant positive correlation coverage. The November precipitation index (hereafter referred to as NovPI) is defined as normalized domain-averaged precipitation time series and is used to represent the interannual variability of Yunnan precipitation.
Figures 2e and 2f show the climatology and interannual standard deviation of precipitation in November. They decrease northward and exhibit a latitudinal band over southern China around 20°–30°N. There are local maximums in both climatology and interannual standard deviation from Myanmar to Yunnan (Figs. 2e, f), indicating considerable precipitation amount and interannual variability over Yunnan. The climatological vertical integrated moisture flux from 1000 to 300 hPa primarily reveals two delivery channels of moisture flow into Southwest China (Fig. 2e). One is associated with prevailing southwesterlies along the western flank of the western North Pacific subtropical anticyclone, and the other is along the subtropical westerlies near 25°N(Fig. 2e). These two channels merge at the northern flank of anticyclone (near 95°E), as the crucial channel, facilitating moisture transport to Yunnan.

Fig. 2. Spatial distributions of time-lagged correlation coefficients of the SNAO index with the precipitation anomalies (mm month-1) in the subsequent (a) autumn season (September–November), and autumn months for (b–d) from September to November over Southwest China for the period 1958–2020 (only shown are the correlation coefficients statistically significant at the 90% confidence level). (e) Climatological distributions of precipitation (color shading; mm month-1) and vertically integrated (1000–300 hPa) moisture flux (vectors; kg s-1 m-1), and (f) interannual standard deviation of precipitation (mm month-1) in November over Southwest China. In (d–f), the red rectangle denotes the Yunnan domain used to define the NovPI.
The normalized time series of the SNAO and NovPI indices from 1958 to 2020 are shown in Fig. 3a. Both indices experience remarkably year-to-year variations across the whole period. The interannual correlation coefficient between them up to 0.32 for the total 63 years, which is statistically significant at the 95% confidence level. Therefore, the variations of these two indices are basically consistent during 1958–2020. Preceding the mid-1960s and since the early 2000s, the SNAO and NovPI indices predominantly stay a negative stage (Fig.3a). That is, the below-normal precipitation over Yunnan tends to follow the negative SNAO phase. From the mid-1960s to the early 2000s, these two indices are prevailed in the positive stage (Fig. 3a), signifying that above-normal Yunnan precipitation mainly follows the positive SNAO phase. Note that the SNAO index has remained a predominantly negative stage in recent decades(Folland et al., 2009; Liu et al., 2021), while Yunnan undergoes drier conditions (Wang L. et al., 2015b, 2018; Li et al., 2019). Afterwards, we chose 1.0 and -1.0 as the threshold of these two normalized time series and constructed differences of anomalous field between positive phase years (index ≥ 1.0) and negative phase years (index ≤ -1.0). Other thresholds are also used and overall revealed consistent results (not shown). The descriptions of anomalous fields hereinafter correspond to the positive SNAO phase, and the reverse applies to the negative SNAO phase.

Fig. 3. (a) Normalized time series of SNAO (open bars) and NovPI (solid bars) indices during 1958–2020. The number at top right is the correlation coefficient between them. The parallel dashed lines denote the threshold of one standard deviation. Composite differences of (b) sea level pressure (color shading; hPa) and 850-hPa wind (vectors; m s-1) anomalies in summer over the North Atlantic, and (c) precipitation (color shading; mm month-1) and 700-hPa wind (vectors; m s-1) anomalies in November over Southwest China between positive and negative SNAO phase years. In (b) and (c), the stippling denotes the anomalies statistically significant at the 90% confidence level. The blue vectors indicate that at least one of the anomalous zonal and meridional wind components is statistically significant at the 90% confidence level.
Figure 3b shows the composite differences of summer SLP and 850-hPa wind anomalies between positive and negative SNAO phase years. The north–south opposite pattern in SLP and low-level wind fields is the typical characteristic of SNAO (Fig. 3b). Under the positive phase of SNAO, the low-pressure anomaly representing the northern center of SNAO covers Greenland and adjacent oceans, and the high-pressure anomaly representing the southern center situates from eastern North America to northwestern Europe with a southwest–northeast orientation (Fig. 3b). Such dipolar SLP anomalies resemble the typical SNAO pattern revealed by previous studies(Hurrell et al., 2003; Folland et al., 2009). Figure 3c shows the composite differences of precipitation and 700-hPa wind anomalies in November between positive and negative SNAO phase years. The positive SNAO corresponds to anomalous cyclonic flow over Yunnan in November, with low-level southwesterlies (Fig. 3c) oriented identically to climatological moisture transport(Fig. 2e), which are favorable for precipitation increase.The significant positive precipitation anomalies mainly occur over Yunnan (Fig. 3c), basically coinciding with the spatial distribution of significant positive correlation(Fig. 2d). These further confirm the significant positive relationship between SNAO and the subsequent November precipitation over Yunnan. The opposite situation occurs in the negative SNAO phase.
4. Physical mechanisms linking SNAO to Yunnan precipitation in November
The aforementioned analyses demonstrated the significant positive relationship between SNAO and Yunnan precipitation in November. This section devotes to exploring the physical mechanisms. First, we analyzed the SNAO-related large-scale circulation conditions in November to understand the influence of anomalous circulation associated with SNAO on Yunnan precipitation.Second, we examined the Rossby wave propagation and possible sources in November to explore how SNAO-related signals propagate from North Atlantic to Yunnan that influences precipitation. Finally, we discussed how anomalous circulation in relation to SNAO induces SSTA evolution in North Atlantic from summer to November and examined subsequent atmospheric responses in November that account for initiating wave trains.
4.1 Large-scale dynamical conditions in November related to SNAO
Figure 4 shows composite differences of anomalous wind fields at 200 and 500 hPa as well as vertically integrated (1000-300 hPa) moisture flux in November between positive and negative SNAO phase years. Following a positive SNAO phase, a nearly barotropic cyclonic anomaly exists over the southern Tibetan Plateau(TP) and occupies the middle and upper troposphere(Figs. 4a, b).
The divergent southwesterlies in the upper troposphere on the southeastern side of this anomalous cyclone just prevail over Yunnan (Fig. 4a). Such upper-tropospheric divergent condition (Fig. 4a) is dynamically conducive to mid-tropospheric ascending motion locally(Fig. 4b). In addition, the southwesterly moisture transport on the southeast flank of anomalous cyclone converges over Yunnan (Fig. 4c), enhancing the southwesterly climatological water vapor transport in November(Fig. 2e). As a result, the intensified mid-tropospheric ascending motion coupled with southwesterly moisture supply provides favorable dynamic conditions for abovenormal Yunnan precipitation (Figs. 4a–c). Opposite situations occur in the negative SNAO phase.

Fig. 4. Composite differences of (a) 200-hPa divergence (color shading; 10-6 s-1) and wind (vectors; m s-1) anomalies, (b) 500-hPa vertical velocity (color shading; 10-2 Pa s-1) and wind (vectors; m s-1) anomalies, and (c) vertically integrated (1000–300-hPa) moisture flux divergence (color shading; 10-5 kg m-2 s-1) and moisture transport (vectors;kg m-1 s-1) in November between positive and negative SNAO phase years. Stippling denotes the anomalies statistically significant at the 90% confidence level. The blue vectors indicate that at least one of the anomalous zonal and meridional wind components is statistically significant at the 90% confidence level.
Notably, the horizontal wind superimposed Figs. 4a, b exhibits a nearly barotropic wave-like pattern of alternately anomalous cyclone and anticyclone stretching from North Atlantic to East Asia. The mid-tropospheric vertical velocity and upper-tropospheric divergence fields also show the wave-like pattern restricted within 20°–40°N,with the alternating occurrence of anomalous ascent–descent and convergence–divergence from North Atlantic to Yunnan (Figs. 4a, b). These wave-like structures appear to result from quasi-stationary wave propagation.
4.2 Rossby wave propagation and its possible sources
Given that the development of anomalous cyclone over the southern TP likely arises from Rossby wave propagation, Fig. 5 shows composite differences of 500-hPa geopotential height and 200-hPa meridional wind anomalies in November between positive and negative SNAO phase years. During the positive SNAO phase, a distinct Rossby wave train is observed in the subtropics–midlatitudes, characterized by alternating negative and positive anomalies of geopotential height and meridional wind from the midlatitude North Atlantic to Yunnan(Figs. 5a, b). This wave train contains a significantly anomalous cyclone over the eastern Mediterranean, sandwiched between two anomalous anticyclones over the western Mediterranean and central Asia, with two anomalous cyclones over the midlatitude North Atlantic and southern TP (Fig. 5a). Notably, the remarkably eastward wave activity fluxes emanate from the eastern North Atlantic to Yunnan and distribute along this wave train(Fig. 5a), signifying Rossby wave energy disperses downstream. This wave train propagates eastward along the subtropical westerly jet at around 20°–40°N and terminates at the eastern TP (Fig. 5b). Thus, an anomalous cyclone is developed over the southern TP (Figs. 4a, 4b,5a). Besides, another wave train can be identified to the north of the subtropical wave train (Figs. 5a, b). This mid–high latitude wave train follows a great circle path(Hoskins and Karoly, 1981) to propagate northeastward around 30°–80°N, and subsequently across Scandinavia and central Asia southeastward to the southern TP (Fig.5a). The southeastward wave activity fluxes from central Asia to the southern TP (Fig. 5a) indicate that this wave train partly contributes to the development of anomalous cyclone over the southern TP. The opposite situation occurs in the negative SNAO phase.

Fig. 5. Composite differences of (a) 500-hPa geopotential height anomalies (color shading; gpm) along with wave activity flux (vectors;m2 s-2) and (b) 200-hPa meridional wind anomalies (m s-1) in November between positive and negative SNAO phase years. In (b), the green line denotes the climatology of 200-hPa zonal wind exceeding 20 m s-1 with intervals of 5 m s-1. Stippling denotes the anomalies statistically significant at the 90% confidence level. The wave activity flux is omitted in the equatorial region (0°–15°N).
To examine the vertical structure of the subtropical wave train, Fig. 6a shows the composite differences of pressure–latitude cross-sections (20°–40°N) of relative vorticity and vertical velocity anomalies in November between positive and negative SNAO phase years. The wave train structure is manifested as the alternating appearance of anomalous positive–negative relative vorticity and ascending–descending motion. This barotropic wave train is vertically coherent and extends from the near-surface to the upper troposphere (Fig. 6a). Meanwhile, we repeat the same analyses for the NovPI. A similar wave train structure comprising alternating positive and negative relative vorticity and vertical velocity anomalies can also be observed (Fig. 6b). The wave train has a near-identical vertical structure throughout the troposphere (Figs. 6a, b) and is therefore crucial to Yunnan precipitation variability in November.

Fig. 6. (a) Composite differences of pressure–longitude cross-sections (20°–40°N) of relative vorticity (color shading; 10-6 s-1) and vertical velocity (contours with intervals of 1.0; 10-2 Pa s-1) anomalies in November between positive and negative SNAO phase years. (b) As in(a), but based on the NovPI. Stippling denotes the anomalies statistically significant at the 90% confidence level.
To further explore the possible sources of the aforementioned wave trains, Fig. 7 shows the composite differences of velocity potential and divergent wind anomalies at 200 and 850 hPa in November between positive and negative SNAO phase years. During the positive SNAO phase, the anomalous cyclone over the midlatitude North Atlantic (Fig. 5a) produces upper-level divergent flows (Fig. 7a) overlapping low-level convergent flows (Fig. 7b). The resultant upper-level divergence prevailing over the westerly jet entrance can act as the Rossby wave source (Sardeshmukh and Hoskins, 1988;Watanabe, 2004; Song et al., 2014), which then excites wave trains to propagate from North Atlantic to Yunnan(Fig. 5a). The wave trains give rise to alternating anomalous divergent and convergent flows trapped on the subtropical westerly jet (Fig. 7a). The opposite situation occurs in the negative SNAO phase. Given that wave trains are instigated by circulation anomalies over North Atlantic, we speculate that its generation is presumably associated with the underlying North Atlantic SSTA forcing.

Fig. 7. Composite differences of velocity potential (color shading;106 m2 s-1) and divergent wind (vectors; m s-1) anomalies at (a) 200 hPa and (b) 850 hPa in November between positive and negative SNAO phase years. In (a), the thick green line denotes the climatology of 200-hPa zonal wind exceeding 20 m s-1 with intervals of 5 m s-1. Stippling denotes the anomalies statistically significant at the 90%confidence level. The blue vectors indicate that at least one of the anomalous zonal and meridional wind components is statistically significant at the 90% confidence level.
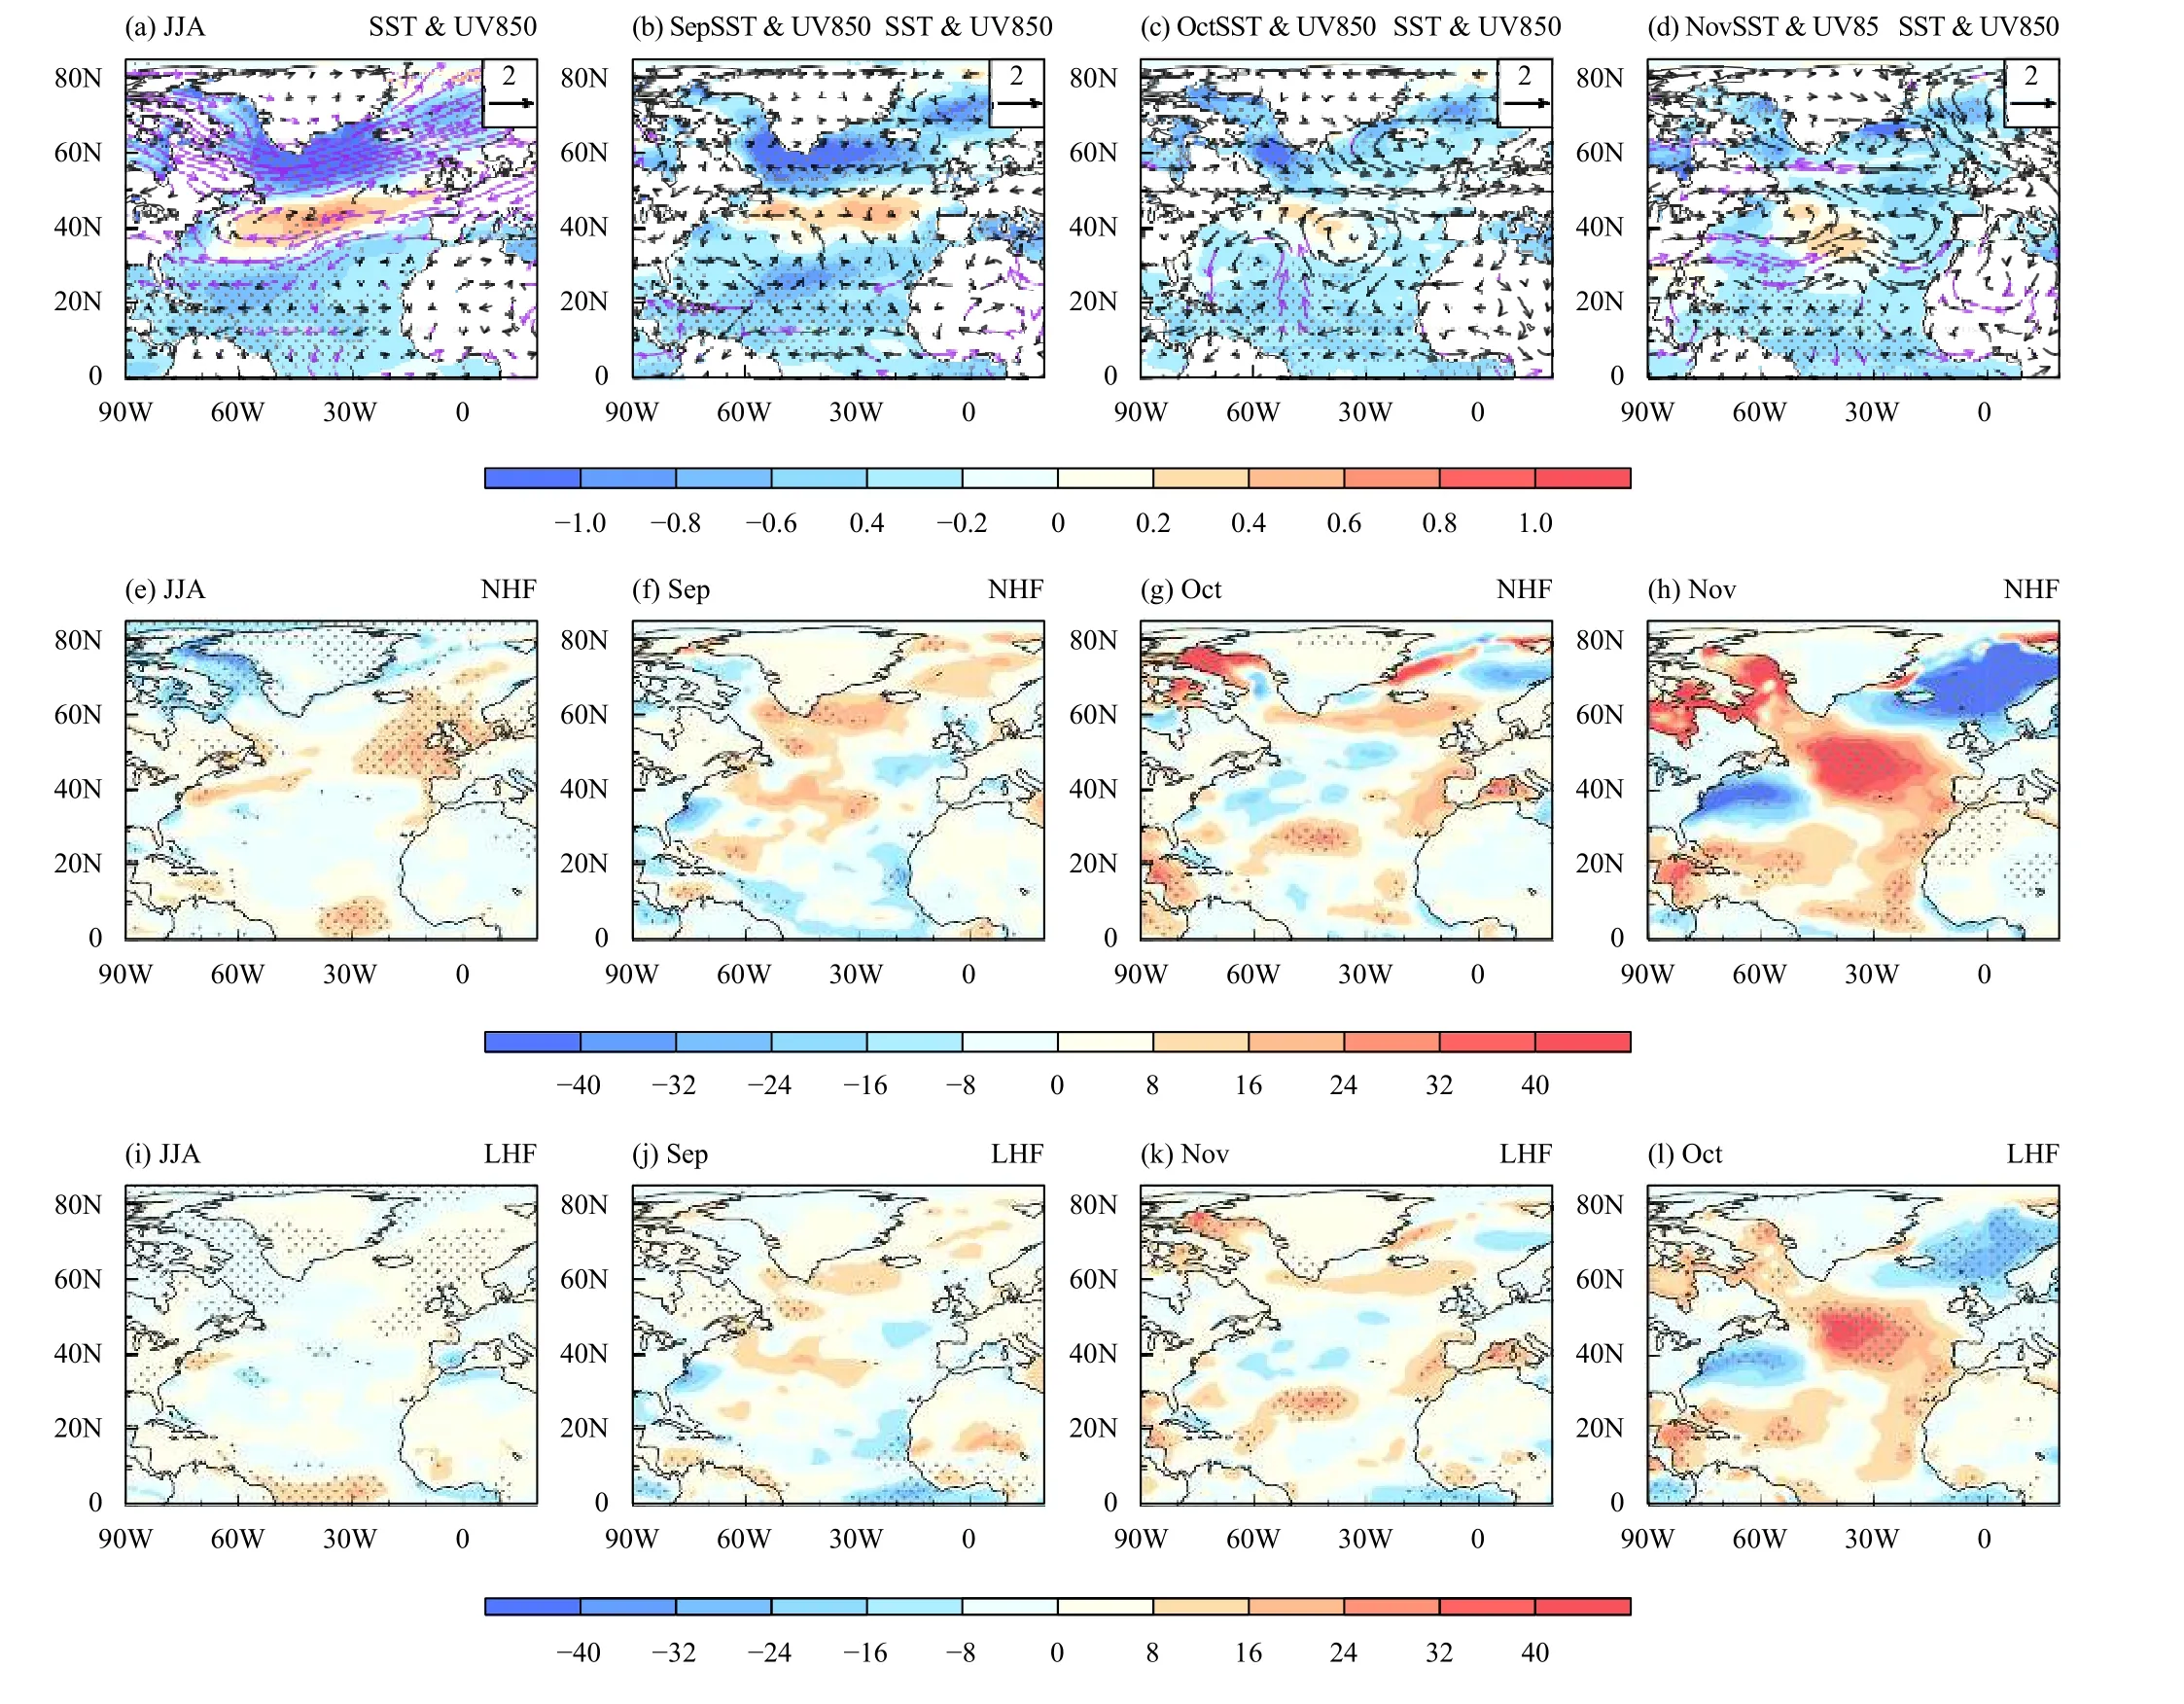
Fig. 8. Composite differences of anomalous (a–d) sea surface temperature (color shading; °C) and 850-hPa wind (vectors; m s-1), (e–h) net heat flux (W m-2), and (i–l) latent heat flux (W m-2) from summer (first column) to November (fourth column) over North Atlantic between positive and negative SNAO phase years. Stippling denotes the anomalies statistically significant at the 90% confidence level. In (a–d), the purple vectors indicate that at least one of the anomalous zonal and meridional wind components is statistically significant at the 90% confidence level.
4.3 Air–sea interaction in North Atlantic
The persistence of atmospheric motion is less than one month (Ogi et al., 2003), whereas the ocean has relatively long-term memory compared to the atmosphere due to its large thermal and dynamic inertia (Chen et al.,2019). Thus, air–sea interaction is likely to be the crucial mechanism responsible for prolonging the impact of SNAO to the subsequent November. Here, we examine how SNAO-related anomalous circulation induces the evolution of North Atlantic SSTA from summer to November and subsequent atmospheric responses to SSTA forcing in November.
4.3.1 Spatial–temporal evolution of North Atlantic SSTA forced by SNAO-related anomalous circulation
Figure 8 shows the composite differences of SST and 850-hPa wind anomalies, and net and latent heat flux anomalies from summer to November between positive and negative SNAO phase years. The downward (upward)flux anomalies are taken to positive (negative) values,contributing to surface warming (cooling). The atmospheric circulation can influence SST by changing surface latent and sensible heat fluxes, as well as shortwave and longwave radiative fluxes. The changes in net heat flux (NHF) are dominated by latent heat flux (LHF; Cayan,1992; Sun et al., 2019), whereas the other three flux terms with comparatively minor contributions will not show.
During summer, the NHF and LHF show negative anomalies poleward of 60°N and positive anomalies around 40°–60°N (Figs. 8e, i), and the sensible heat flux shows negative anomalies around 20°–40°N (not shown). These promote the formation of the SNAO-accompanied cold–warm–cold SSTA tripole pattern (Fig. 8a; Folland et al., 2009; Osborne et al., 2020). The tropics and high latitudes maintain significant negative SSTA from summer to November, with the intensity weakening over time (Figs. 8a–d). During September, the anomalous easterlies around 40°–70°N (Fig. 8b) weaken the climatological westerly wind and can suppress evaporation.The resultant downward LHF and NHF anomalies (Figs.8f, j) weaken the negative SSTA at high latitudes (Fig.8b; Hu and Huang, 2006; Chen et al., 2019). During October, the anomalous southerlies around 20°–30°N (Fig.8c) weaken the northeast trade wind and induce downward LHF and NHF anomalies (Figs. 8g, k), weakening the negative SSTA in the subtropics (Fig. 8c).
During November, the anomalous westerlies around 30°–40°N formed by tropical anticyclone and midlatitude cyclone and the anomalous westerlies on the east of Greenland (Fig. 8d) strengthen the climatological westerly wind and thus evaporation. The resultant upward LHF and NHF anomalies (Figs. 8h, l) cool the underlying SST. The anomalous easterlies north of 40°N (Fig.8d) weaken the climatological westerly wind and induce downward LHF and NHF anomalies (Figs. 8h, l), warming the SST in central North Atlantic (Fig. 8d). In this case, the summer tripolar SSTA pattern (Fig. 8a) evolves into a north-to-south SSTA pattern in November, with significant negative anomalies in the tropics and high latitudes and a small patch of insignificant positive anomalies at midlatitudes (Fig. 8d). Moreover, the internal persistence of seawater related to large oceanic heat capacity, along with Ekman transport and ocean dynamical processes, also likely contribute to the SSTA evolution from summer to November (Dong et al., 2013; Sun et al.,2019). We repeated the same analyses with HadISST and ERSST data and obtained almost identical SSTA evolution (not shown).
4.3.2 Atmospheric responses to North Atlantic SSTA forcing in November
Figures 9a and 9b show the pressure–latitude crosssections (90°–10°W) of vertical velocity and circulation anomalies, and the 500-hPa geopotential height and wind anomalies. In response to significant negative SSTA forcing in the tropical North Atlantic (Fig. 8d), the anomalous descent and anticyclonic flow appear over the tropics (Figs. 9a, b), displaying a Gill-type response (Gill,1980). Through effects on local Hadley cell, the anomalous ascent and cyclonic flow occur over midlatitude North Atlantic (Figs. 9a, b; Haarsma and Hazeleger,2007). Apart from Hadley circulation, the formulation of extratropical atmospheric structures can also result from transient eddies. Figures 9c and 9d show the 500-hPa maximum Eady growth rate and eddy-induced geopotential height tendency. The anomalous westerlies on the poleward flank of anticyclonic flow at the tropics (Fig.9b) strengthen the climatological westerly wind and easterly vertical zonal wind shear around 20°–40°N (not shown) (Dréevillon et al., 2003; Haarsma and Hazeleger,2007). These processes enhance the maximum Eady growth rate (Fig. 9c) and thus transient eddies (not shown), which generates anomalous cyclone at midlatitudes around 30°–60°N (Figs. 9b, d). For the mid- to high-latitude North Atlantic, the significant negative SSTA poleward of 60°N (Fig. 8d) can increase meridional SST and low-level air temperature gradient near 60°N(not shown). Subsequently, the enhanced maximum Eady growth rate (Fig. 9c) intensifies transient eddies, generating anomalous anticyclone south of 60°N (Figs. 9b, d).As noted above, the midlatitude anomalous cyclone (Fig.9b), induced by negative SSTA in the tropical North Atlantic jointly through Hadley cell and eddy-mean flow interaction, is crucial for initiating downstream-propagating wave trains (Figs. 5a, 7a). The high-latitude anomalous anticyclone is an intergral part of the mid–high latitude wave train (Figs. 5a, 9b).

Fig. 9. Composite differences of anomalous (a) pressure–latitude cross sections (90°–10°W) of vertical velocity (color shading; 10-2 Pa s-1) and meridional–vertical circulation (vectors; meridional wind component in m s-1 and vertical velocity component multiplied by 5000 in Pa s-1), (b)500-hPa geopotential height (color shading; gpm) along with horizontal wind (vectors; m s-1), (c) 500-hPa maximum Eady growth rate (10-2 day-1), and (d) 500-hPa eddy-induced geopotential height tendency (gpm day-1) in November between positive and negative SNAO phase years.Stippling denotes the anomalies statistically significant at the 90% confidence level. In (a, b), the blue vectors indicate that at least one of the anomalous wind components is statistically significant at the 90% confidence level.

Fig. 10. (a) Climatology (mm month-1) and (b) interannual standard deviation (mm month-1) of November precipitation in the UKESM1-0-LL model for the period 1958–2014. (c) Spatial distributions of correlation coefficients between SNAO index and the subsequent November precipitation anomalies over Southwest China in the model. (d) Composite differences of precipitation anomalies (mm month-1) over Southwest China in November between positive and negative SNAO phase years in the model. The shading in (c) and stippling in (d) denote statistical significance at the 90% confidence level. The precipitation data from the model are omitted in the oceanic region.
The tropical negative SSTA generates an anomalous cyclone at midlatitudes in November but not in September and October, presumably arising from inter-monthly differences in background states of circulation (Peng et al., 1995; Cassou et al., 2004). The warmer SST in the tropics and colder SST at midlatitudes in November(supplement Figs. s1a–e) reinforce the meridional SST gradient around 20°–40°N and thus 500-hPa westerlies(supplement Figs. s1f–j). The resultant enhanced transient eddies (supplement Figs. s1k–o) intensify the efficiency of eddy-mean flow feedback (Cassou et al., 2004;Jin, 2010). Thus, the tropical negative SSTA in relation to SNAO can induce midlatitude anomalous cyclone through eddy-mean flow interaction in November rather than September and October.
5. Model verification
The UKESM1-0-LL model data are applied to verify the aforementioned observational analyses. As shown in Figs. 10a, b, the model reasonably captures the main observed features of the climatology and interannual standard deviation of November precipitation. These features include the northward decrease and the zonal distribution around 20°–30°N in southern China, especially the local maximums over Yunnan (Figs. 2e, 2f, 10a, 10b).Additionally, significant positive correlation and positive precipitation anomalies appear over Yunnan (Figs.10c, d), indicating that more Yunnan precipitation mainly follows the positive SNAO in the model and vice versa,which agrees well with the observations (Figs. 2d, 3c).
The model reasonably simulates the climatological circulation, including sea level pressure during summer and 500-hPa geopotential height in November (supplement Fig. s2). The simulated SNAO pattern characterized by north–south oriented dipole SLP anomalies displays a spatial structure that closely resembles its observational counterpart (supplement Figs. s3). Furthermore, the model reproduces well the wave train propagation pathways instigated over North Atlantic to Yunnan in November.Two wave trains manifested as alternating negative and positive anomalies in geopotential height and meridional wind can also be captured (Figs. 5, 11). These two wave trains jointly develop an anomalous cyclone over Yunnan that influences precipitation in November, which is consistent with the diagnosed mechanisms from observations.
These model results further confirm the interannual impact of SNAO on Yunnan precipitation in November.Note that the UKESM1-0-LL model has some biases in simulating the evolution of the SST and circulation anomalies (supplement Figs. s4, 8a–d) along with wave train propagation (Figs. 5, 11). Tropical negative SSTA in the model is absent, presumably because the SNAOinduced anomalous northeasterly on the north of 30°N confine to the north of the observational counterpart(supplement Figs. s4a, 8a). The simulated SSTA can trigger two wave trains in November through the induced anomalous cyclone over the midlatitude North Atlantic(Figs. 4d, 11). The subtropical wave train is weak but the mid–high latitude wave train is strong, with both wave trains slightly north of that observed (Figs. 5, 11). Despite the simulated biases, two wave trains can propagate to Yunnan and form an anomalous cyclone that influences precipitation (Fig. 11), implying that the model results still support the observations at a large extent.

Fig. 11. As in Fig. 5, but based on the UKESM1-0-LL model during 1958–2014.
6. Conclusions and discussion
This study investigates the interannual relationship between SNAO and the subsequent November precipitation anomalies over Yunnan and explores physical mechanisms based on JRA55 reanalysis and the UKESM1-0-LL model data from 1958 to 2020. The major results are summarized as follows:
The interannual variations of SNAO correlate positively with those in the subsequent November precipitation over Yunnan for 1958–2020, with their correlation coefficients of 0.32 being significant at the 95% confidence level. Thus, the above-normal precipitation over Yunnan in November mainly occurs in the positive SNAO phase, and vice versa. Through changes in surface heat fluxes, the positive SNAO induces a tripole SSTA pattern across North Atlantic, in which the positive SSTA at midlatitudes weakens from summer to November while significantly negative SSTA in the tropics can persist into November. Such tropical negative SSTA in November subsequently generates an anomalous cyclone over midlatitude North Atlantic jointly through Hadley cell and eddy-mean flow interaction. The upper-level divergence produced by this anomalous cyclone can act as a key wave source, which stimulates two wave trains in the middle and upper troposphere propagating from midlatitude North Atlantic to Yunnan.The subtropical wave train propagates eastward along the subtropical westerly jet and terminates at the eastern TP,and another mid–high latitude wave train propagates along a great circle path northeastward across Scandinavia and Central Asia and then southeastward to the southern TP. These two wave trains together develop an anomalous cyclone over the southern TP. The upper-tropospheric divergent environment on the southeast flank of anomalous cyclone dynamically reinforces mid-tropospheric ascending motion over Yunnan, coupled with intensified southwesterly water vapor transport, leading to more precipitation in November. The opposite occurs in the negative SNAO phase. The coupled model captures well the wave train propagation stemming from North Atlantic to Yunnan in November, which enables the model to successfully reproduce the positive relationship between SNAO and the subsequent November precipitation over Yunnan.
In this study, the atmospheric circulation anomalies do not match fully with the SSTA evolution in North Atlantic (Figs. 8a–d), which is likely attributed to the limitation of observational data, including atmospheric and SST data are obtained from different data sources.Moreover, the current climate models still have biases and uncertainties in describing air–sea interaction in the North Atlantic region (Zhou, 2019). Hence, the observed mechanism underlying the air–sea interaction in this study remains to be further improved with more reliable data and further validated with reasonably designed numerical experiments. In addition to the SSTA signal, the soil moisture over the Tibetan Plateau has a long memory effect equally (Seneviratne et al., 2010) that may also aid in prolonging the SNAO impact to the subsequent November. Previous studies indicated that SNAO significantly influences summer precipitation over the Tibetan Plateau (Wang et al., 2017, 2018), which may further induce anomalous soil moisture (Yuan et al., 2021). The soil moisture anomalies can persist for serval months and thus regulate subsequent atmospheric circulation and climate through the impact on surface energy exchange(Seneviratne et al., 2010; Yang and Wang, 2019). Accordingly, the possible contribution of soil moisture to the time-lagged effect of SNAO on Yunnan precipitation in November needs to be further investigated.
This study focuses on the impact of SNAO on Yunnan precipitation in November. Such impact may result from the joint role of SNAO and other factors such as El Niño–Southern Oscillation (Zhang et al., 2013) and Indian Ocean dipole (Liu and Liu, 2016). Further investigations are needed to eliminate the impact of other factors to highlight the independent contribution of SNAO on the interannual variability of autumn precipitation over Yunnan. Aside from the interannual variation, Fig. 3a shows that the SNAO and Yunnan precipitation in November display an interdecadal variation. The interdecadal variation exhibits a roughly negative–positive–negative phase switch (Folland et al., 2009; Li et al., 2019). Thus,future studies should pay attention to the underlying interdecadal relationship of SNAO with Yunnan precipitation in November and relevant climatic mechanisms.
杂志排行
Journal of Meteorological Research的其它文章
- Progress and Prospects of Research on Subseasonal to Seasonal Variability and Prediction of the East Asian Monsoon
- An Empirical Model of Tropical Cyclone Intensity Forecast in the Western North Pacific
- Intensified Impact of the Equatorial QBO in August–September on the Northern Stratospheric Polar Vortex in December–January since the Late 1990s
- Stochastically Perturbed Parameterizations for the Process-Level Representation of Model Uncertainties in the CMA Global Ensemble Prediction System
- Assimilation of All-Sky Radiance from the FY-3 MWHS-2 with the Yinhe 4D-Var System
- Direct Radiative Effects of Dust Aerosols over Northwest China Revealed by Satellite-Derived Aerosol Three-Dimensional Distribution