Simulation Study on the Interannual Variation of the Transport and Distribution of Chub Mackerel (Scomber japonicus) Larvae and Juveniles Using Individual-Based Model
2022-10-24YUWeiFENGZhipingPANLingzhiGUANWenjiangZHANGYuandLIYuesong
YU Wei, FENG Zhiping, PAN Lingzhi, GUAN Wenjiang, ZHANG Yu , and LI Yuesong, *
Simulation Study on the Interannual Variation of the Transport and Distribution of Chub Mackerel () Larvae and Juveniles Using Individual-Based Model
YU Wei1), 3), 4), 5), FENG Zhiping1), PAN Lingzhi2), GUAN Wenjiang1), 3), 4), 5), ZHANG Yu1), 3), 4), 5), and LI Yuesong1), 3), 4), 5), *
1)College of Marine Sciences, Shanghai Ocean University, Shanghai 201306, China 2) East China Sea Forecast Center, State Oceanic Administration, Shanghai 200081, China 3) National Engineering Research Center for Oceanic Fisheries, Shanghai Ocean University, Shanghai 201306, China 4) Key Laboratory of Sustainable Exploitation of Oceanic Fisheries Resources, Ministry of Education, Shanghai Ocean University, Shanghai 201306, China 5) National Engineering Research Center for Oceanic Fisheries, Shanghai Ocean University, Shanghai 201306, China
An individual-based model ofin the East China Sea (ECS) was developed to simulate the effects of physical environment on the transport and distribution of eggs, larvae and juveniles offrom 1978 to 2013. The results showed that there were interannual differences in the transport and distribution of eggs, larvae and juveniles ofin the ECS due to different physical environments from 1978 to 2013, and this difference was extremely obvious in some specific years. The current in the drift path of eggs and juveniles controlled and affected the transport process and distribution characteristics. In April, the distribution of eggs and larvae was mainly controlled by the Taiwan Warm Current (TWC). The number of eggs and larvae transported into the northeastern waters of the ECS was positively correlated with the intensity of TWC. In May, it was mainly regulated by the TWC and the Tsushima Strait Warm Current (TSWC). In June, the number of larvae and juveniles entering the Tsushima Strait and the Pacific Ocean was determined by the TSWC. In general, in the years with high number of larvae and juveniles into the Tsushima Strait, the catch of 0-year-oldwas also higher. In addition, the number of larvae and juveniles entering the Tsushima Strait in El Niño years was less than that in La Niña years. In July, the transport was mainly controlled by the Kuroshio Cur- rent (KC), and the eddy within the KC strongly affected its distribution.
individual-based model;; transport and distribution; Taiwan Warm Current; Tsushima Strait Warm Current; Kuroshio Current
1 Introduction
Understanding the relationship between marine species especially economically important pelagic fish species and climatic and environmental variability is beneficial to sus- tainable exploitation and effective fisheries management(Brander, 2010). For most marine species, the whole life stage including egg, larvae, juvenile, subadult and adult is sensitive to climate-driven changes in biological and phy- sical environments surrounding their habitats (Hansen., 2001; Lien., 2014). Variations in environments at dif- ferent spatio-temporal scales will lead to significant changes of fish growth, mortality, migration, distribution and stock biomass (Lan., 2013). These factors directly impact fish abundance and distribution and the catch and fish- eries economy across years. At present, most studies ex- ploring the environment-related marine species abundance and distribution variability focus on their adult stages. For example, the neon flying squidand Pacific sauryin the Northwest Pacific Oceanhave strong linkage with the Kuroshio and Oyashio Cur- rents, sea surface temperature (SST), sea surface height (SSH) and chlorophyll-concentration (Chl) (Yu., 2015; Igarashi., 2017; Hua., 2020). In the South-east Pacific Ocean, the upwelling system as well as ver- tical water temperature, sea surface salinity (SSS), net pri- mary production (NPP) play an important role in regulat- ing the dynamics of jumbo flying squidand jack mackerel(Waluda., 2006; Li., 2016).
It is well understood that the number and survival rate of fish eggs, larvae and juveniles are the basis for the re- cruitment of fish populations (Coombs., 1990). Fish eggs, larvae and juveniles are the most vulnerable stages in the fish life cycle (Hovenkamp and Witte, 1991). They can drift with ocean currents and are sensitive to the ma- rine environment, which poses a significant impact on the development, growth and population recruitment (Bartsch., 2010). At these stages, the survival rate and the re- cruitment level determine the abundance of fish. Different environments encountered by fish eggs, larvae and juve-niles during the transport ultimately affect the growth, death and recruitment of fish (Soto-Mendoza., 2012). There- fore, explore the responses of the early life stage of fish species with relatively poor swimming ability to physi- cal environments (particularly the currents) are very criti- cal to understand the variability in the fish recruitment.
Chub mackerel() is an economical- ly and ecologically important pelagic fish species, which is widely distributed in the Pacific, Atlantic and Indian Oceans (Hiyama., 2002). This species is also abun- dant in the East China Sea (ECS) and the Sea of Japan including the Tsushima Current (TS) stock and the ECS stock (Li., 2008). With the decline of the traditional demersal fishery resources in the coastal waters of China, the position ofin national marine fisheries of China has become more and more important in recent years. At present,is regarded as one of the main com- mercial fishing targets in Mainland China (Li and Chen, 2007; Gao., 2015).
The eggs, larvae and juvenile stages ofare planktonic in oceans. These stages are the most vulnerable periods in its whole life cycle. The ocean current deter- mines the transport and distribution of the eggs, larvae andjuveniles (Li., 2012). Fig.1 shows the transport of eggs, larvae and juveniles of the Tsushima Strait Warm Current (TSWC) population of. The blue area in the northeastern waters of Taiwan is an important spawningground of the Tsushima Strait populations. They spawn on the spawning ground since March (Sassa and Tsukamo- to, 2010). Eggs and larvae are distributed between the Ku- roshio Current (KC) and the Taiwan Warm Current (TWC). At the same time, they are transported into the northeas- tern waters with the influences of ocean currents. When transporting to the sea off the Kyushu Island in the north- eastern waters, the larvae and juveniles are divided into two parts. One part is transported to the Japan Sea with the TWC, and the other part is transported to the Pacific Ocean with the KC (Li., 2014a). Overall, the recruit- ment and abundance ofare mainly determined by physical environment.
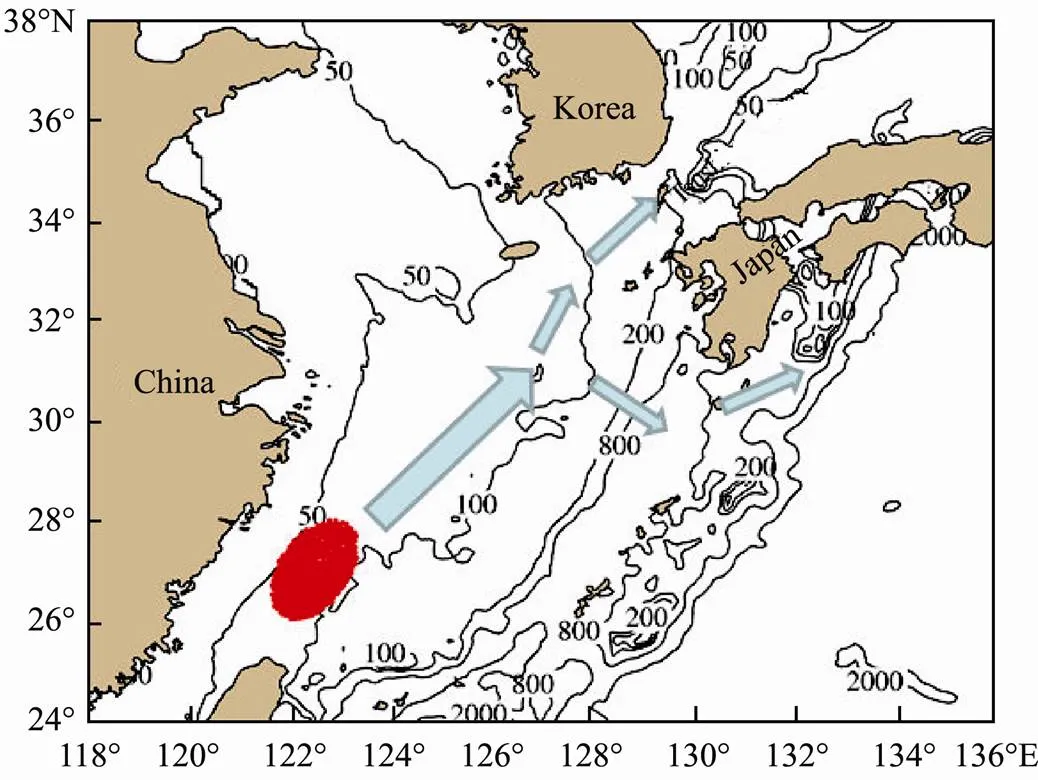
Fig.1 Transport of eggs, larvae and juveniles of chub mac- kerel Scomber japonicus.
The individual-based model (IBM) is based on indivi- dual or spatial unit, which describes the characteristics and behaviors of individuals based on specific equations of ma- thematical physics, and studies their temporal evolution and spatial movement to obtain the spatial-temporal pat- tern of the system (Chen and Li, 2012). In the past decade, IBM was considered as a very useful method to study the early life history and population dynamics of fish (Bar- tsch and Coombs, 2004; Wang., 2013). This model was mainly used to study the drift trajectory of early lar- vae and the scientific problems of connectivity and recruit- ment. Previous studies have used IBM to build an ecolo- gical model in the early growth period ofin the ECS and perform analysis on the transport, connecti- vity, recruitment, and fishing ground formation oflarvae and juveniles in the ECS (Li., 2012, 2014a). The drifting paths in the early life stages ofin the ECS were found. The KC, the TWC and the TSWC controlled the transport of eggs and larvae in the southern spawning ground of the ECS. However, it does not involve the study of the impacts of interannual varia- tion of physical environments combined with meso-scale climate variability such as the El Niño and La Niña events on the transport and distribution ofin the ECS.
In this study, for the purpose of laying the foundation for in-depth study of the response relationship between clima- tic and physical environmental changes and variations inpopulations at a yearly time scale, this study si- mulated the interannual variation in the transport and dis- tribution oflarvae and juveniles in a long- term period based on the individual-based ecological model of ECSstock during the early life stages, and identified the different dynamic factors affected the changes in the transport and distribution.
2 Materials and Methods
2.1 Model Description
This study adopted an individual-based ecological mo- del for the ECSstock in the early growth pe- riods, which included two components: a physical ocean model and a biological model (Li., 2014a). The finite- volume coastal ocean model for global (FVCOM-Global) conditions was a spherical coordinate ocean model that coupled the ocean and sea ice (Chen., 2016). This model could solve the problem so that the regional model could not simulate the effects of climate change on re- gional circulation in KC areas. Its calculation area included the global oceans and major rivers. The model grid’s mini- mum horizontal resolution was about 50km inside the ocean and up to 2km near the coast. The horizontal resolution in the ECS was increased to 300m, driven by tide, wind and heat flux power (Chen., 2008). This model was used to simulate and generate three-dimensional flow, tempera- ture-salinity and turbulent diffusion coefficient fields from 1978 to 2013. Previous study suggested the El Niño and La Niña events were related to the population dynamics ofin the ECS (Yu., 2018). Thus, the re- lationship between this phenomenon and the number of lar- vae and juvenile was evaluated by correlation analysis. TheSST anomaly in the Niño 3.4 region could define the El Niño and La Niña events, the data over 1978–2013 were obtained from the IRI/LDEO Climate Data Library from the website: http://iridl.ldeo.columbia.edu/SOURCES/.In dices/.nino/.NCEP_OIv2/.NINO34/.
The biological model was mainly used to simulate the hatching, growth and death ofthrough para- metric methods (Li., 2012, 2014a). In the biological model, we set the number of adult female(107) on the spawning ground and allowed for 6 batches of spawn- ing between March and June. Eggs were released in a nor- mally distributed pattern around 10m water depth (Hun- ter and Kimbrell, 1980). Super-individual technology was used in the model. When the total number of eggs releasedin the grid exceeded 5×10⁸, a super-individual was produced.There were 1165 super individuals, representing 3.297× 10¹²eggs in the model. According to the age and length, theearly growth stage ofwas divided into fivegrowth stages, including eggs, early larvae, larvae, early ju-veniles and juveniles (Matsuura and Hewitt, 1995). The in- cubation time of eggs and metamorphosis time of larvae was a function of water temperature, and the growth of in- dividual larvae was a function of water temperature and food. The mortality is a function of length and growth rate. The detailed construction and the parameterization processes of the biological model were all described previously (Li., 2012; 2014a).
2.2 Model Setting
The basic design process of the physical-biological coup-ling model included the following steps: 1) definition of in-dividual organisms and assignment of every super indivi- dual to state variables (.., length, location and age) and behavior rules (.., growth, spawning, hatching and mor- tality); 2) input of the physical environment and loading of the hourly physical environmental variables into the pro- gram according to the spatial-temporal requirement; 3) exa- mination of the physical-biological effects through coup- ling the physical and biological models based on the La- grangian particle tracking method. In this process, eggs and larvae interacted with the environment during the passive drift, which influenced their developments (.., growth and death); 4) the development of a loop, which simulated the spawning ofin the middle of March and de- velopment into juveniles by the end of July. The state of the physical environment and the individual variables were up-dated in every loop yielding an output and statistics of every 12h.
The biological model was driven by the physical field from 1978 to 2013, simulating the transport and distribu- tion oflarvae and juveniles in the ECS in 36 years and studying the influences of the dynamics of the physical environment as a changing factor on the transport and distribution.
3 Results
3.1 Distribution of S.japonicus Eggs and Larvae in April
April was the peak period ofspawning. In the model, as the number of eggs increased, the number of super individuals drifting to the northeastern waters also increased. Owing to the difference of the physical environ- ment, the transport and distribution of fish eggs, larvae and juveniles were different at the end of April. Fig.2 show- ed the transport and distribution ofeggs and larvae at the end of April in 1982 and 2012. Eggs and lar- vae ofat the end of April in the two years showed a large spatial difference in both transport dis- tance and distribution pattern. In 1982, most of the eggs and larvae with a shorter transport distance were mainly distributed in the ECS to the south of 30˚N and west of 126˚E (Fig.2A). The longer transport distance in 2012 was distributed in a belt to the northeast part. The larvae and juveniles were transported to the waters of Kyushu Island, Japan (Fig.2B) as the farthest location, and started to en- ter the Tsushima Strait and the Pacific Ocean.
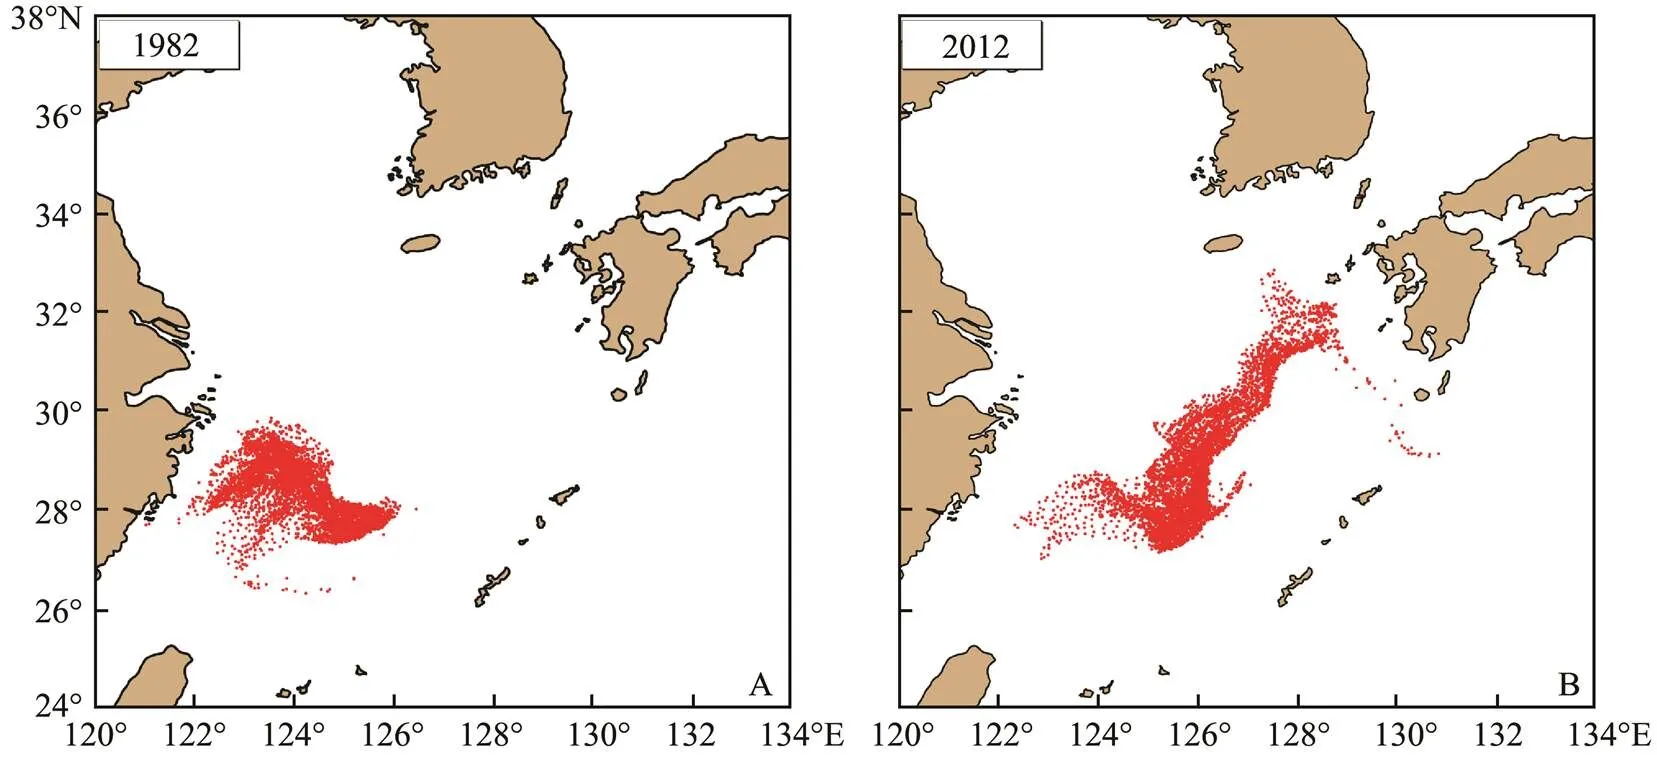
Fig.2 Distribution of S. japonicus eggs and larvae at the end of April in 1982 (A) and 2012 (B).
Since the adult femalespawned at the end of Marchin succession, it reached the peak spawning pe- riod in early April, and the eggs and larvae were in the control area of the TWC during this period. Fig.3 showed the velocity distribution in April 1982 and 2012. The in- fluence of the TWC was relatively weaker in 1982 (Fig.3A),while it was relatively stronger in 2012 (Fig.3B). If the TWC was very weak in April,eggs and lar- vae were slowly transported into the northeastern waters, and a large number of eggs and juveniles were gathered in the waters near the spawning ground (Fig.2A). If the TWCin April of that year was very strong, eggs and larvae drift- ed away from the spawning ground with the strong TWC and were quickly transported to the northeast part (Fig.2B).Therefore, the strength of the TWC in April determined the transport and distribution characteristics ofeggs and larvae in this stage.

Fig.3 The velocity of Taiwan Warm Current (TWC) in April 1982 (A) and 2012 (B). The red box denotes the TWC.
Fig.4 showed the correlation between the number ofeggs and larvae that drifted into the northeast part of the ECS at the end of April (to the north of 29˚N and east of 125˚E) and the average velocity of the TWC in April. Between 1978 and 2013, the number of eggs and larvae transported to the northeastern waters was higher in years with stronger TWC in April (Fig.4). A significantly positive correlation was found between the intensity of the TWC in April and the number of fish eggs and larvae transported to the northeast waters (=0.8007) (Fig.4). In April, the transport and distribution ofeggs and larvae in the ECS were controlled by the TWC.

Fig.4 Relationship between the number of fish eggs and larvae transported to the northeast part of the East China Sea and Taiwan Warm Current in April during 1978–2013.
3.2 Transport and Distribution of S. japonicus Eggs, Larvae and Juveniles from May to June
With the end of spawning in May, the number of super individuals in the model did not increase. At this time, most of the larvae were transported to the waters near Kyu-shu Island, Japan. They were divided into two groups in succession since June. The TSWC transported one group to the Tsushima Strait, which entered the Japan Sea. The other group was quickly carried by the KC into the Paci- fic Ocean. Fig.5 showed the transport and distribution of two years with a larger difference in June. After most of the larvae were transported to Kyushu Island in Japan in June 2011, they were transported with the mainstream of KC to the Pacific Ocean, while no larvae were transport- ed to the Tsushima Strait. On the contrary, most larvae were transported to Kyushu Island, Japan, and then transported to the Tsushima Strait with the Tsushima Warm Current in 1999. Almost no larvae were transported to the Pacific Ocean by the mainstream of KC.

Fig.5 Distribution of larvae in June 2011 (A) and 1999 (B).
Fig.6 showed a comparison of the TSWC’s average ve- locity in June 2011 and 1999. TSWC in 2011 was very weak (Fig.6A), while the TSWC in 1999 was very strong (Fig.6B). Larvae were transported to the vicinity of Kyu- shu Island in June. The TSWC flowing northward in June affected the distribution characteristics of larvae. If the TSWC was weak in June, the larvae were slowly trans- ported northward. The number of larvae entering the Tsu- shima Strait was relatively smaller, while the number of lar- vae entering the Pacific Ocean with the KC was relatively larger (Fig.5A). If the TSWC was very strong in June of the same year, the larvae were quickly transported north- ward under the strong TSWC. The number of larvae enter- ing the Tsushima Strait was larger, while the number enter- ing the Pacific Ocean was smaller (Fig.5B). Therefore, the TSWC’s strength in June determined the transport and dis- tribution characteristics ofeggs and larvae in the early stage.

Fig.6 Velocity of Tsushima Strait Warm Current (TSWC) in June 2011 (A) and 1999 (B). The red box is the Tsushima Strait.
Fig.7 showed the correlation between the average TSWCvelocity and the number of larvae entering Tsushima Strait from 1978 to 2013 in June. From 1978 to 2013, in years with the high velocity of the TSWC in June, the number of larvae entering in the Tsushima Strait was relatively lar- ger (Fig.7A). The intensity of the TSWC in June had a high- lypositive correlation with the number of larvae and juve- niles transported to the Tsushima Strait. The correlation coefficient (2)was 0.7844 (Fig.7B). Therefore, the tran- sport and distribution of larvae and juveniles in June were controlled by TSWC.
May was the period when most larvae and juveniles were transported from the northeast part to the Tsushima Strait. The transport and distribution of larvae and juveniles in May were jointly controlled by the TWC and the TSWC. The percentage of larvae and juveniles entering Tsushima Strait from May to June was determined by the TSWC, which controlled the transport and distribution of larvae and juveniles in June.
The larvae and juveniles entering the Japan Sea through the Tsushima Strait were part of the fishing yield of Japa- nese fisheries. Fig.8 showed the relationship between the number of larvae and juveniles entering the Tsushima Strait at the end of June and the catch of 0-year-old fishin Japan. From 1978 to 2013, when more larvae and juveniles en- tered the Tsushima Strait, the catch of 0-year-old was also relatively higher. There was a certain correlation between the two phenomenons, but there were also some abnormal cases in some years. For example, the number of larvae was high in 1994, however, the catch was low. According to the analysis, it might be caused by the recruitment of other spawning grounds or the randomness of fishing.
Fig.7 Relationship between the number of larvae entering Tsushima Strait Warm Current and the mean velocity of the current in June during 1978–2013.
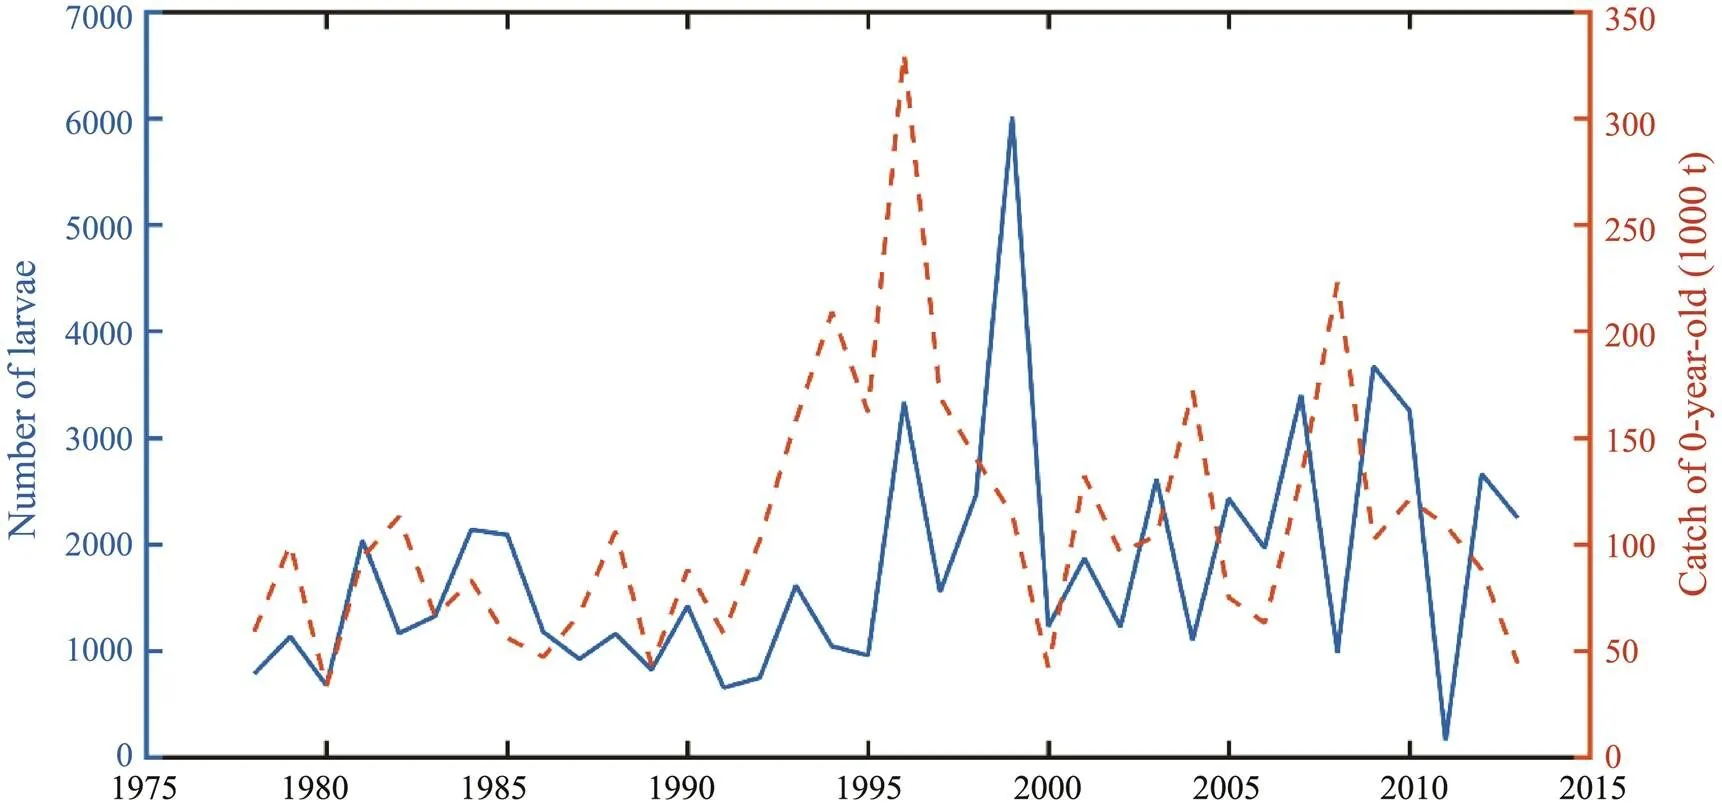
Fig.8 Relationship between the number of larvae entering Tsushima Strait and catch of 0-year-old in June during 1978–2013.
Fig.9 showed a significant positive relationship betwe- en the number of larvae and juveniles out of Tsushima Strait and the anomaly of water temperature in the Niño 3.4 re- gion at the end of June during 1978–2013 on the basis of correlation analysis (2=0.620,<0.05). There were more larvae and juveniles out of Tsushima Strait when the wa ter temperature in the Niño 3.4 region increased and de- creased in years when the water temperature in the Niño 3.4 region decreased. However, there was also a mismatch in some years such as in the year of 2011 due to the very complicated relationship between them.
3.3 Transport and Distribution of S. japonicus Eggs, Larvae and Juveniles in July
In July, the larvae and juveniles were mainly distribu- ted in two parts. One part of the larvae and juveniles was mainly held by the KC, which quickly bypassed the Kyu- shu Island and transported into the Southwest Japan of the Pacific Ocean. The other part was affected by the TSWC andentered the Japan Sea. However, the simulation found that there were also many larvae and juveniles distributed in the waters of the Ryukyu Islands in some years. As shown in Fig.10A, in July 2003, when the larvae and juveniles were bypassing the Kyushu Island, the eddy in the south- eastern waters of the Kyushu Island transported larvae and juveniles to the waters of the Ryukyu Islands (Fig.10C). Larvae and juveniles gathered in the specific sea area for a long time (Fig.10A). The larger the eddy was, the more the larvae and juveniles distributed, and the greater the obsta- cle to their transport to the Pacific Ocean with the KC. In some years, they gathered in the Pacific Ocean. As shownin Fig.10B, an eddy appeared at the KC in 2005 (Fig.10D), which impeded the larvae and juveniles from being con- tinuously transported, causing them to gather within the eddy. Therefore, the distribution characteristics of larvae and juveniles in July were greatly affected by the KC and the eddy.
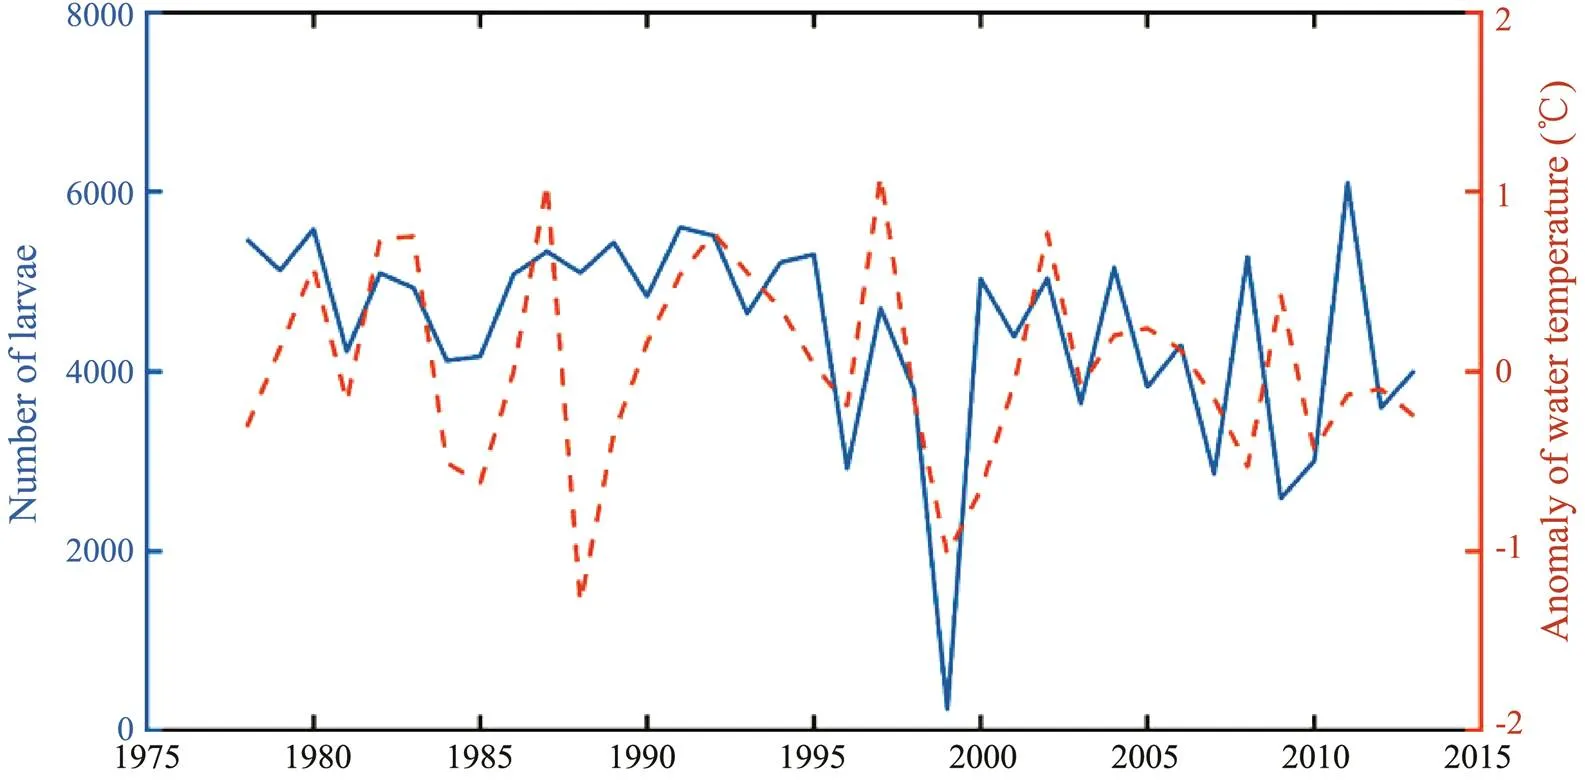
Fig.9 Relationship between the number of larvae out of Tsushima Strait and the anomaly of surface water temperature in the Niño 3.4 region in June during 1978–2013.

Fig.10 Distribution of larvae and juveniles and eddy of the Kuroshio Current in July in 2003 and 2005.
4 Discussion
4.1 FVCOM and Its Applications
In this study, the physical ocean model (FVCOM-Glo- bal) provided a reliable environmental background to simu- late the transport path ofeggs, larvae and ju- veniles in the early life stages. The computational domain of the regional model from the global model covered the entire ECS, the Yellow and Bohai Seas, Japan Sea and parts of the Northwest Pacific Ocean. The non-overlapped tri- angular mesh in the model could provide increased reso- lution of complex irregular coastal geometry and steep bot- tom topography in the study area (Chen., 2012). More- over, the volume-conservative, finite-volume algorithm in which mass conservation was prerequisite made this phy- sical biological coupling model suitable for biological app- lications (Li., 2014a). Many studies have successful- ly applied the FVCOM model to explore the mechanism of fish dynamics in relation to physical environments (Yu., 2017). One of the famous application studies was that the FVCOM team had ever simulated the dispersal and settle- ment of sea scalloplarvae spawn- ed in a closed area on Georges Bank and modeled the con- nectivity between sea scallop populations in the Middle Atlantic Bight and over Georges Bank (Tian., 2009, 2010). Because of the inability to move actively, sea scal- lop can only move with the regional circulation, verticalstratification and mixing, leading to spatial and temporalvariations in abundance and fishing ground distribution andultimately the fisheries. These findings help understand how the sea scallop larvae responded to physical environments and explore the potential fishing ground for sea scallop. In addition, Boucher. (2013) examined impacts of in- terannual environmental variability on the transport-reten- tion dynamics in haddocklar- vae on Georges Bank based on IBM and FVCOM modes. In the preset study, the analysis did not include the valida- tion of the physical ocean model to avoid the repeated work.Because the simulated currents, water temperature, salini- ty, tidal and other factors in the model were carefully ve- rified by comparing to the observed currents, Argo data ad CTD profiles (Li, 2012). It should be noted that there were some uncertainties in the results of the model. For example, the model development did not include climatic factors, it might cause some biases.
4.2 Transport and Distribution Patterns of S. japonicus from April to July
For ECSstock, the recruitment from thespawning ground on the coastal waters of Zhejiang was critical for the adultbiomass. Therefore, how to set the parameters on the spatial location of the spawn- ing ground could induce large uncertainties in the model outputs. In the biological model, the depth of the spawn- ing ground was set as 10m. In general,spawn- ed at depths from 0m to 30m based on scientific investi- gation of the eggs (Hunter and Kimbrell, 1980; Matsuura and Hewitt, 1995). The eggs and larvae spawned at diffe- rent depths played very limited roles in the transportation and distribution (Li., 2013a). However, due to the mi- nor changes of the temperature and food availability be- tween different water layers, the growth and mortality en- countered strong differences. Previous studies proved that the mortality ofsignificantly increased at depthsof 5m and 15m, but was the lowest at 10m (Li., 2013a).Thus, the depth at 10m was chosen as the specific para- meter of water layer. Additionally, spawning location had a significant effect on larvae transport. A comparison based on model simulation was previously performed to exam- ine the impacts of spawning location by setting three sce- narios (normal spawning ground, western spawning ground and eastern spawning ground). Survival and growth ofwas the highest at the normal spawning loca- tion due to the suitable water depths and temperatures du- ring transport (Li., 2014b).
During 1978 and 2013, due to differences in the phy- sical environment, there was an interannual difference in the transport and distribution patterns of eggs, larvae and juveniles ofin the ECS from year to year by comparing the years with extremely large differences. Es- pecially in some specific years, this difference was much greater. Overall, the ocean currents controlled and affect- ed the transport process and distribution characteristics ofin the early life stages, this result was con- sistent with the dispersion pattern oflarvae under climatological spring-summer temperature and cir- culation conditions from Li (2012). Our findings clarified the driving factors controlling transportation from April to July between different years. In April, the transport and dis- tribution ofeggs and larvae was mainly con- trolled by the TWC. There was a positive correlation be- tween the number ofeggs, larvae and juve- niles transported to the northeast of the ECS and the in- tensity of the TWC. In May, it was mainly controlled by the combination of the TWC and TSWC. In June, the num- ber of larvae entering the Tsushima Strait and the Pacific Ocean was determined by the TSWC, and the number of larvae entering the Tsushima Strait had a certain relation- ship with the catch and the anomaly of surface water tem- perature in the Niño 3.4 region. In July, its distribution was mainly controlled by the KC, and the eddy on the KC had a greater influence on its transport and distribution. The difference in transport and distribution had an impact on the growth, survival and the population recruitment ofeggs, larvae and juveniles in the ECS.
However, it should be pointed out that the complexity of the hydrological conditions in the ECS showed huge spatial and temporal differences. Some physical mecha- nisms could not be simulated and determined, resulting in the inability to characterize their impacts on transport and distribution. Thus, a physical model with higher resolution and accurate turbulence simulation was necessary. Addi- tionally, the biological model considered in the model only included the spawning process, the growth, mortality, preyand predator relationship and swimming behavior were not considered (Li., 2012, 2013a, 2013b). Future studies will include the more biological processes ofstocks coupling with the ocean model.
4.3 Climate Variability Impacts on S. japonicus Stock
Climate variability such as the El Niño and La Niña events had strong impacts on habitat patterns ofstock in the ECS during its adult stage (Dabin., 2018). Some studies concluded that the El Niño and La Niña events with various intensities may result in differ- rent variations in the habitat suitability of. The moderate El Niño event was favorable for yielding relatively high-qualityhabitats in the ECS comparing to the strong El Niño events (Yu., 2018). While the impacts of La Niña event were complicated, it depended on the local environmental conditions (Guan., 2011, 2013; Yu., 2018). Comparing the El Niñowith La Niña events in some specific years (2007 and 2015), studies showed that the catch, fishing effort, CPUE (catch per unit effort) and habitat suitability of ECSstock in the La Niña year (2007) was higher than those in the El Niño year (2015) (Lu., 2021).
In the early life stages ofstock, only one study ever investigated the impacts of anomalous environ- ments (typhoon) on the transport and survival oflarvae. The typhoon Alice occurred in 1961 strongly affected the movement path oflarvae. Thistyphoon transported the larvae into the deep waters andeventually decreased the survival in a short period (Li., 2014c). In this study, the SST anomaly in the Niño 3.4 re- gion was used as an index to indicate the El Niño and La Niña events (Yu., 2018). Based on the model outputs, more and lesslarvae and juveniles were tran- sports out of the Tsushima Strait corresponding to the high and low SST anomaly in the Niño 3.4 region, respectively. This implied that the number of larvae and juveniles tran- sported into the Tsushima Strait was low in the El Niño year and relatively high in the La Niña year. Once the recruit- ment ofdramatically decreased in the El Niño year, theabundance and biomass would de- cline. This was consistent with the results from Lu. (2021). As shown in Fig.9, some years were inconsistent with the above conclusions. This was because the influ-ences of climate variability on the transport and distribu-tion of larvae and juveniles was typically nonlinear andhighly complex, and there were many factors affecting the transportation and distribution. There was a great uncer- tainty in the internal mechanism between the two. In fact, it can hardly be expressed using a simple regression func- tion relationship. As this study did not analyze the reason for the differences in the physical environment, in-depth re- search on the impacts of climate variability on the physi- cal environmental changes should be conducted in the fu- ture studies.
Acknowledgements
This study was financially supported by the National Key R&D Program of China (No. 2018YFD0900906), the Na- tional Natural Science Foundation of China (No. 419060 73), and the Natural Science Foundation of Shanghai (No. 19ZR1423000).
Bartsch, J., and Coombs, S. H., 2004. An individual-based mo- del of the early life history of mackerel () in the eastern North Atlantic, simulating transport, growth and mortality., 13 (6): 365-379, DOI: 10. 1016/S0304-3800(00)00398-7.
Bartsch, J., Reid, D. G., and Coombs, S. H., 2010. Simulation of mackerel () recruitment with an individual- based model and comparison with field data., 13 (6): 380-391, DOI: 10.1111/j.1365-2419.2004. 00306.x.
Boucher, J. M., Chen, C. S., Sun, Y. F., and Beardsley, R. C., 2013. Effects of interannual environmental variability on the transport- retention dynamics in haddocklar- vae on Georges Bank., 487 (1): 201-215, DOI: 10.3354/meps10462.
Brander, K., 2010. Impacts of climate change on fisheries., 79 (3): 389-402, DOI: 10.1016/j.jmarsys.2008.12.015.
Chen, C. S., Gao, G. P., Zhang, Y., Beardsley, R. C., Lai, Z. G., Qi, J. H.,., 2016. Circulation in the Arctic Ocean: Results from a high-resolution coupled ice-sea nested Global-FVCOMand Arctic-FVCOM system., 141 (2): 60-80, DOI: 10.1016/j.pocean.2015.12.002.
Chen, C. S., Lai, Z. G., Beardsley, R. C., Xu, Q. C., Lin, H. C., and Viet, N. T., 2012. Current separation and upwelling over the southeast shelf of Vietnam in the South China Sea., 117: C03033, DOI: 10. 1029/ 2011JC007150.
Chen, C. S., Xue, P. F., Ding, P. X., Beardsley, R. C., Xu, Q. C., Mao, X. M.,., 2008. Physical mechanisms for the off- shore detachment of the Changjiang diluted water in the East China Sea., 113: C02002, DOI: 10.1029/2006JC003994.
Chen, X. J., and Li, Y. S., 2012. Review of application of indi- vidual-based model to fishery ecosystem., 36 (4): 629-640, DOI: 10.3724/SP.J.1231.2012. 27661.
Coombs, S. H., Nichols, J. H., and Fosh, C. A., 1990. Plaice eggs(.) in the southern North Sea: Abun- dance, spawning area, vertical distribution, and buoyancy., 47: 133-139, DOI: 10.1093/icesjms/ 47.2.133.
Dabin, L., Seunghyun, S., Wonkook, K., Joo, P., Huitae, J., and Sang, L., 2018. Spatio-temporal variability of the habitat suit- ability index for chub mackerel () in the East/ Japan Sea and the South Sea of South Korea., 10 (6): 938, DOI: 10.3390/rs10060938.
Gao, F., Chen, X. J., Guan, W. J., and Li, G., 2015. Fishing ground forecasting of chub mackerel in the Yellow Sea and East Chi- na Sea using boosted regression tree., 37 (10): 39-48, DOI: 10.3969/j.issn.0253-4193.2015.10.004.
Guan, W. J., Chen, X. J., Gao, F., and Li, G., 2013. Study on the dynamics of biomass of chub mackerel based on ocean net primary production in southern East China Sea., 35 (5): 121-127, DOI: 10.3969/j.issn.0253-4193. 2013.05.013.
Guan, W. J., Chen, X. J., and Li, G., 2011. Influence of sea sur- face temperature and La Niña event on temporal and spatial fluctuation of chub mackerel () stock in the East China Sea., 20 (1): 102-107.
Hansen, J. E., Martos, P., and Madirolas, A., 2001. Relationship between spatial distribution of the patagonian stock of argen- tine anchovy,, and sea temperatures dur- ing late spring to early summer., 10 (2): 193-206, DOI: 10.1046/j.1365-2419.2001.00166.x.
Hiyama, Y., Yoda, M., and Ohshimo, S., 2002. Stock size fluc- tuations in chub mackerel () in the East Chi-na Sea and the Japan/East Sea., 11 (6): 347-353, DOI: 10.1046/j.1365-2419.2002.00217.x.
Hovenkamp, F., and Witte, J. J., 1991. Growth, otolith growth and RNA/DNA ratios of larval plaicein the North Sea 1987 to 1989., 70 (2): 105-116, DOI: 10.3354/meps070105.
Hua, C. X., Li, F., Zhu, Q. C., Zhu, G. P., and Meng, L. W., 2020. Habitat suitability of Pacific saury () based on a yield-density model and weighted analysis., 221: 105408, DOI: 10.1016/j.fishres.2019.105408.
Hunter, J. R., and Kimbrell, C. A., 1980. Early life history of Pa- cific mackerel,., 78 (1): 89-101, DOI: 10.1577/1548-8446(1980)005<0059:SLC>2.0. CO;2.
Igarashi, H., Ichii, T., Sakai, M., Ishikawa, Y., Toyoda, T., Masuda, S.,., 2017. Possible link between interannual variation of neon flying squid () abundance in the North Pacific and the climate phase shift in 1998/ 1999., 150 (1): 20-34, DOI: 10. 1016/j.pocean.2015.03.008.
Lan, K. W., Karen, E., and Lee, M. A., 2013. Effects of climate variability on the distribution and fishing conditions of yel- lowfin tuna () in the western Indian Ocean., 119 (1): 63-77, DOI: 10.1007/s10584-012- 0637-8.
Li, G., and Chen, X. J., 2007. Tempo-spatial characteristic ana- lysis of the mackerel resource and its fishing ground in the East China Sea., 37 (6): 921-926, DOI: 10.1360/yc-007-1071.
Li, G., Chen, X. J., and Feng, B., 2008. Age and growth of chub mackerel () in the East China and YellowSeas using sectioned otolith samples., 7 (4): 439-446.
Li, G., Cao, J., Zou, X. R., Chen, X. J., and Runnebaum, J., 2016. Modeling habitat suitability index for Chilean jack mackerel () in the Southeast Pacific., 178: 47-60, DOI: 10.1016/j.fishres.2015.11.012.
Li, Y. S., 2012. Simulation study of ecological dynamics of ear- ly life history of Chub mackerel () in the East China Sea. PhD thesis. Shanghai Ocean University (in Chi- nese with English abstract).
Li, Y. S., Chen, X. J., and Yang, H., 2012. Individual-based mo- del of the early life-history stages of chub mackerel () in the East China Sea., 23 (6): 1695-1703, DOI: 10.13287/j.1001-9332.2012. 0275.
Li, Y. S., Chen, X. J., Chen, C. S., Ge, J. Z., Ji, R. B., Tian, R. C.,., 2014a. Dispersal and survival of chub mackerel () larvae in the East China Sea., 283: 70-84, DOI: 10.1016/j.ecolmodel.2014.03.016.
Li, Y. S., Pan, L. Z., and Chen, X. J., 2013a. Effects of spawning water depth on transport and survival of chub mackerel () eggs and larvae in the East China Sea., 35 (2): 176-182, DOI: 10.13233/j.cnki.mar.fish. 2013. 02.008.
Li, Y. S., Pan, L. Z., and Chen, X. J., 2014b. Effect of spawning ground location on the transport and growth of chub mackerel () eggs and larvae in the East China Sea., 34 (2): 92-97, DOI: 10.1016/j.chnaes. 2013.06.001.
Li, Y. S., Pan, L. Z., Chen, X. J., and Fei, Y. J., 2013b. Impacts of swimming behavior on the transport and recruitment of lar- vae and juvenile of chub mackerelin the East China Sea., 44 (2): 318- 325.
Li, Y. S., Pan, L. Z., Chen, X. J., and Yan, L. P., 2014c. Impact of Typhoon Alice on the transport and survival of eggs and lar- vae of chub mackerel () in the East China Sea., 44 (8): 32-40, DOI: 10.16441/j.cnki.hdxb.2014.08.005.
Lien, Y. H., Su, N. J., Sun, C. L., Punt, A. E., Yeh, S. Z., and Di- nardo, G., 2014. Spatial and environmental determinants of the distribution of Striped Marlin () in the western and central North Pacific Ocean., 97 (3): 267-276, DOI: 10.1007/s10641-013-0149-z.
Lu, X. Y., Liu, Z. L., Yu, W., Chen, X. J., and Li, G., 2021. Diffe- rences of the impacts of the El Niño and La Niña events on spatial and temporal distribution of potential habitat of chub mackerelin the East China Sea, taking the years of 2007 and 2015 for example., 43 (2): 137-148.
Matsuura, Y., and Hewitt, R., 1995. Changes in the spatial pat- chiness of Pacific mackerel,, larvae with in- creasing age and size., 93 (1): 172-178.
Sassa, C., and Tsukamoto, Y., 2010. Distribution and growth ofandlarvae in the southern East China Sea in response to oceanographic conditions., 419: 185-199, DOI: 10.3354/me ps08832.
Soto-Mendoza, S., Parada, C., Castro, L., Colas, F., and Schneider, W., 2012. Modeling transport and survival of anchoveta eggs and yolk-sac larvae in the coastal zone off central-southern Chile:Assessing spatial and temporal spawning parameters., 92: 178-191, DOI: 10. 1016/j.pocean.2011. 07.001.
Tian, R. C., Chen, C. S., Stokesbury, K. D. E., Rothschild, B. J., Cowles, G. W., Xu, Q. C.,., 2009. Dispersal and settlement of sea scallop larvae spawned in the fishery closed areas on Georges Bank., 66 (10): 2155- 2164, DOI: 10.1093/icesjms/fsp175.
Tian, R. C., Chen, C. S., Stokesbury, K. D. E., Rothschild, B. J., Cowles, G. W., Xu, Q. C.,., 2010. Modeling the connec- tivity between sea scallop populations in the Middle Atlantic Bight and over Georges Bank., 380 (1): 147-160, DOI: 10.3354/meps07916.
Waluda, C. M., Yamashiro, C., and Rodhouse, P. G., 2006. Influ- ence of the ENSO cycle on the light-fishery forin the Peru Current: An analysis of remotely sensed data., 79 (1-2): 56-63, DOI: 10.1016/j.fishres. 2006.02.017.
Wang, Y. H., Wei, H., and Kishi, M. J., 2013. Coupling of an in- dividual-based model of anchovy with lower trophic level and hydrodynamic models., 12 (1): 45-52, DOI: 10.1007/s11802-013-1901-x.
Yu, W., Chen, X. J., Chen, C. S., and Zhang, Y., 2017. Impacts of oceanographic factors on interannual variability of the win- ter-spring cohort of neon flying squid abundance in the North- west Pacific Ocean., 36 (10): 48-59, DOI: 10.1007/s13131-017-1069-0.
Yu, W., Chen, X. J., Yi, Q., and Tian, S. Q., 2015. A review of interaction between neon flying squid () and oceanographic variability in the North Pacific Ocean., 14 (4): 739-748, DOI: 10.1007/s11802-015-2562-8.
Yu, W., Guo, A., Zhang, Y., Chen, X. J., Qian, W. G., and Li, Y. S., 2018. Climate-induced habitat suitability variations of chub mackerelin the East China Sea., 207: 63-73, DOI: 10.1016/j.fishres.2018.06.007.
February 7, 2021;
March 30, 2021;
April 1, 2021
© Ocean University of China, Science Press and Springer-Verlag GmbH Germany 2022
. Tel: 0086-21-61900306
E-mail:liys@shou.edu.cnxd
(Edited by Qiu Yantao)
杂志排行
Journal of Ocean University of China的其它文章
- Variations in Dissolved Oxygen Induced by a Tropical Storm Within an Anticyclone in the Northern South China Sea
- Intensity of Level Ice Simulated with the CICE Model for Oil-Gas Exploitation in the Southern Kara Sea, Arctic
- Learning the Spatiotemporal Evolution Law of Wave Field Based on Convolutional Neural Network
- Development and Control Strategy of Subsea All-Electric Actuators
- Acoustic Prediction and Risk Evaluation of Shallow Gas in Deep-Water Areas
- In Situ Observation of Silt Seabed Pore Pressure Response to Waves in the Subaqueous Yellow River Delta