Implementation and application of PyNE sub-voxel R2S for shutdown dose rate analysis
2022-08-29XiaokangZHANG张小康PatrickSHRIWISESonglinLIU刘松林andPaulWILSON
Xiaokang ZHANG(张小康) ,Patrick C SHRIWISE,Songlin LIU(刘松林),*and Paul P H WILSON
1 Institute of Plasma Physics, Hefei Institutes of Physical Science, Chinese Academy of Sciences, Hefei 230031, People’s Republic of China
2 Argonne National Laboratory, 9700 S. Cass Ave., IL 60439, United States of America
3 University of Wisconsin-Madison, 1500 Engineering Dr, Madison, WI 53706, United States of America
Abstract PyNE R2S is a mesh-based R2S implementation with the capability of performing shutdown dose rate (SDR) analysis directly on CAD geometry with Cartesian or tetrahedral meshes. It supports advanced variance reduction for fusion energy systems. However, the assumption of homogenized materials of PyNE R2S with a Cartesian mesh throughout a mesh voxel introduces an approximation in the case where a voxel covers multiple non-void cells. This work implements a sub-voxel method to add fidelity to PyNE R2S with a Cartesian mesh during the process of activation and photon source sampling by performing independent inventory calculations for each cell within a mesh voxel and using the results of those independent calculations to sample the photon source more precisely.PyNE sub-voxel R2S has been verified with the Frascati Neutron Generator (FNG)-ITER and ITER computational shutdown dose rate benchmark problems. The results for sub-voxel R2S show satisfactory agreement with the experimental values or reference results.PyNE sub-voxel R2S has been applied to the shutdown dose rate calculation of the Chinese Fusion Engineering Testing Reactor (CFETR). In conclusion, sub-voxel R2S is a reliable tool for SDR calculation and obtains more accurate results with the same voxel size than voxel R2S.
Keywords: shutdown dose rate, R2S, sub-voxel, PyNE
1. Introduction
High-energy neutrons are born from D-T fusion reactions in fusion systems and penetrate deeply into the system and activate components during the operation. High-energy photons are produced from the decay of these activated radionuclides even after the shutdown of the system, causing a shutdown dose rate (SDR) in the fusion system. Accurate assessment of the SDR plays an important role in personnel safety during maintenance of the fusion system.
Both the Direct-One-Step (D1S) [1] and the Rigorous-Two-Step (R2S) [2] are validated [3-5] methods to evaluate the SDR.In this work we focus on further development of the R2S method. The R2S method was first proposed by Cheng and Fischer [2] using a cell-based approach. A mesh-based R2S method was proposed [6, 7] to achieve sufficient resolution without laborious splitting of the cells. Mesh-based R2S implementations use tallies on a superimposed structured mesh over a geometric model to obtain the neutron flux in each voxel. Then homogenized mixture materials are used in the activation calculations for each voxel.The gamma source is uniformly sampled in each voxel during photon transport.

Figure 1.Difference between voxel R2S and sub-voxel R2S.
There are several mesh-based R2S implementations for calculating the SDR, such as MCR2S [7], R2Smesh [8],R2SUNED[9],PyNE R2S[10,11]and R2S with cosRMC[12].All these validated mesh-based R2S implementations, with unique features, advantages and disadvantages, are reliable methods for calculating the SDR. For example, PyNE R2S can reduce the modeling efforts to calculate the SDR for fusion systems due to its ability to perform SDR analysis directly on CAD geometry with Cartesian or tetrahedral meshes and support advanced variance reduction [10, 13]. PyNE R2S supports multiple Direct Accelerated Geometry Monte Carlo (DAGMC)embedded Monte Carlo particle transport codes, such as DAGOpenMC [11] and DAG-MCNP5 [10], with not much modification to the source code except for the subroutine for photon source sampling. The interface functions and codes of PyNE R2S can be easily transferred or applied to other Monte Carlo codes with mesh-tally ability, such as cosRMC [12].
The homogenized materials and average flux approach used in PyNE R2S introduce a modeling error, even in the case when photon source sampling is restricted to non-void regions in space. For a complex geometry such as ITER[14-16] it is computationally expensive to use mesh voxels small enough to obtain a spatial resolution for a reliable decay gamma source evaluation [17-20]. There are some solutions for improving the spatial resolution with respect to the average flux approach to address the frequent case of mesh nonconformity with the geometry. For example, the ‘cell-undervoxel’approach used in R2SUNED [9]offers the solution of performing a neutron flux calculation for every cell that lies within any voxel, with extensive modification to the Monte Carlo source code to implement the ability to perform a neutron flux calculation for every ‘cell-under-voxel’. However, this is currently unavailable for users not involved with ITER; Monte Carlo codes such as OpenMC, cosRMC. R2S with an unstructured mesh that fits the geometry exactly,which is available in both MCR2S-UM [18] and PyNE R2S[10], requires much higher computational resources in terms of memory usage and CPU time.
The PyNE sub-voxel R2S method was developed to adopt the advantages of both PyNE R2S and the ‘cell-undervoxel’technique.The most recent version of PyNE sub-voxel R2S used in this paper is available in PyNE v0.7.5 [21]. It improves the spatial resolution of the photon source using Cartesian mesh without extensive modification to the source code or highly increased computational resources.PyNE subvoxel R2S applies the sub-voxel (intersection of a cell and a voxel, similar to the concept of the ‘cell-under-voxel’ in R2SUNED [9]) method to add fidelity to the process of activation and photon source sampling by performing independent activation calculations for each cell within a voxel.It then uses the results of those independent calculations to sample the photon source more accurately.
This paper begins by introducing the implementation of the PyNE sub-voxel R2S in section 2.Section 3 demonstrates that sub-voxel R2S can get more accurate results with the same mesh. Section 4 presents the benchmarking of the subvoxel R2S using a FNG-ITER SDR experiment. Section 5 presents the application of sub-voxel R2S for calculation of the SDR of the Chinese Fusion Engineering Testing Reactor(CFETR).Finally,our conclusions are presented in section 6.
2. PyNE sub-voxel R2S workflow
The PyNE R2S workflow can be considered as five sequential steps:neutron transport,generation of activation geometry on the neutron mesh(R2S step 1),activation calculation,generation of photon source for sampling in Monte Carlo (R2S step 2) and photon transport steps in the PyNE R2S workflow. The PyNE sub-voxel R2S,which will be referred to as‘sub-voxel R2S’in this paper,is modified from the existing PyNE R2S,which will be referred to as ‘voxel R2S’, by implementing a sub-voxel method. The sub-voxel, similar to the ‘cell-under-voxel’ in R2SUNED [9], is the unique intersection of a cell and a voxel.For each voxel in a mesh,there may be one or more sub-voxels.
PyNE sub-voxel R2S and voxel R2S share the same neutron transport step. However, they treat the voxel/subvoxel differently during the activation calculation and photon transport step, as shown in figure 1.
Voxel R2S and sub-voxel R2S both employ a discretization tool to calculate the volume fractions of cells that are enclosed within each voxel.In voxel R2S,the average neutron flux and the homogenized material for each voxel are used to perform the activation calculation.In contrast,in sub-voxel R2S the activation calculations are applied to the (individual) material of each subvoxel. Consequently, for a voxel containing several sub-voxels,there will be multiple activation calculations which result in different photon emission rates for each sub-voxel. Unlike R2SUNED, the average neutron flux is used to activate all subvoxel materials, therefore, no modification to the tally routine of the source code is necessary.
In the photon transport process, the source sampling methods also differ between voxel R2S and sub-voxel R2S.In sub-voxel R2S, the source photons are uniformly sampled in each sub-voxel whereas in voxel R2S photons are uniformly sourced anywhere in the voxel [10]. Biased photon source sampling methods addressed in [10] are also implemented for sub-voxel R2S.
For the purpose of parallelization of as low as reasonably achievable (ALARA) inventory calculation, a Python tool named ‘alara_split_gather’ [22], was developed to split a large ALARA inventory task into multiple sub-tasks and gather the results of each sub-task into a single file for the photon source generation step.
What is more,a new technique was also applied to speed up source sampling in the photon transport step. Previously,when the coordinates of a source particle were sampled, the routine would iterate over all cells in the model to determine the cell index of the source particle,which consumes a fair amount of CPU time.In the new technique the cell list under each voxel is obtained and stored during the discretization process. The process of locating the source particle is sped up by checking over the cell list under the voxel.Thus,for sub-voxel R2S,the cell index is determined at the same time as the voxel index,optimizing the source particle locating process.
By applying the sub-voxel method, a better spatial resolution can be obtained with the same mesh resolution as voxel R2S at the expense of some additional computational resources(memory and time)in the activation and photon transport steps.Improved photon sampling resolution is particularly important in regions where a voxel overlaps many cells and/or streaming channels, as shown in the following section.

Figure 2.Geometry of the demonstration problem in units of cm.
3. Sub-voxel R2S demonstration
As mentioned in section 2,applying the sub-voxel method to mesh-based R2S enables one to obtain a better spatial resolution with the same voxel size.In other words,the results of sub-voxel R2S are more precise than those of voxel R2S for the same mesh. In this section, the benefit of the sub-voxel R2S is demonstrated using a contrived problem.
The geometry and the material design of the problem are illustrated in figure 2.Five pieces of cuboid lead plates with a thickness of 5 cm are placed inside a 5 cm cube water shell.An isotropic 14 MeV neutron source with an intensity of 1×10¹⁰neutrons s-1is located in the center of the lead plate on the left. A cuboid that exactly encloses these five lead plates was irradiated for 3.5 h. The geometry and material definition,as well as the input files for this contrived problem,are available at a repository [23].
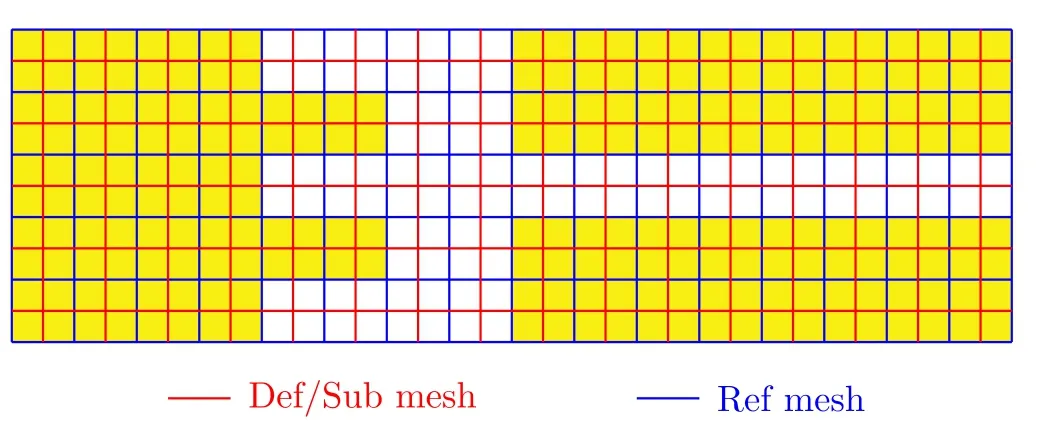
Figure 3. Meshes for reference, default and sub-voxel cases.
The material-laden geometry was generated using Trelis 17.1 [24] and PyNE v0.7.5 [21]. For the simulation of the contrived demonstration as well as the benchmark problems,DAG-MCNP5 [25] and FENDL3.1d [26] libraries were used for neutron transport,and VATAMIN-J 175 grouped neutron flux over meshes were tallied. The ALARA code [27] and EAF2010 [28] library were used for activation calculation,and the 24-group decay photons were scored. The upper limits of the 24-group decay photons are 0.01,0.02,0.05,0.1,0.2, 0.3,0.4,0.5, 0.6,0.8,1.0, 1.22,1.44,1.66,2.0,2.5, 3.0,4.0, 5.0, 6.5, 8.0, 10.0, 12.0, 14.0 and 20.0 MeV. DAGMCNP5 and MCPLIB84[29]were used for photon transport.
Three cases were calculated in order to demonstrate the difference between the voxel R2S and the sub-voxel R2S.They are:
(1) Reference case(Ref),using voxel R2S with a mesh that is aligned to the geometry (shown in figure 3) and therefore does not require material homogenization.
(2) Default case (Def), using a voxel R2S with a mesh intentionally misaligned with the geometry causing material homogenization.
(3) Sub-voxel case (Sub), using sub-voxel R2S with the same mesh as in the Def case.
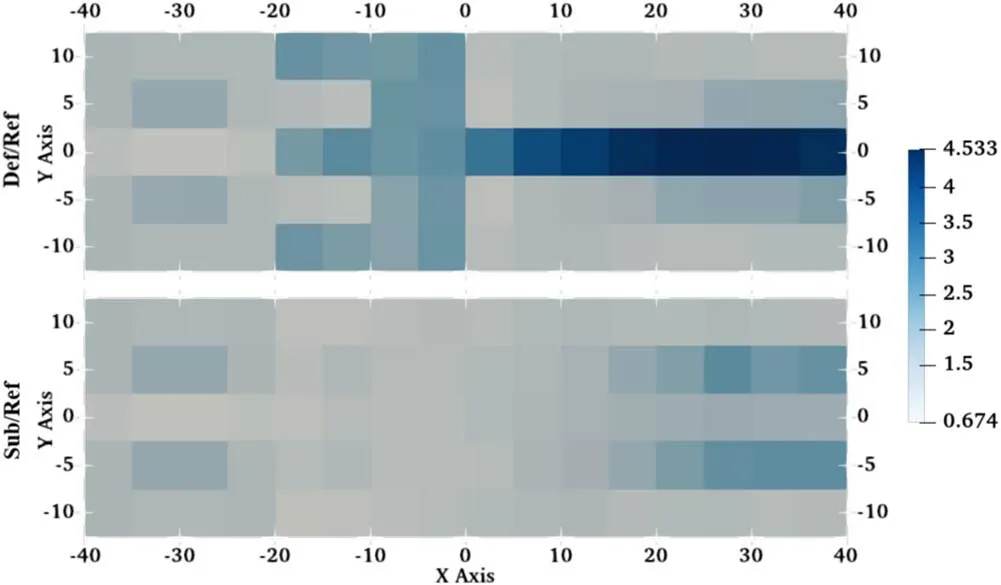
Figure 4. Def/Ref (top) and Sub/Ref (bottom) results at a cooling time of 1 s.
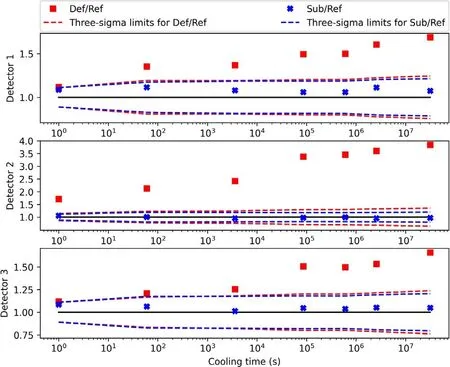
Figure 5. Comparison of the SDR at three detectors.
The SDR was measured at 1 s,1 min,1 h,1 day,7 days,30 days and 1 year after shutdown.Figure 4 shows the ratio of the SDR for the Def and Sub cases to the Ref case at a cooling time of 1 s. The difference between the Def and Ref cases is much larger than the difference between the Sub and Ref cases, particularly for regions with disparate materials.
The benefit of the sub-voxel R2S over the voxel R2S can also be seen from the dose rates of the detectors. The dose rate ratios of the Def and Sub cases to the Ref case at different cooling times of three detectors are presented in figure 5. In all the detectors, the dose rates of the Def case are significantly different from the results of the Ref case;by contrast,the results of the Sub case are relatively closer to the results of the Ref case.
Comparing the results obtained with the sub-voxel R2S and the voxel R2S it is clear that sub-voxel R2S provides better results than voxel R2S for mesh voxels containing multiple materials.
4. Benchmarking
4.1. ITER computational SDR benchmark
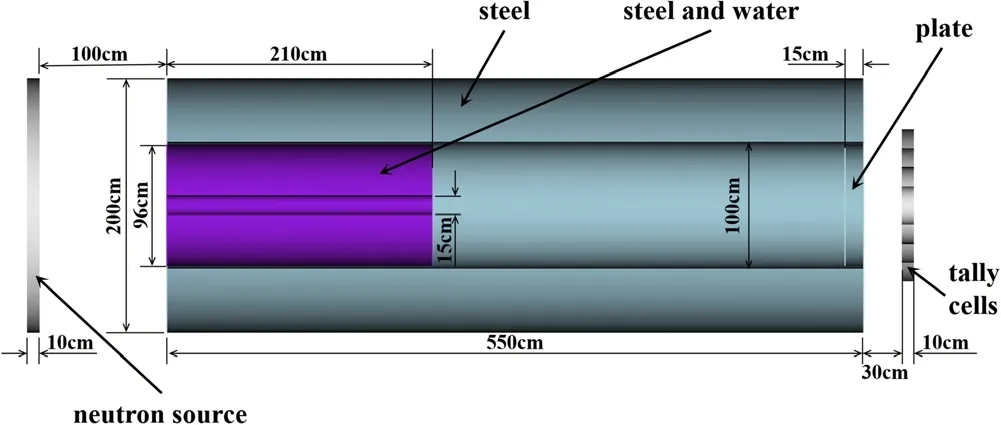
Figure 6.Problem specifications of the ITER computational SDR benchmark.
The ITER computational SDR benchmark[30]was also used to verify the PyNE sub-voxel R2S method. The geometry of the assembly, shown in figure 6, consists of a 550 cm long cylindrical shell with an inner diameter of 100 cm and an outer diameter of 200 cm. A shielding block with a length of 210 cm is located at the front of the assembly. There is a penetration with an inner diameter of 15 cm in the shielding block. The outer diameter of the shielding block is 96 cm,leaving a 2 cm annular gap with the outer shell.The assembly is closed at the end with a 15 cm thick steel plate.An isotropic 14 MeV neutron source 100 cm in front of the assembly is used in the problem.
The material-laden geometry of the ITER computational benchmark problem was generated using Trelis 17.1 and PyNE. An improved on-the-fly global variance reduction(GVR) method [31] was integrated into DAG-MCNP5 and applied to accelerate the neutron transport calculation, and 2×10⁸neutron histories were simulated. A 5 cm×5 cm×5 cm structured mesh covering the assembly was used to tally neutron flux. The activation calculation was performed with the ITER-recommended SA2 scenario [32]. The photon transport was performed using 1×10⁹histories with the GVR method. The SDRs, with relative error less than 0.011,in four tally cells 15 cm behind the plate at 106s after shutdown using ICRP-74 flux-to-dose conversion factors [33]were calculated.
The SDRs are compared with reference results from[8,9,18,30]in figure 7.The results of both PyNE voxel and sub-voxel R2S are very close to each other. Only two materials were used in this problem and most of the mesh elements contain a single non-void material. As a result, voxel R2S is able to resolve the decay photon source distribution with equal accuracy to the sub-voxel R2S approach. A small proportion of the mesh elements contain more than one material, but these mesh elements are located in the front of the geometry,far from the tally cells,and have little influence on the tally results. The dose rate with the PyNE sub-voxel agrees with reference results,showing the reliability of PyNE sub-voxel R2S implementation.
4.2. FNG-ITER benchmark
The FNG-ITER SDR experiment [3] was also used to verify the PyNE sub-voxel R2S. The experimental geometry consisted of a 99 cm×71.83 cm×98.4 cm block of SS316 and water-equivalent polymethyl methacrylate (PPMA). There is a central cavity with a lateral access which was plugged during irradiation. The plug was removed and a NE-105 plastic scintillator for photon flux and a NE-213 liquid scintillation detector for dose rate were inserted into the central cavity, as shown in figure 8. The CAD models,corresponding to neutron transport (with lateral access plugged) and photon transport (with lateral access unplugged and detectors inserted) used in the benchmarking of PyNE R2S[10] were used to verify PyNE sub-voxel R2S. Details of the experiment setup are described in [3].
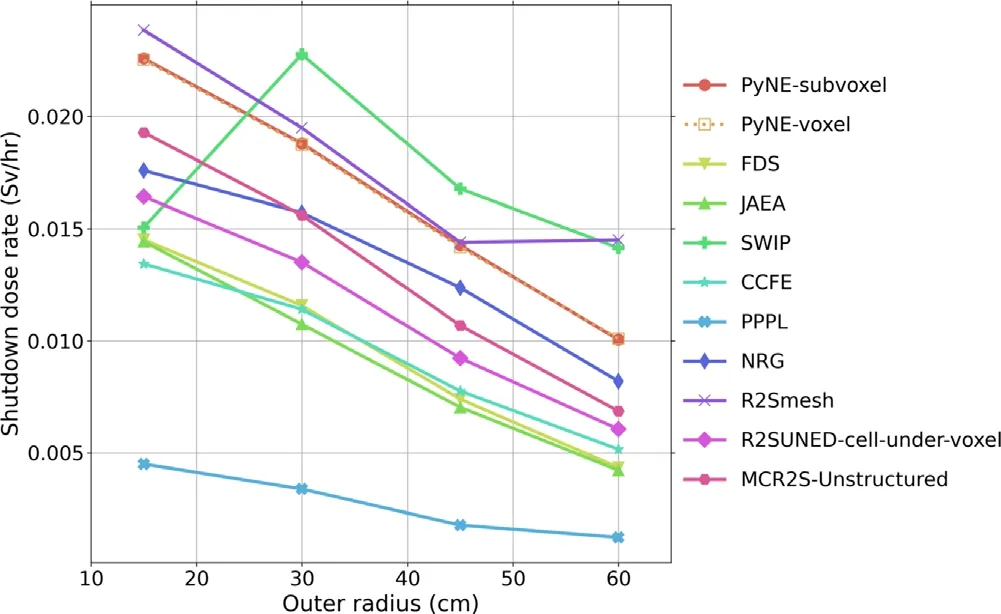
Figure 7. Comparison of SDRs in tally cells for the ITER computational SDR benchmark problem.
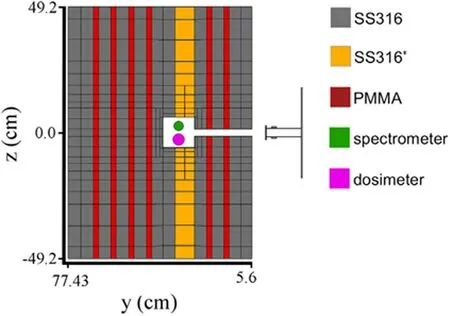
Figure 8. Model of the FNG-ITER experiment (y-z slice through x=0).
An approximate neutron source [6, 7] in standard SDEF cards mimicking the neutron emission of the FNG beam using data was used in the neutron transport step. GVR has the effect of increasing the uncertainty of the SDR calculation,because the neutron correlation is increased when splitting techniques are used [34]. Therefore, neutron transport was simulated without GVR to reduce the uncertainty.The history simulated in neutron transport was 1×10¹⁰.The VITAMINJ 175 grouped neutron fluxes of a uniform Cartesian mesh with 50×36×49 voxels covering the geometry were tallied. The relative errors of a total neutron flux of 99.6%voxels are less than 0.05.
The activation calculation was performed with the second irradiation campaign of the FNG benchmark problem[3].The individual material for the corresponding sub-voxel was used during the activation.The average neutron flux in each voxel was used in the inventory calculation. The 24-group photon emission densities of all sub-voxels were obtained for each decay time.
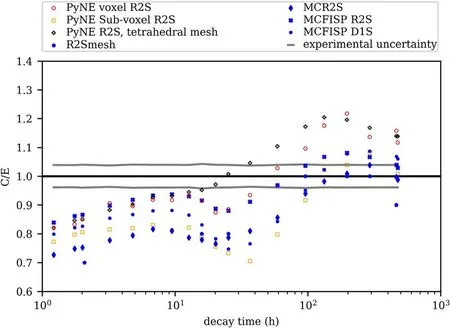
Figure 9.Ratio of calculated dose rates (C) to experimental dose rates(E),for the PyNE voxel/sub-voxel R2S,MCR2S[7],R2Smesh[8] and MCFISP [3].
The photon source was sampled uniformly such that there are a similar proportion of the photon source particles generated in each sub-voxel during the photon transport;1×10⁸photon particles were simulated and ANSI/ANS-6.1.1-1977 [35] flux-to-dose-rate conversion factors were used to obtain dose rates with a relative error of less than 0.02.
The experimental results[3]and computational results of MCFISP R2S [3], MCFISP D1S [3], MCR2S [7] and PyNE R2S [10] are compared in figure 9. PyNE sub-voxel R2S achieved satisfactory agreement with experimental results for both mesh cases.Compared with the experimental results,the discrepancies of the PyNE voxel R2S and sub-voxel R2S results are 24.1% and 22.9%, respectively. Therefore, we consider PyNE sub-voxel R2S to be a reliable method for estimating the SDR for fusion systems.
The sub-voxel R2S requires a slightly longer CPU time than the voxel R2S. However, the increased CPU time is negligible compared with the entire workflow. Taking the FNG-ITER benchmark as an example,the CPU time required for neutron transport of a Cartesian mesh with 50×36×49 voxels and 1×10¹⁰histories comprises 99.7% of the entire workflow.Therefore,the additional consumption of computer resources by PyNE sub-voxel R2S is negligible when the same Cartesian mesh is used.
5. Application
PyNE sub-voxel R2S has been applied to calculation of the SDR of the CFETR.The main components of the CFETR are considered in the CAD model [36] including the blanket,divertor, toroidal field coil (TFC), poloidal field coil (PFC),central solenoid(CS),vacuum vessel(VV),thermal shielding(TS),port plug,cryostat and bio-shield.The materials of these components are described in [37]. Taking advantage of the rotational symmetric geometry, a 22.5° section model with reflecting boundaries was created and exported to the DAGMC format with Trelis 17.1.

Figure 10.Total neutron flux and relative error of CFETR.
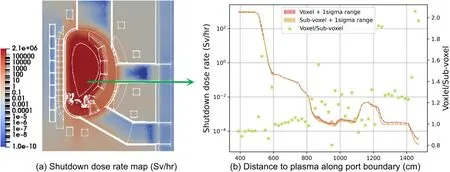
Figure 11.(a)Dose rate of CFETR at 12 days after shutdown.(b)The change in SDR with the distance to the plasma along the port boundary marked with a green arrow in (a).
A Cartesian mesh covers the geometry,ranging from 0 to 2200 cm in the x direction,-430 to 430 cm in the y direction and-2300 to 2000 cm in the z direction,with a mesh element size of 30 cm×30 cm×30 cm. Neutron transport was performed with 1×10⁹histories using the GVR method, and the VITAMIN-J 175 group neutron flux over the mesh was tallied. The neutron flux and relative error map over the CFETR geometry are shown in figure 10.
The CFETR will operate at different power levels,varying from 200 MW to more than 1 GW,with a duty factor of 0.5 [38, 39]. The assumed operational scenario of CFETR from[39]is applied to the SDR calculations.The operational scenario for preliminary analysis is simplified to a series of equivalent steady-state operations,more specifically,1 year of 200 MW,2 years of 500 MW,5 years of 1 GW and 2 years of 1.5 GW fusion power. The GVR method and 1×10⁸particles were used in photon transport. The SDRs over the CFETR geometry and along the boundary of mid-port at 12 days after shutdown are presented in figures 11(a)and(b),respectively. The calculated SDRs along the mid-port boundary for voxel and sub-voxel R2S are close to each other, with a difference of less than 20% in most places. But there are several locations where the discrepancy of results between voxel and sub-voxel is greater than 100%. This phenomenon agrees with the expectation that sub-voxel R2S has better accuracy at material boundaries.
6. Conclusion
The sub-voxel method was implemented in PyNE R2S for the benefit of higher spatial resolution of the photon source compared with standard PyNE R2S. We feel it provides a reasonable trade-off between computer resources and the accuracy of the results.
The advantage of PyNE sub-voxel R2S over voxel R2S was demonstrated using a contrived problem, showing that it enables users to obtain better spatial resolution and more accurate results with the same mesh parameters as voxel R2S,particularly for regions where the mesh voxels overlap with material boundaries.PyNE sub-voxel R2S was proved to be a reliable tool for performing calculations of the SDR based on results from the FNG-ITER and ITER computational SDR benchmark problems. The results of a mesh sensitivity analysis found clear support for the conclusion that PyNE R2S requires a finer mesh than sub-voxel R2S to obtain a converged SDR result.
Future work will involve the assessment of the CFETR SDR field as part of the nuclear safety analysis. Study of the convergence trend with precise uncertainty analysis will also carried out in the future.
Acknowledgments
This work has been carried out within the financial support of the National Key R&D Program of China (Nos.2017YFE0300503 and 2017YFE0300604) and National Natural Science Foundation of China(No.11775256).The support provided by the China Scholarship Council (CSC) during a visit of Xiaokang Zhang to the University of Wisconsin-Madison is acknowledged.This project is funded by the China Postdoctoral Science Foundation (No. BX20200335). We thank our colleagues from the CNERG group who provided insight and expertise that greatly assisted this research.We are also immensely grateful to Dr Elliott D.Biondo for sharing the CAD models used in this work, and Dr Andrew Davis for assistance with the FNG neutron source. The numerical calculations in this work were done at the Hefei Advanced Computing Center.
ORCID iDs
Xiaokang ZHANG (张小康) https://orcid.org/0000-0002-4081-2172
猜你喜欢
杂志排行

Plasma Science and Technology的其它文章
- Experimental study on surface arc plasma actuation-based hypersonic boundary layer transition flow control
- Development of a compact high-density blue core helicon plasma device under 2000 G magnetic field of ring permanent magnets
- Improvement of the spreading effect of atmospheric pressure microplasma jet treatment through shielding-gas-controlled focusing
- Efficient direction-independent fog harvesting using a corona discharge device with a multi-electrode structure
- Development of the pellet injection system on the J-TEXT tokamak
- Microchannel cooling technique for dissipating high heat flux on W/Cu flat-type mock-up for EAST divertor