Development of a compact high-density blue core helicon plasma device under 2000 G magnetic field of ring permanent magnets
2022-08-29ZhikangLU卢智康GuoshengXU徐国盛ChiShungYIP叶孜崇DehongCHEN陈德鸿XingquanWU伍兴权WeiZHANG张炜GuanghaiHU胡广海ChenyaoJIN靳琛垚andDiJIANG江堤
Zhikang LU(卢智康),Guosheng XU(徐国盛),Chi-Shung YIP(叶孜崇),Dehong CHEN (陈德鸿), Xingquan WU (伍兴权), Wei ZHANG (张炜),Guanghai HU (胡广海), Chenyao JIN (靳琛垚) and Di JIANG (江堤)
1 Institute of Plasma Physics, Hefei Institutes of Physical Science, Chinese Academy of Sciences, Hefei 230031, People’s Republic of China
2 University of Science and Technology of China, Hefei 230026, People’s Republic of China
Abstract A helicon wave plasma source in a tube of ring permanent magnets(PMs)has been constructed to study the effect of the configuration of the magnetic field with zero magnetic points on plasma parameters. This device also serves as an exploration platform for a simple, compact helicon wave plasma source adaptable to engineering applications. A small-diameter (26 mm) highdensity (~1018 m-3) blue core plasma is produced in ~1 Pa argon by helicon RF (radiofrequency)discharge using a Nagoya III antenna under magnetic field(~2 kG)of compact ring PMs (length ~204 mm). Operational parameters, i.e. RF power and neutral gas pressure are scanned and plasma density is measured by an RF compensated probe to explore the operating characteristics of the device.Iconic feature of a helicon discharge,such as blue core plasmas and E-H-W mode transitions are well observed in the device,despite the wavelength calculated using the conventional dispersion relation of a bounded whistler waves (Chen 1991 Plasma Phys.Control. Fusion 33 339) is order of magnitudes longer than the length of the plasma in this device which seems to suggest that such helicon device is impossible. Surprisingly, the wavelength calculated by the unbounded whistle wave dispersion formula in turn suggests the occurrence of a half wavelength resonance.
Keywords: mode transitions, compact helicon, high-density plasma, helicon plasma, blue core(Some figures may appear in colour only in the online journal)
1. Introduction
A high-density, high-ionization-rate, compact plasma source that can operate efficiently in a steady state is a powerful device in the research and application of plasma. For decades,researchers have conducted in-depth research on the helicon plasma source in a wide range of parameters [1, 2], such as device size, the configuration and strength of magnetic field and neutral gas pressure. Owing to these advantages to generate high-density(electron density up to 1020m-3) [3, 4],low-temperature (electron temperature from a few to several eV)[5]and high-ionization-rate(the degree of ionization more than 70%) [6] plasma at low gas pressure (pressure ranging from ~0.1 to several Pa) and low RF power (input RF power less than several kW), helicon plasma source is a potential candidate for utilization or exploration in semiconductor manufacturing [7-9], gas laser [10], nuclear fusion [11, 12],plasma acceleration/thruster[13-17],and serves as a platform for the investigations of basic plasma physics [18-20], etc.Despite helicon plasma has been considered for decades, the physical mechanisms of the formation of blue core plasma[21], efficient power absorption [22-27], multiple wave mode discharge [28, 29], and mode transition [30] have not been fully understood.
The applied magnetic field of most helicon plasma sources is traditionally generated by bulky and power-consuming electromagnetic coils. In order to move towards industrial application, Chen et al [31], Takahashi et al[32, 33] and Virko et al [34] mainly developed low-pressure solenoid-free plasma source under the external magnetic field configuration of permanent magnets(PMs).However,far too little attention has been paid to discharge in the internal field of compact ring PMs. The application of ring PMs in the helicon plasma source is a satisfactory way to miniaturize and simplify the device to adapt various engineering cases.In this work,a simple and compact helicon wave plasma source has been developed for engineering implementations, and the basic conditions of the discharge under the internal magnetic field configuration of ring PMs have been investigated.
In this paper, the dispersion relationship of helicon plasma will be briefly reviewed in section 2. Later, the experimental device will be described in section 3, including vacuum construction, magnetic field configuration for ringshaped PMs,RF impedance matcher,and the key diagnosis of this work, RF compensated Langmuir probe. The electron density on axis under different discharge conditions are measured in section 4.1, and the device discharge not only shows the hysteresis behavior under RF discharge, but also achieves mode transition and blue core mode discharge. In addition, an existential problem presented in section 4.2 is that the wavelength of helicon wave under magnetic field of PMs is not in agreement between theory of dispersion relation of boundary helicon wave plasma and experiment. Finally, a conclusion is presented in section 5.
2. Simple helicon theory
Under unbounded condition, dispersion relation for left and right polarized electromagnetic waves at an angleθto B is[35]

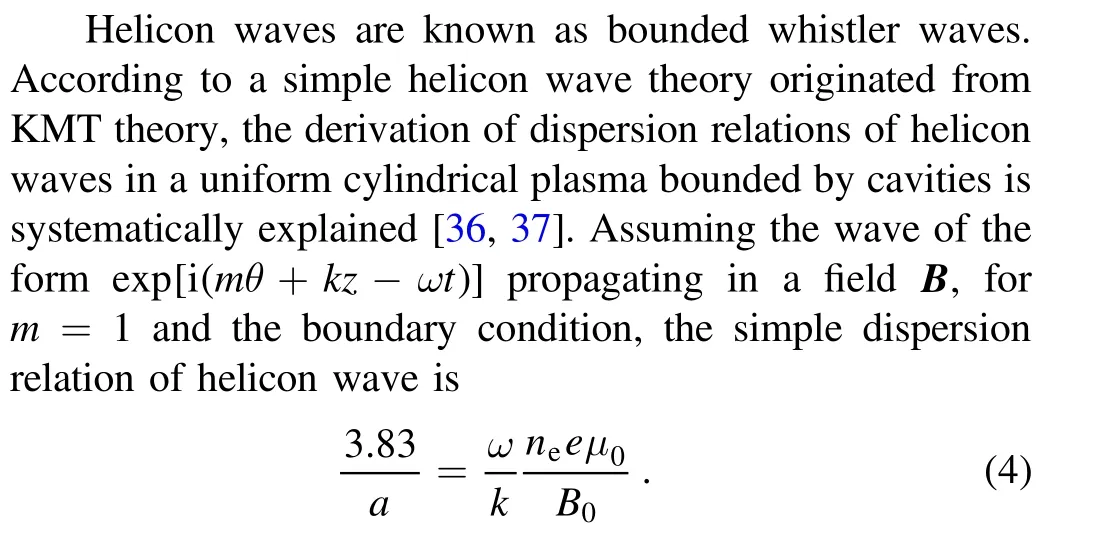
Hereais plasma radius.
Considering the electronic inertia when calculating the helicon wave dispersion relation will lead to Trivelpiece-Gould (TG) mode [38] which is observed experimentally at low magnetic fields[39,40].Yet,under higher magnetic field strength, the dispersion relation of helicon wave given by equation (2) dominates near the axis.
It is well known that if wave propagates in plasma, the length of the half-wavelength of wave should be approximately the same as or less than the length of the plasma.However, the wavelength calculated from the dispersion relation (4) seems to be much larger than the length of the plasma, as details in section 4.2 of this paper.
3. Apparatus
A schematic of the compact helicon device described in this work is shown in figure 1. The area at the end of inlet is the upstream region and the end of extraction is the downstream area,and the z-direction,defined as the same as the direction of magnetic field line within the tube of ring PMs, is oriented from antenna towards vacuum pump. Throughout the experiment, z=0 mm is located at the end face of ring PMs in the upstream region,and the origin of the axis is the intersection of the central axis and the end face of PMs in figure 1.
The device includes the vacuum system, gas supply system, a set of ring PMs, RF power matching system and diagnosis. The main vacuum chamber consists of an inlet chamber,a source chamber and a diffusion chamber.The inlet chamber is a straight cross in stainless steel with an inner diameter 35 mm. The ionization chamber is a straight quartz tube 40 cm long with an outer diameter 30 mm and an inner diameter 26 mm. The diffusion chamber is a straight cross in stainless steel with an inner diameter 105 mm. Quartz tube is used as a source chamber to connect inlet chamber and diffusion chamber. A 110ls-1turbomolecular pump and a 4ls-1mechanical pump are connected in turn behind the diffusion chamber to maintain the vacuum level in the chamber. Neutral gas pressure gauges are installed on the opposite side of the gas inlet and at the connection between the diffusion chamber and the pump to monitor the gas pressure in the upstream and downstream areas, as shown in figure 1. When gas pressure is higher than 1 Pa, resistance gauge is used for measurement, and the ionization gauge is used for measurement below 1 Pa, and the gas pressure involved in the experimental data of the paper is the neutral gas pressure in the upstream area (inlet chamber). Argon gas enters inlet chamber via a mass flow controller. Typical gas mass flow rate of ~1.5 sccm (standard cubic centimeter per minute) produces neutral gas pressure of ~1 Pa in the inlet chamber of the absence of plasma.When gas pressures in the upstream area (inlet chamber) are 1, 2, 3.4 and 4.1 Pa, the corresponding gas pressures in diffusion chamber are 0.023,0.07,0.18 and 0.28 Pa,respectively.The red blocks show the cross section of ring PMs.A Nagoya III antenna with a length of 87 mm is connected to a 3.5 kW RF power supply with RF matching to excite the plasma. The electron density is measured by a moveable RF compensated probe.
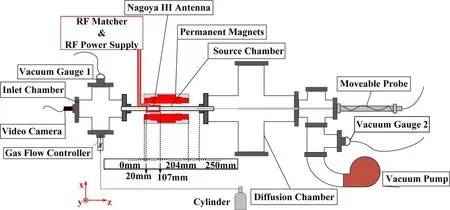
Figure 1.The schematic of cross-section of the helicon plasma device in top view.

Figure 2.(a)Top sectional view of the simulated distribution of magnetic lines of force in the PMs and the relative positions of the antenna to the PMs. (b) Simulated and experimentally measured axial distribution of the magnetic field of PMs.
3.1. The characteristics of ring PMs
Compared to electromagnetic coils,PMs require no additional power supply, and their small size, simple and compact construction make them more suitable for engineering applications. A 20.4 cm long tunnel of ring-shaped PMs made of neodymium iron boron material is passed through a quartz tube and simulations show that this set of PMs can reach a peak magnetic field of 2234 G and produce a uniform magnetic field region in the center of the aperture,as shown in figure 2(a). Due to the geometrical symmetry of this set of ring PMs, it is only necessary to calculate the distribution of magnetic lines of force in the x-o-z plane and it is clear that the magnetic field is uniformly distributed in the aperture. In order to verify the correctness of the simulation,the magnetic field distribution on the central axis was compared with the experimental measurements and it can be seen that they remain consistent and the simulation model is reliable, as shown in the figure 2(b). The positions of the two zero magnetic points and the two end faces of the PM almost coincide are marked by two green dashed lines at approximately 0 mm and 204 mm respectively.The relative positions of the antenna located in the range of z=20-107 mm and PMs are shown in figure 2(a).
3.2. RF impedance matcher
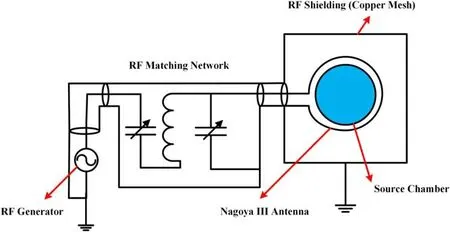
Figure 3. Simplified schematic of the RF generator, RF impedance matching network and antenna system.
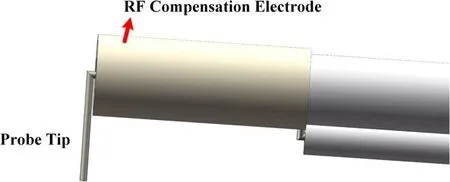
Figure 4.Design drawing of the RF compensation probe.
Impedance matching is an operating condition where the load impedance and the internal impedance of the excitation source(RF power supply)are adapted to each other to obtain maximum power output, and impedance matchers are designed to achieve this goal. The RF adjustable power supply system of a maximum power of 3.5 kW with watercooled circulation and automatic detection of reflected power and output power can be operated continuously at a fixed frequency of 13.56 MHz. However, due to the ability of the antenna and PMs to withstand the heat generated during the experiment,the maximum operating power in this experiment was limited to 650 W. Power is measured from the power supply.The impedance matcher is connected to the RF power supply using a coaxial cable assembly at one end and the load(i.e. the antenna and plasma) at the other end as shown in figure 3. To ensure the safety of the laboratory environment,the electromagnetic radiation generated by the RF is shielded during the RF plasma discharge by means of a well-conducting closed metal mesh or metal cover grounding.
The Nagoya III antenna, 87 mm in length and 38 mm in outer diameter,is located inside the tunnel of ring-shaped PMs,sheathed outside a quartz tube. In order to achieve impedance matching between the RF generator and the antenna/plasma system, a tunable inverse L-shaped matching network is designed and used in this device. Figure 3 shows two variable capacitors with a breakdown voltage of 10 kV with an adjustable capacitance range of 25-1000 pF and a fixed inductance of~1.83 μH in the inductor coil.As measured by a vector network analyzer, the impedance matching system can suppress return loss to 13 dB by adjusting the variable capacitance.
3.3. Diagnosis

Figure 5. The compensation circuit and sampling circuit of probe.
One of the characteristics of the plasma produced by excitation of the antenna with an RF power source is the presence of an oscillating plasma potential. The oscillating plasma potential has the effect of distorting the I-V characteristics of probe and it is therefore difficult to derive the correct plasma parameters.In order to be able to measure plasma parameters and to extend the spatial range of the measurements, a set of movable RF-compensated probe was designed. Movable RF compensation probe mainly includes three parts: an RFcompensated probe, an electric actuator and a signal acquisition system.
The RF compensated Langmuir probe for this device was designed by referring to the work of Chen et al[5].The CAD design and circuit design of the probe are shown in figures 4 and 5, respectively. A 2.5 mm long, 0.3 mm diameter probe tip made of tungsten was inserted through an alumina tube at one end and the other end of the alumina tube is inserted into the stainless-steel tube and held in place by a tight fit.An RF compensation electrode made of a 6 mm long stainless-steel tube with a wall thickness of 0.2 mm is placed on the alumina tube near the probe tip to contact the plasma during the discharge. 1-2 nF capacitance couples the probe tip and compensation electrode together and is then connected to the fundamental(13.56 MHz)and second harmonic(27.12 MHz)filter inductors via wires and finally to the sampling circuit as shown in figure 5.
The probe current is measured by measuring the voltage drop across the high power resistor R1=1 Ω, and the DC probe bias voltage is measured by measuring the voltage drop across the resistor R3=2 kΩ of the 51:1 voltage divider.The signal is transmitted to the data acquisition system via a coaxial cable,and probe scan voltage is added to the probe tip by a sine wave signal from a signal source input amplified to±100 V by a power amplifier through the acquisition circuit.
4. Results and discussion
The blue core which is a strong ion light emission in the radially localized central region is a distinctive characteristic of helicon wave plasmas. Experiments with this device have some of the same properties as helicon plasma discharges,such as blue core and mode transition.
4.1. Discharge characteristics and parameters scanning
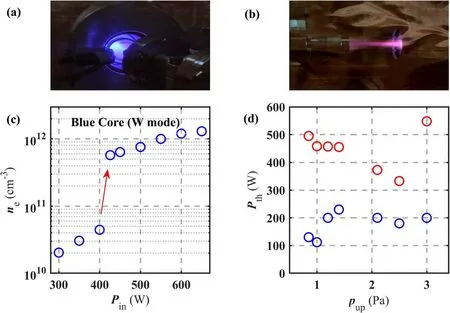
Figure 6.The device successfully realized the blue core plasma discharge in(a)diagram of discharge in the upstream area and(b)diagram of discharge in the downstream area.In(c),under gas pressure 1 Pa,as the RF power increases,the plasma density located at 226 mm jumps.In(d), under different neutral gas pressures, the upward and downward threshold powers for blue core plasma are shown in red and bluerespectively.
The present device with applied magnetic field provided by PMs generated blue core plasma, and the discharge in the upstream and downstream regions as shown in figures 6(a) and (b),respectively. The discharge parameters of the blue core plasma in figures 6(a) and (b) are 350 W of RF power, ~2000 G of applied magnetic field strength and 2.0 Pa of argon neutral pressure corresponding to a gas flow rate of 5 sccm. With currently available diagnostics,the measured power presented in this paper is the output power of the RF power supply, the power absorbed by the plasma will be investigated in further studies. A distinct blue core can be seen in figure 6(a) in the region near the center of tunnel of ring PMs.In figure 6(b),the pink light emission from excited state of neutral argon is visible in the upstream and downstream regions away from the blue core.And the fine plasma column appears near the end face of PMs located downstream, instead of filling the quartz tube.Due to the limiting power and magnetic field configuration in this work,the plasma is essentially well confined within the ring PMs tube,thus limiting the length of plasma column.However,subsequent experiments have shown that in fact, by gradually increasing the power, the fine plasma column slowly becomes thicker and clearly diverges along the magnetic lines of force.As the input power increases, pink light from plasma radiation gradually becomes brighter, and when the power exceeds the threshold power,that is,the upward threshold power,blue light also known as blue core would suddenly appear. This shift in light corresponds to a jump in density,as shown in figure 6(c).Existing literature shows that the light radiated from plasma jumps from pink light to blue light,which is a manifestation of neutral depletion and high ionization rate[41],and the ionization rate can even reach nearly 80%[6].After the appearance of the blue core mode,as the power decreases,it can be found that the blue core can exist at a lower power than the previously mentioned threshold power until it falls below another threshold power,that is,downward threshold power,where the blue core mode disappears. Then, sweeping upward and downward power,the downward and upward threshold powers of the mode transition of the blue core plasma under different neutral gas pressure are explored as shown in figure 6(d). As the Ar gas pressure increases, the neutral gas collision rate increases, and thus the upward threshold power gradually decreases with gas pressure. However, further increase of argon gas also requires more energy to ionize, so the threshold power becomes higher again. Yet, the downward threshold power remains constant under different gas pressures indicating that it is not required higher power to maintain the blue core mode once the jump is made.
To further investigate the variation of the density in the device at different power levels,power scanning experiments were conducted and the results are shown in figure 7(b).Under 4 Pa argon pressure,a power scan is performed and the plasma density is measured at the location of the red dashed line as shown in figure 7(a).The dashed line in red is located at 185 mm,and the blue dashed line is at 235 mm.The results in figure 7(b) show that there are three discharge modes, and the low to high power discharge modes correspond to the E→H→W mode. Discontinuous density jumps are the feature that separates the modes from each other.
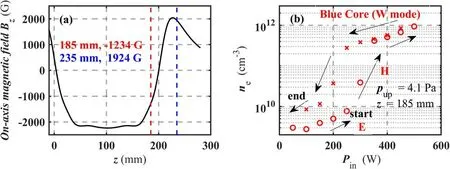
Figure 7.(a)The distribution of magnetic field on axis of PMs.The magnetic fields at 185 mm and 235 mm are shown as red and blue dashed lines, respectively. (b) The variation in plasma density with power scanning under 4.1 Pa and at a position of 185 mm axial distance. The circle represents the density measured in the case of upward scanning power and the cross indicates the density measured in the case of downward scanning power.
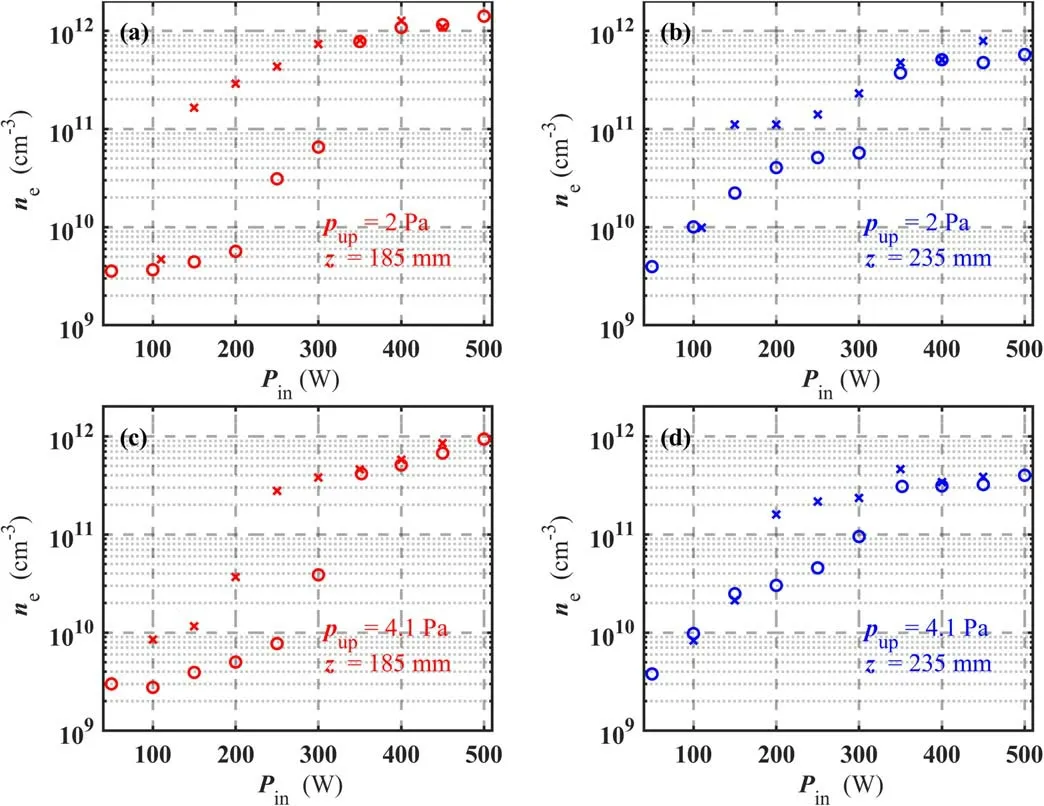
Figure 8.The functions of plasma electron density with RF power are shown in(a)-(d)under different cases.The axial positions at 185 mm and 235 mm are shown in red and blue,respectively.The circle indicates the density measured in the case of upward scanning power and the fork indicates the density measured in the case of downward scanning power.
The power scans were performed for different positions and different gas pressures, and the corresponding plasma density variations are shown in figure 8.From the comparison of figures 8(a)-(d), At the same neutral gas pressure, the z = 235 mm position is also in the area of magnetic field dispersion, and the mode jump here is not as obvious as the mode jump at z=185 mm.Possible reasons for this situation are as follows: the tangential magnetic field confines the plasma and particles cannot diffuse into the magnetic field dispersion region under low power and low pressure.Regardless of E or H mode,for both gas pressures,the density measured in the downstream (z=235 mm) region is higher than that in the upstream (z=185 mm) region; while in W mode, the density measured in the upstream (z=185 mm)region is higher than that in the downstream (z=235 mm)region. This reflects that at W mode power tends to be coupled to the dense plasma within the internal magnetic field of PM but in E and H modes there is a different spatial preference about power coupling. This work focuses on the W mode discharge and the E and H modes’discharges are out of scope of this work. The reason behind the different power coupling tendencies needs further investigations. In figure 9,it shows a partial spatial distribution of electron density along axis. The electron density increases slowly with the increase of the z distance,however,the electron density decays sharply outside the zero magnetic point (z>204 mm), that is, the region of divergent magnetic field. This also means that the length of the plasma is confined within the boundaries of the magnetic field,limited by the length of the PMs regardless of pressure.
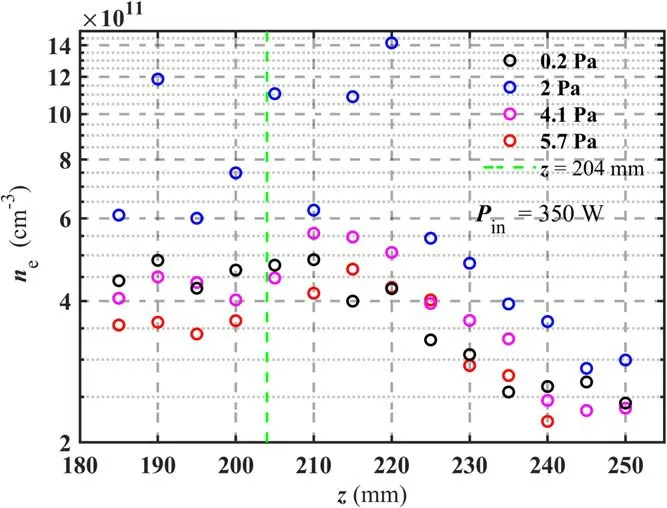
Figure 9. The distributions of electron density of blue core plasma are measured along axis under different gas pressures with RF power of 350 W. The position of zero magnetic point is located on central axis of 204 mm in green dashed line.
4.2. The wavelength of helicon wave

5. Conclusion
A more compact helicon plasma source device was developed and the blue core plasma discharge was successfully excited.Density measurement of operational parameter sweep, such as power scan and pressure scan, and discharge characteristics obviously show the characteristics of helicon wave plasma.According to the density on axis,the length of the plasma is not as long as the entire device. The wavelength calculated as dispersion relation of bounded whistler waves is orders of magnitude longer than the length of plasma in this device. However,the wavelength calculated by the unbounded whistle wave dispersion formula shows the order of magnitude agreement.
Acknowledgments
This work is supported by National Natural Science Foundation of China (No. U19A20113).
猜你喜欢
杂志排行

Plasma Science and Technology的其它文章
- Degradation of tiamulin by a packed bed dielectric barrier plasma combined with TiO2 catalyst
- Improvement of the spreading effect of atmospheric pressure microplasma jet treatment through shielding-gas-controlled focusing
- Efficient direction-independent fog harvesting using a corona discharge device with a multi-electrode structure
- Experimental study on surface arc plasma actuation-based hypersonic boundary layer transition flow control
- Microchannel cooling technique for dissipating high heat flux on W/Cu flat-type mock-up for EAST divertor
- Implementation and application of PyNE sub-voxel R2S for shutdown dose rate analysis