Dynamic development model for long gap discharge streamer-leader system based on fractal theory
2022-08-29JianghaiGENG耿江海QuanshengWANG王权圣XiaominLIU刘晓敏PingWANG王平FangchengLYU律方成andYujianDING丁玉剑
Jianghai GENG (耿江海), Quansheng WANG (王权圣) ,Xiaomin LIU (刘晓敏), Ping WANG (王平), Fangcheng LYU (律方成) and Yujian DING (丁玉剑)
1 Hebei Provincial Key Laboratory of Power Transmission Equipment Security Defense, North China Electric Power University, Baoding 071003, People’s Republic of China
2 China Electric Power Research Institute, Beijing 100192, People’s Republic of China
Abstract Establishing a long air gap discharge model considering the streamer-leader transition and randomness of the discharge path is of great significance to improve the accuracy of discharge characteristic prediction and optimize external insulation design. Based on fractal theory and thermal ionization theory of streamer-leader transition, this work establishes a dynamic development model for the long air gap discharge streamer-leader system, which includes streamer inception, streamer development, leader inception, development of streamer-leader system and final jump. The positive discharge process of a 3 m rod plate is simulated to obtain the fractal distribution of the discharge path and the law of leader development for comparison with the discharge test results.The results show that the simulation model is similar to test results in the development characteristics of leader path distribution,each stage time and leader velocity.Finally,a simulation calculation of a 50%breakdown voltage of the rod-plate gap and ball-plate gap is carried out, with results fairly consistent with test data, proving the effectiveness and practicality of the model.
Keywords: long air gap, fractal theory, thermal ionization, streamer-leader system, simulation model
1. Introduction
As the core part of the converter station of a DC transmission project,the valve hall is a closed space with multiple voltage levels and complex air gap types. The selected gap distance determines the operational reliability of related equipment,but many long gap discharge characteristic tests with huge costs are required. Therefore, predicting discharge characteristics through a long air gap discharge simulation model is helpful in order to save test costs, optimize insulation design and improve the economic efficiency and safety of a DC transmission project [1-3].
Aiming at the physical mechanism of each long gap discharge stage, domestic and foreign scholars put forward simplified models of each stage based on a large number of test results. Bondiout and Gallimberti proposed a positive rod-plate gap discharge model to describe each stage of long gap discharge [4] and calculated the streamer current using the equivalent electron avalanche model, Goeliany et al calculated the space charge quantity using the distortion of space potential and simulated the gradual development of a streamer-leader system [5]. Subsequently, Becerra and Cooray optimized the charge distribution in the streamer zone and simulated the space charge using several ring charges with different radiuses [6]. In [7], the critical volume method is adopted to consider the dispersion of streamer inception and a space charge model considering the variable form of the streamer zone is established based on the charge simulation method, and a separately developed discharge path is simulated. The above models have realized simulation of the whole discharge process by calculating key physical parameters in each discharge stage but ignored the influence of discharge channel branch distribution and space charge distribution.However,the discharge channel branch distribution,especially the branch structure of the streamer zone, will affect distribution of the electric field in space [8], affecting the development of the leader channel and resulting in errors between simulation results and test values.
In order to simulate the branching phenomenon in the streamer discharge process, domestic and foreign scholars have established various streamer discharge models based on fractal theory. Among them, the most classic fractal models are the DBM model [9] and WZ model [10], considering the influence of electric field distribution and random factors on streamer development. Reference [11] applied fractal theory to the simulation of a long gap discharge path and assumed that the streamer and leader are conductive channels with different conductivities. Reference [12] proposed a streamer growth probability model combined with the streamer discharge theory and fractal theory to simulate the space charge accumulation process with time in the streamer zone. Reference [13] presented an advanced 3D numerical model of lightning development using fractal theory, which has features such as bidirectional propagation and simultaneous growth of multiple branches. In a subsequent work, [14]studied the progression of negative lightning stepped leader including stepping and branching.This kind of model focuses on branch development characteristics of the simulation path and distribution of the predicted discharge path. It does not include the physical process of development of the streamerleader system.Therefore,it is difficult to predict the discharge characteristics.
References [15, 16] proposed a transport model of discharge in a thunderstorm cloud, in which the probability of the emergence of streamers is considered in a new method,and the leader channel is formed by combining the currents of tens of thousands of streamers. This model combines the advantages of the two models mentioned above, and its morphology and electrical parameters of the calculated discharge tree agree with the existing lightning-discharge data.However,the simulated lightning discharge is different to the typical air gap discharge in transmission engineering in terms of gap size and voltage type.
Therefore, in view of the shortcomings of the models above, this work establishes a dynamic fractal development model of long gap discharge, which includes streamer inception, streamer development, leader inception, development of a streamer-leader system and final jump based on the basic principles of fractal theory and thermal ionization theory of streamer-leader transition. This aims at the physical mechanism and random development characteristics of discharge paths in the long gap discharge process.First,a 3 m rod-plate gap discharge process was simulated and a long gap discharge test was carried out. Then, the simulated discharge path distribution and characteristic parameters of each stage were verified using the test results. Finally, the U50%breakdown voltages of the rod-plate gap and ball-plate gap were calculated,respectively,based on the model in this work,and the effectiveness and practicality of the model were verified.
2. Dynamic fractal development model for long gap discharge
Long gap discharge includes ionization and energy conversion processes with randomness. Based on the above characteristics, this work establishes a model for the long gap discharge development process, which considers the dispersion of streamer inception time delay according to critical volume theory,simulates the fractal development of streamers and leader development path based on fractal theory, and determines streamer-leader transition and development based on thermal ionization theory, to realize a whole process simulation of dynamic fractal development for long gap discharge.
For the rod-plate gap structure shown in figure 1, the air gap is divided into M×N square grids with side length h,the rod electrode length is set as L and the gap distance is set as H in the fractal development model. The spatial potential φ of each grid point is obtained using the finite difference method:the potential of a grid point outside the discharge channel conforms to the results obtained from the Laplace equation;the potential inside the channel conforms to the results obtained from the Poisson equation:

where ρ is the charge density inside the channel and ε0is the vacuum dielectric constant. The boundary conditions are set as follows: the potentials of the rod electrode and plate electrode are the first boundary conditions, and the electrode potential is equal to the applied voltage U0(t);the boundary in contact with the air in the solution area is the second boundary condition.
2.1. Streamer inception
Under the action of positive switching impulse voltage, the inception time delay of streamer t includes the boosting time delay t0required for boosting the critical electric field Ecof streamer inception and the statistical time delay tsrequired for the emergence of effective free electrons, among which the statistical time delay is one of the main factors leading to the dispersion of discharge inception.

Figure 1. Grid division diagram of the rod-plate gap.
According to the classic streamer theory, free electrons collide with air molecules in the process of moving towards the electrode under the action of electric field force in a strong electric field area where the ionization coefficient of electron collisions near the electrode head is greater than the attachment coefficient, resulting in an initial electron avalanche. When the positive charge generated by the initial electron avalanche is enough to support the formation of a secondary electron avalanche and realize the self-sustaining development of the discharge,the streamer incepts;that is,the boosting time delay t0.

where Ncritis the critical positive charge quantity, that is,Ncrit=0.55×10⁸; α is the ionization coefficient of electron collision and β is the electron attachment coefficient, both of which are functions of electric field intensity. R0is the boundary of the collision ionization zone, where α(Ec)=β(Ec), and Ecis the critical field intensity of the collision ionization zone.
According to the critical volume theory of streamer inception,when the electric field intensity of the electrode head reaches E0,effective free electrons will be generated in a critical volume before streamer inception. At ts, the occurrence probability of effective electrons is proportional to the critical volume and voltage change rate, the statistical streamer inception time delay tscomplies with Rayleigh distribution,and its probability density function is as follows [17]:

where k is the function of voltage change ratio and critical volume.Since the radius of the electrode will affect the critical volume,k finally represents the influence of the voltage change rate and electrode shape on the occurrence frequency of effective electrons, and its empirical formula can be obtained by fitting the experimental data.
After the boosting time delay t0is obtained using formula(2), the statistical time delay tsis calculated according to the probability distribution of streamer inception, and the streamer inception time delay t is obtained.
2.2. Streamer development
After the inception of initial streamers, a point in the critical volume of the electrode rod head is randomly selected as the development point of the initial streamers.
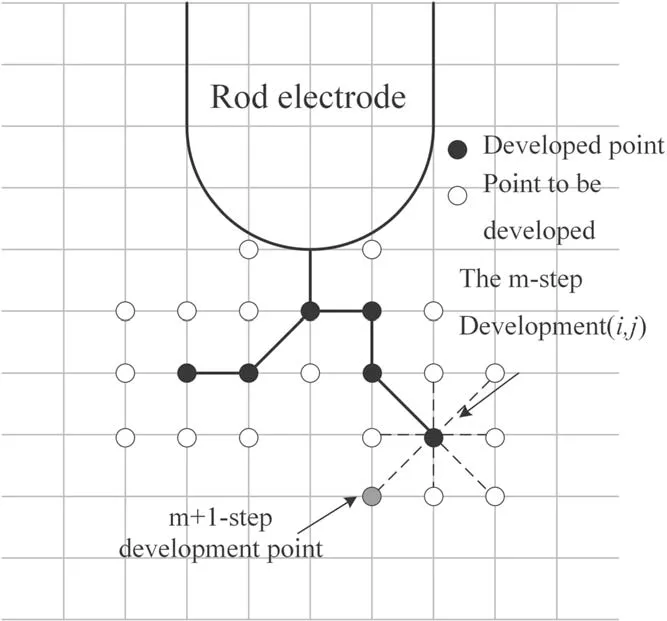
Figure 2.Schematic diagram of the streamer growth probability model.
When calculating the development in the step m+1 of the streamers, the grid points surrounding them in which the electric field intensity is greater than Ecare selected as the possible development points in step m+1 for all spatial points that have become streamers, as shown in figure 2.
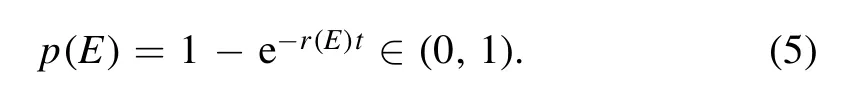
Assuming that the time tirequired from the emergence of secondary electrons from a point to be developed (i, j-1) to the formation of a streamer channel with the developed point(i, j) satisfies the Weibull distribution, the probability density of the time required for each development step of the streamer p(t) is,

where r(E) is a streamer growth probability function. Then,the probability of the next formation time tiof the streamer p(E) is,
Assuming p(E)=ξ, ξ is a random number from 0 to 1 that complies with uniform distribution, tican be expressed as,

According to the Biller model [18],
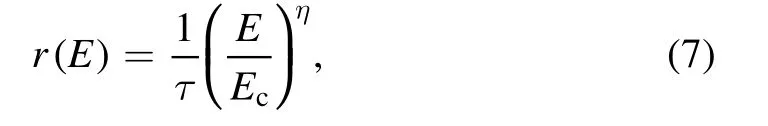
where τ is the formation time constant and τ=2 μs is taken in this simulation, E is the electric field intensity at the point to be developed, η is the development probability index representing the relationship between discharge development probability and electric field intensity (its value is related to voltage type and electrode shape) and η=2 is taken in this simulation.
When there are n possible points to be developed in the streamer zone,the formation time ti(0<i≤n)of the points to be developed is calculated in turn, and the point to be developed with the shortest formation time is set as the streamer development point in step m+1 and the shortest formation time is the time step tm+1of this step.
The long gap discharge test shows that the average electric field intensity Esin the streamer zone is about 400-500 kV m-1,so the electric potential of each point in the streamer zone can be obtained using formula (8), and the calculated electric potential is set as the first boundary condition:
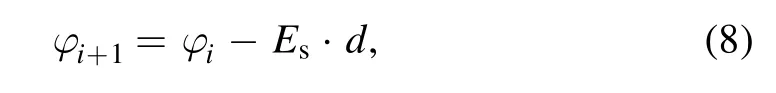
where 1≤i≤m+1, d is the streamer length developed in step i+1 and φ1is the applied voltage U0(t) to the electrode rod.
The Poisson equation is solved by the finite difference method to obtain the spatial potential distribution, and the charge quantity and current of the streamer channel are obtained by combining the current continuity equation and Ohm’s law. After discretization, the relationship between potential and charge is obtained as follows [12]:
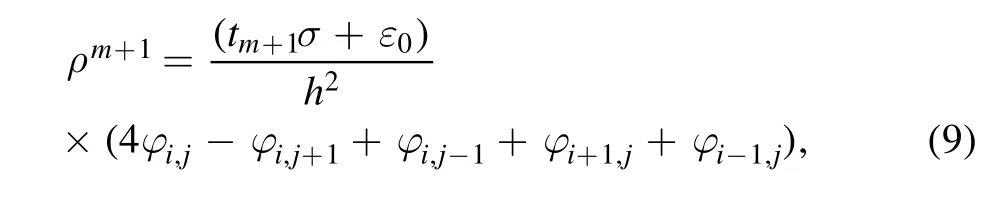
where tm+1is the development time of the streamer in step m+1, σ is the conductivity of the streamer channel and σ=0.025 S m-1is taken in this simulation.
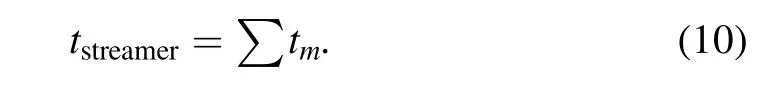
The total development time tstreamerin the streamer zone is,
In the streamer development process, when there are no points to be developed around all developed points, it is considered that the streamer stops developing, and if the electric field around the developed points still does not meet the requirements of critical field intensity Ecwith the rise in voltage, it is considered that the discharge is over.
2.3. Leader inception
According to the thermal ionization theory for streamer-leader transition, when the streamer develops rapidly, a quantity of free electrons generated by the streamer branches enters the electrode along the common origin of the streamer branches.In the streamer root transformation zone, part of the energy generated by elastic and inelastic collisions between electrons and gas molecules is directly used for temperature rise,and another part of the energy stored in the form of electronic excitation energy, rotational kinetic energy, translational kinetic energy and vibrational kinetic energy is used to transfer the gas molecules, both of which jointly contribute to the temperature rise of gas molecules [19]. When the temperature of the streamer root reaches the critical temperature Tc=1500 K,negative ions decompose under the action of the thermal ionization mechanism,forming a large number of electrons and neutral molecules,making the conductivity in the streamer root transformation zone increase sharply [20]. Therefore, the streamer root is transformed into the initial leader.
In the simulation, the vibrational kinetic energy Wv,translational kinetic energy Whand translational kinetic energy temperature Th[4] of the streamer root are calculated according to Gallimberti’s energy balance equation after each step of streamer development. When the temperature Th>1500 K,it is considered that the leader is generated and the streamer branches disappear.
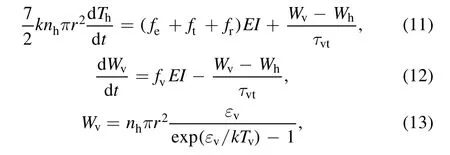
where k is the Boltzmann constant,nhis the molecular density of gas, fe, ft, frand fvare the distribution coefficients of electronic excitation energy,translational kinetic energy,rotational kinetic energy, and vibrational kinetic energy, respectively. In the simulation, fe+ft+fr=0.03 and fv=0.97, E is the field intensity at the streamer root and I is the current intensity flowing through the streamer root, τvtis the conversion time from vibrational kinetic energy to translational kinetic energy(the simulation uses τvt=5 μs), r is the initial radius of the streamer branch root(300 μm is taken in the simulation),εvis the energy required for vibration excitation of nitrogen molecules (0.28 eV is taken in the simulation) [19].
Due to the inhibitive effect of distorted electric fields caused by the residual positive charge in space, the initial pilot cannot be developed immediately after being generated.At this time,the field intensity of the leader head is the sum of the background field intensity and the distorted field intensity caused by the space charge. In order to consider recovery of the electric field of the leader head, the conditions of initial leader inception are determined using formula (2). When the electric field of the leader head is recovered enough to meet the requirements of the field strength of streamer inception,the leader can be developed further.
2.4. Streamer-leader development system
After leader inception,the leader head generates a new streamer zone, guided by the head streamer branch; the streamer-leader system develops continuously. In the development process,electrons generated in the streamer zone transfer energy to neutral molecules in the transformation zone. When the temperature of the gas molecules reaches critical temperature Tc,it is considered that the main streamer channel is transformed into a new leader.The field intensity in front of the channel increases,which further promotes development of the streamer zone.Therefore, the streamer-leader system can develop on its own.
In the simulation, the development process of the leader head streamer zone is consistent with section 2.2. The streamer root develops from the head of the new leader section.It is the first condition for temperature to reach Tcin order to achieve leader development.
When selecting the leader channel, this model uses the leader head as the starting point,then selects the path with high charge density in the streamer zone as the leader development channel, and notes that the length of the ith leader microelement segment converted from the streamer in the path is li,and the total length of each newly developed leader segment is L=∑li. When the amount of charge qLrequired for the development of the leader channel per unit length is shown in a formula(14),it meets the second condition ΔQ≥LqL,that is,the amount of charge generated in the streamer zone is sufficient to support generation of this section of the leader into leader development. If the condition is not met, the streamer region continues to develop until a sufficient amount of charge is generated to support leader generation.where Kgis the leader shape coefficient,which is taken as 0.38 in simulation,tstreameris obtained using formula(8),andΔThis the difference between thermal ionization temperature and room temperature.

The electron charge entering the leader head is the total amount of ionized electrons in the streamer zone, and the current Ilinjected into the leader head is expressed as,

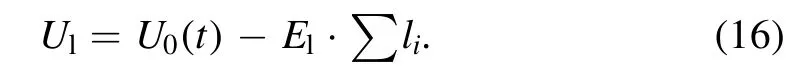
In the streamer-leader system development process, the leader channel is regarded as a conductor with a voltage drop,and the streamer zone is a weak plasma channel with a multibranch structure. In the simulation, the leader channel radius is 1.0 mm and the average field intensity Elin the leader channel is 0.5 kV cm-1.
The leader head potential can be expressed as,
The calculation steps of potential in the streamer zone are consistent with section 2.2.
Considering the influence of current,the velocity v of the leader is expressed as [21],
Then, the growth time tstepof each step of the streamerleader system can be calculated:

where tleaderis the leader development time.
2.5. Final jump
During the development of the streamer-leader system, a large number of free charges accumulate in the air gap, and the streamer area gradually increases until the streamer extends to the plate electrode at a certain moment,the final jump of the leader occurs,then the gap breaks down, and the simulation process stops.
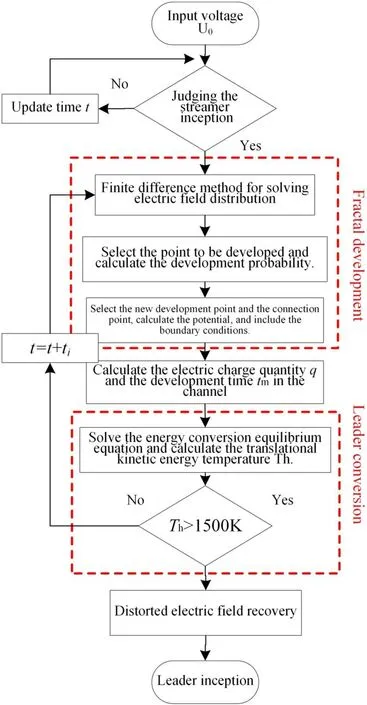
Figure 3.Flow chart of leader initiation.
After the streamer develops to the plate electrode, the leader channel and streamer are transformed into an electric arc channel with higher conductivity and higher temperature within a very short time. Therefore, only the development time of the streamer region tstreameris calculated.
2.6. Simulation procedure
The leader inception simulation procedure is shown in figure 3.First, the simulation applies operational impulse voltage U0(t) to the electrode and solves the potential and electric field distribution.Then, the streamer inception conditions are determined through formula(2)and the streamer inception time delay is calculated in combination with formula (3). According to the fractal development model of a streamer, the voltage boundary conditions are updated, the simulation streamer develops step by step, and the accumulation amount and development time of each step are recorded. After streamer development stops, the translational kinetic energy temperature of the streamer root is solved according to the energy balance equation of streamer root. If the temperature reaches the critical temperature of 1500 K, the streamer will be transformed into the initial leader.As the voltage continues to rise,the initial leader head electric field is recalculated, and the leader starts to develop when the electric field restores to the critical field intensity E0at the start of the streamer.
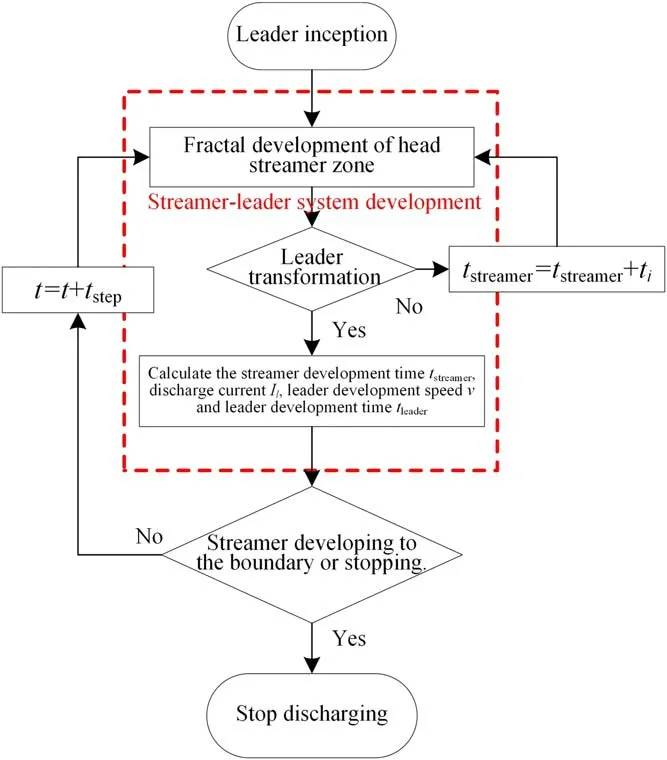
Figure 4. Flow chart of streamer-leader development.
After leader inception, the development of the streamerleader system is simulated in each step, including the fractal development of the streamer zone and leader transformation.Then, the physical parameters are calculated, such as the potential of the leader head and development time, as shown in figure 4. When the leader head streamer zone develops to the plate electrode, the leader has a final jump, followed by gap breakdown. During the simulation, if the streamer zone stops developing, it is considered to be gap tolerance.
3. Model simulation results and verification
According to the above simulation flow,the discharge process of a 3 m rod-plate gap was simulated under operational impulse voltage.The rod electrode length L was set to be 1 m,and the curvature radius of the head was set to be 2 cm while the gap distance H was 3 m and a standard operating shock wave with the peak value of 1000 kV was applied to the rod electrode. Typical simulation results are shown in figure 5.
In this simulation, the inception time of the initial streamer is t1=20.32 μs, in which the statistical time delay ts=5.43 μs. At t2=26.57 μs, the initial streamer stops developing and turns into a leader. However, due to the shielding of space charge, the leader develops again at t3=33.64 μs and moves to the plate electrode. The leader head streamer reaches the plate electrode at t=114.43 μs,and then gap breakdown occurs.
3.1. Analysis of discharge characteristics
To verify the effectiveness of the simulation model,we built a rod-plate long air gap discharge observation system,as shown in figure 6. In the system, a high-speed camera is used to photograph the optical shape of the positive leader discharge channel, and a photomultiplier tube (PMT) is used to synchronously measure the instantaneous optical power in the discharge process, and each discharge stage is determined through the optical image and amplitude of optical power. In the test, a 6000 kV/450 kJ impulse voltage generator is used to apply the operational impulse voltage with the waveform of 250/2500 μs to the rod electrode, and the measurement accuracy of the capacitor voltage divider is 0.5%. The rod electrode is a 6 m long metal rod with a curvature radius of 2 cm. The ground electrode is a galvanized iron plate 11 m×11 m. In the test, three model H10721-210 PMTs are used,with a sampling frequency of 159 MHz(response speed of 6.29 ns)The PMTs are respectively placed at points 1.3 m from the gap axis, 1, 1.6 and 2.6 m from the ground. A Photron Fastcam SA5 high-speed camera is used, and the photographing speed is 7.5×10⁴fps (photographing time interval is 13.33 μs). In order to achieve synchronous triggering of observation equipment, a Teledyne Lecroy 3024 oscilloscope is used to collect the voltage signal from the capacitor voltage divider as the trigger source. When the amplitude exceeds the trigger level, the oscilloscope synchronously collects the voltage signal, and the instantaneous optical power signal triggers the high-speed camera to photograph, and the delay time of each item of equipment meets the synchronous triggering condition [22].
U50%is applied to the 3 m rod-plate gap for 40 repeated tests, and a typical test result is shown in figure 7.
According to figure 7(a), the simulation results of leader discharge have high similarity with the optical images obtained from the test, which shows that the model in this paper is effective for predicting the discharge path.
By comparing the high-speed image with the instantaneous optical power, each stage of the test discharge process is divided. PMT is more sensitive to the optical signal of the discharge process and higher in time resolution. Therefore,each stage of discharge is divided by the change in optical power in different stages.
It can be seen from figure 7 that the initial streamer incepts at t1=11.38 μs, the optical power collected by PMT1 jumps with an amplitude of 200.8 pW,then the optical power gradually decreases and enters the dark period at t2=14.01 μs. At t3=19.47 μs, the optical power jumps again, indicating generation of the leader, and the high-speed camera captures the leader image at 28.04 μs. With development of the leader head, the optical power collected by PMT1 increases rapidly,exceeding the measured amplitude at t4=32.64 μs.It is considered that the leader has reached the position of PMT1.The development position and stage of the leader head can be determined by three saturation moments of PMT optical power. In the leader development stage, the leader develops 1 m downwards through T1=65.61 μs, and the average axial velocity is 1.52 cm μs-1. At the final jump stage, the leader reaches PMT3 through T2=65.61 μs, and the average velocity is 25.1 cm μs-1. Based on the optical observation results of the high-speed camera, the comparison between the position of the leader head in the 3 m gap and the simulation results is shown in figure 8.According to the above analysis, the simulation and test have similar results in leader path distribution, each stage time and leader development.
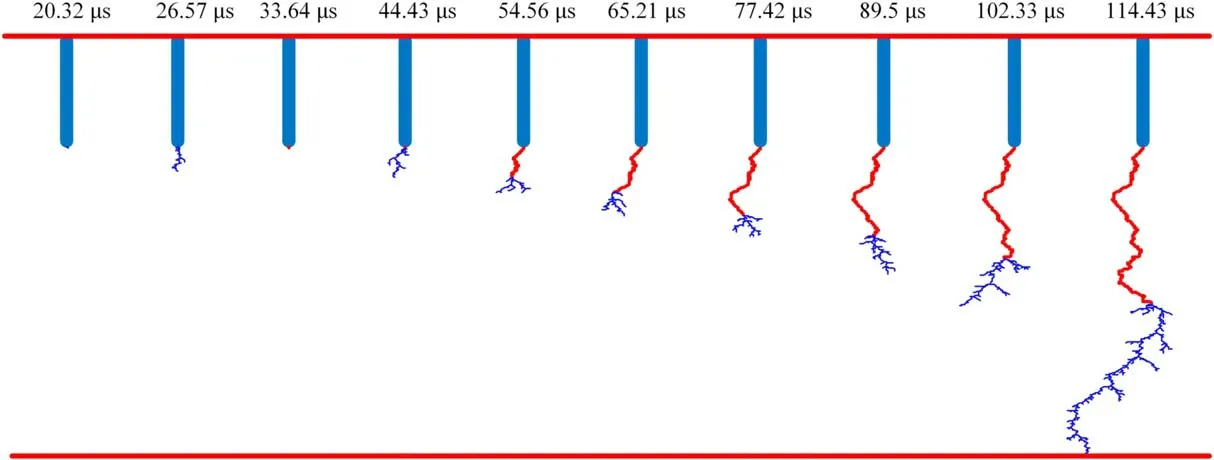
Figure 5. Typical process simulation chart of leader discharge development in 3 m rod-plate gap.
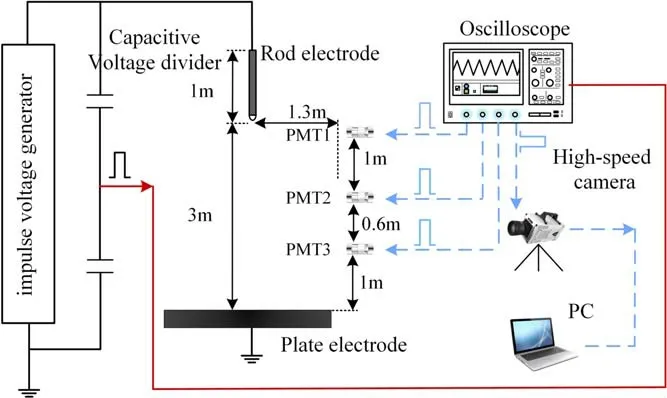
Figure 6. Layout of the long gap discharge observation system.

Table 1.Comparison of the simulated results and experimental values for 3 m gap discharge.

Figure 7.(a) Optical image of the discharge process and (b) change in optical power during discharge.
Under the same simulation parameters, the leader development simulation is carried out many times and compared with the 40 test results. The comparison of physical macroscopic characteristics in the discharge process of a 3 m rod-plate gap is shown in table 1.
From the table, it can be seen that the rod-plate gap has strong randomness and dispersion in discharge,but on the whole,the simulation results have good agreement with test results in leader development characteristics, such as breakdown time,leader velocity, charge accumulation, discharge current, etc,and the model has high rationality, in which the statistical time delay is 1.8-24.6 μs,duration of the dark period is 4.2-17.8 μs,leader velocity is 1.4-2.0 cm μs-1, final jump velocity is 14.5-32 cm μs-1, charge density of the leader channel is 42-57 μC m-1and leader discharge current is 0.5-1.4 A.
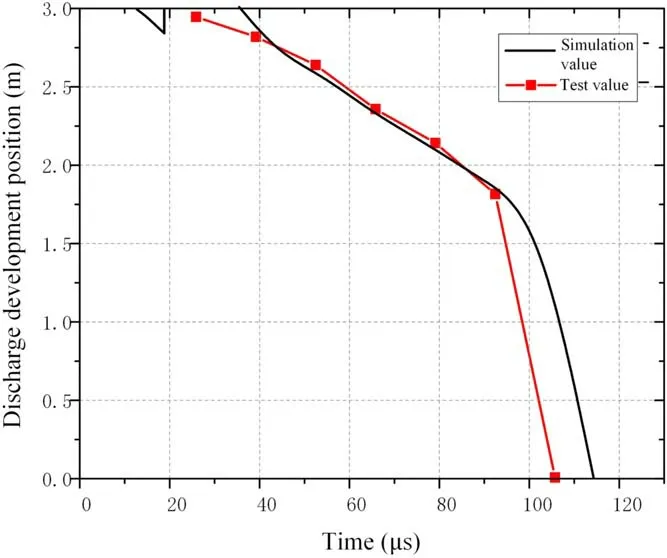
Figure 8. Streamer-leader development position.

Figure 9.Comparison of breakdown voltage.
3.2. Breakdown voltage prediction
In order to further verify the effectiveness of the simulation model and achieve prediction of breakdown voltage of the classic external insulation gap in power transmission and transformation projects,the U50%breakdown voltage of rod-plate gap and large-size ball-plate gap is simulated and calculated in this work, and compared with test results and the empirical formula[24] based on the gap coefficient method proposed by Paris. In the simulation, the gap distances with different lengths are set,250/2500 μs standard operation impulse voltage with positive polarity is applied to the rod electrode with a radius of 2 cm and the ball electrode with a radius of 1 m. The different gaps are simulated 30 times using a boosting method, respectively. The results are shown in figure 9.
It can be seen from figure 9 that for the simulation of the rod-plate gap,the simulation value is similar to the test value and empirical formula. With the gap length increasing to 10 m,the maximum error reaches 5.5%;for the ball-plate gap,and the error between the simulation value and the test value is 4.6%-7.1%. For simulation of long gaps in large electrodes, the simulation value is generally higher than the test value.This is mainly because in practical simulation,in order to save calculation time and running memory,the subdivision size of the mesh is enlarged, which leads to a decrease in accuracy. However, the error is still within an acceptable range.This further illustrates the rationality and practicality of this model for the simulation of long gap discharge since the model not only simulates the physical process of discharge,but also predicts the breakdown voltage of the insulation gap.
4. Conclusion
Aiming at two characteristics, namely randomness and leader transformation of the long gap discharge path, this work establishes a dynamic development model for a long gap discharge streamer-leader system based on fractal theory and thermal ionization theory to provide a new path to study the randomness of long gap discharge paths and the law of discharge development.
(1) The streamer-leader system in the model illustrates the development of a streamer zone and generation of space charge in the form of fractal development, which facilitates analysis of the guiding mechanism of streamer branch to leader path in the discharge process.(2) Through the model established in this work, the leader discharge process of a 3 m rod-plate gap is simulated to obtain the dark period time of 4.2-17.8 μs, breakdown time of 96.3-115.6 μs,leader velocity of 1.4-2.0 cm μs-1and final jump velocity of 14.5-32 cm μs-1. In addition,the rationality of the simulation results is verified through test results.(3) According to the model in the paper, the U50%breakdown voltage of the rod-plate gap and ball-plate gap is simulated and calculated, and the calculation results are highly consistent with test results and empirical formulas.This shows the practicality of the model in this paper in predicting the breakdown voltage of typical gaps in power transmission and transformation projects.
Acknowledgments
This work is supported by the Natural Science Foundation of Hebei Province (No. E2021502025).
ORCID iDs
Quansheng WANG (王权圣) https://orcid.org/0000-0001-9321-3758
猜你喜欢
杂志排行

Plasma Science and Technology的其它文章
- Degradation of tiamulin by a packed bed dielectric barrier plasma combined with TiO2 catalyst
- Improvement of the spreading effect of atmospheric pressure microplasma jet treatment through shielding-gas-controlled focusing
- Efficient direction-independent fog harvesting using a corona discharge device with a multi-electrode structure
- Experimental study on surface arc plasma actuation-based hypersonic boundary layer transition flow control
- Microchannel cooling technique for dissipating high heat flux on W/Cu flat-type mock-up for EAST divertor
- Implementation and application of PyNE sub-voxel R2S for shutdown dose rate analysis