Regulation of the intermittent release of giant unilamellar vesicles under osmotic pressure
2022-09-24QiZhou周琪PingWang王平BeiBeiMa马贝贝ZhongYingJiang蒋中英andTaoZhu朱涛
Qi Zhou(周琪) Ping Wang(王平) Bei-Bei Ma(马贝贝) Zhong-Ying Jiang(蒋中英) and Tao Zhu(朱涛)
1Key Laboratory of Micro-Nano Electronic Sensing Technology and Bionic Devices,Yili Normal University,Yining 835000,China
2School of Network Security and Information Technology,Yili Normal University,Yining 835000,China
3National Laboratory of Solid State Microstructures,Department of Physics,Nanjing University,Nanjing 210093,China
Keywords: osmotic pressure difference,membrane tension,pore,line tension
1. Introduction
Cells can transmit substances, energy and information across their phospholipid bilayer with the surrounding environment, enabling life activities to be coordinated.[1,2]External stimuli (pH value,[3-5]temperature, and osmotic pressure,[6]etc.) cause phospholipid redistribution in the membrane and reassembly in structure,which affects and controls the process of cell function.[7-9]It is still a challenge to understand the regulation mechanism of membrane reassembly under external stimuli.
Osmotic pressure is one of the important factors that regulate the function of cells in organisms.[10]For example, red blood cells expand and collapse in the lungs and kidneys due to continuous osmotic pressure changes.[11,12]Another case in point is the effect of the proton sponge,in which the drug is released into the cell in vivo via osmotic pressure.[13]At present,giant unilamellar vesicles(GUVs)with cell-like sizes are often used as a simplified model of the cell membrane to study cell responsiveness in a complex environment.[14]When GUVs are laid in a hypo-osmotic medium, lipid vesicles apply outward pressure on the membrane, causing the membrane to stretch and swell outward, giving rise to widening of the molecular gap of phospholipids and extension of the projected surface area.[15,16]If the pressure is large enough, the GUV membrane is damaged and ruptured and a single pore is formed.[17]Karatekinet al.reported that pore formation caused the rearrangement of phospholipid molecules to minimize hydrophobic tail exposure to water, which means that there is a force at the edge of the membrane. This is called line tension (γ),which drives the closure of the pore.[18]
A study by Ogle¸ckaet al.showed that GUVs underwent cyclic swelling and pore formation in the hypo-osmotic bath.Likewise,GUVs composed of phase-separated lipid mixtures displayed a cycle accompanied by phase behavior.[19]Imranet al.reported that the size of the hypo-osmotic environment had a significant effect on the cycle,such as the swell time and the amount of solute released through the pore.[20]However,it is unclear whether the important physical properties of GUVs(micrometers to tens of micrometers in size,[21]membrane permeability regulated by the cytoskeleton,[22]high viscosity caused by the crowded environment,[23]etc.) will affect the cycle of liposome and pore lifetimes under a hypo-osmotic medium. The related behavior and its internal mechanism need to be studied and analyzed.
Here, we studied the internal physical parameters that regulated the GUV cycle, based on fluorescence microscopy images which showed vesicle swell-burst and membrane pore open-close in the hypo-osmotic medium. The internal physical mechanism was analyzed by adopting the numerical analysis method. By changing the initial radius of the vesicle,the permeability of the membrane, and the viscosity of the solution,the quantitative relationships between the cycle time and the number of cycles,as well as pore lifetimes and number of cycles,were obtained. The results are helpful for understanding the cycle of GUVs in a hypo-osmotic medium and provide a reference for the design of controlled drug release of the liposome system.
2. Experimental details
2.1. Materials
The 1-palmitoyl-2-oleoyl-sn-1-glycero-3-phosphocholine(POPC)and 1-stearoyl-2-docosahexaenoylphosphatidylcholine(SDPC) were acquired from Avanti Polar Lipids. RhBPE (1,2-dipalmitoyl-sn-glycero-3-phospho-ethanolamine-N-(lissamine rhodamine B sulfonyl)) and Sulfo-Rhod (3-(4,5-dimet-hylthiazol-2-yl)-2,5-diphenyltetrazolium bromide)were acquired from Sigma. Glass slides coated with indium tin oxide (ITO) were acquired from Shenzhen Laibao Technology Co. Ltd. Sucrose, glucose, chloroform, and glycerol were acquired from Shanghai Hushi Corporation. The water was purified by a Milli-Q ultrapure water system (resistivity>18.2 MΩ·cm).
2.2. Electroformation of GUV preparation
GUVs were prepared using an electroformation technique.[24]Briefly, the chloroform solution consisted of POPC (or POPC: SDPC, 1:1, mol%:mol%) doped with fluorescent dyes (RhB-PE) of low concentration (1 mol%). A 3µL quantity of lipid solution was extracted to the ITO conductive surface and spread evenly, before being placed in a vacuum drying oven for 2 h. The silica gel was covered to form a compartment,and 0.2 M sucrose solution(or sucrose:glycerol, 3:7, v/v) was then added to the compartment. The vesicles were obtained by applying an AC current at 5 V and 10 Hz for 2 h.
2.3. Fluorescence microscopic characterization of GUVs
The morphology and solute leakage of GUVs were characterized in real time by an inverted fluorescence microscope(OLYMPUS IX81, 532 nm laser). A 2µL quantity of GUVs was diluted with 98 µL ultrapure water at room temperature(22°C).Then the appropriate volume of solution was quickly placed on the surface of the glass slides to obtain fluorescence images of the vesicle morphology and membrane pore(22 frames/s). The phospholipid membranes in the leakage experiment were not labeled with RhB-PE, and the hydrated solution was doped with 50µM Sulfo-Rhod.
3. Results and discussion
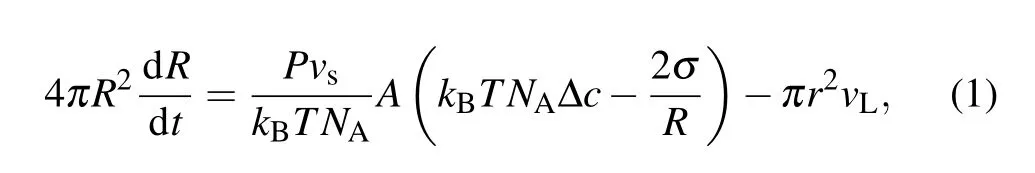
The dynamics of GUVs in the hypo-osmotic medium showed a swell-burst cycle (Fig. 1(a)). After the application of the hypo-osmotic solution, the difference in sucrose concentration on both sides of the membrane produced a chemical potential gradient.[25]Consequently,the external water molecules passed through the semi-permeable membrane to reduce the free energy of the system, leading to membrane swelling and a reduction in internal solute concentration(Fig.1(b)).Meanwhile,the membrane became thinner and the tension increased due to stretching.Considering that the membrane is a successive and closed thin shell,it can only extend to a certain degree. In addition, it is not allowed to support large membrane strains.[26]When the radius of the GUVs exceeded the critical value,the membrane burst by opening a single pore instantaneously.[27,28]We observed that there was an obvious non-fluorescent pore in the phospholipid membrane(Fig. 1(a)), at which time the membrane tension decreased,indicating remodeling of the membrane morphology; that is,the edge of the lipid molecules rearranged into a cylindrical shape, creating line tension (Fig. 1(c)). The end of a cycle was characterized as the closure of a pore. More importantly,the resealing of the pore is crucial for cell survival,otherwise the cells face death.[29,30]Subsequently, the remaining transmembrane osmotic pressure difference was used to repeat the swell-burst cycle. The repetitive intermittent release is advantageous for drug delivery,[31]such as insulin delivery in diabetes, thyroid hormone delivery in hyperthyroidism, etc.Therefore,it is necessary to study the biophysical factors regulating intermittent release.
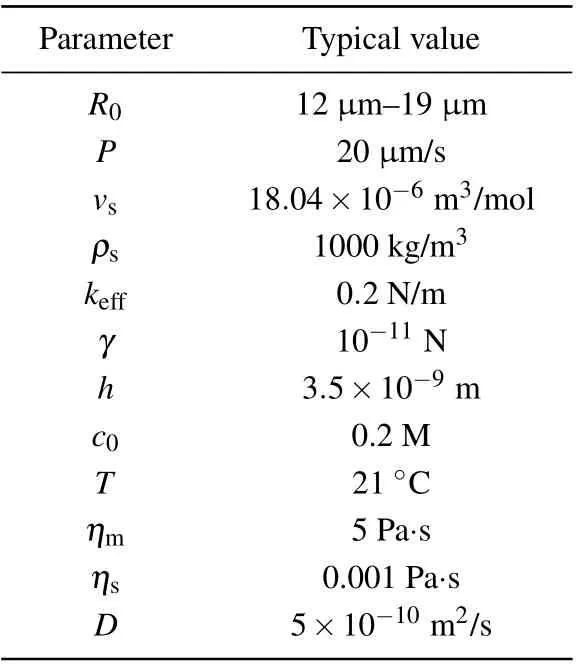
Table 1. Values of parameters in simulation.
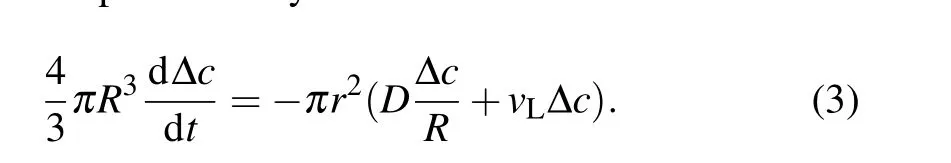
However, the swell-burst of GUVs is a highly dynamic process,which can be accomplished in a cycle during tens of milliseconds. It is difficult to make a quantitative and detailed analysis of the experimental results only through observation.Essentially,it involves a series of biophysical mechanisms that cooperate with this process as well. In this cycle, the volume change of GUVs depends on the inflow of water through the lipid bilayer of the membrane and the leakage of the pore.However,the internal driving mechanism is the specific imbalance between the osmotic pressure driven by the concentration difference (Δposm=kBTNAΔc)[32]and the Laplace pressure caused by the membrane tension (ΔpL=2σ/R).[33]As a result,the radiusRof GUVs can be represented as[34]
whereA=4πR2-πr2is the surface area of the membrane,Pis the permeability of the membrane,vsis the molar volume of solvent,andvLis the leakage speed of the solvent.
In the same way, our experimental observation of transient pore opening and closing seems to indicate an autonomous response. Its dynamics are controlled by the competition between the pore line tension and membrane tension generated by osmotic pressure. It is also related to the friction of pore and membrane(as well as the solution),which can be regarded as a damping system. Thus,the pore radiusrcan be represented by[18,27]
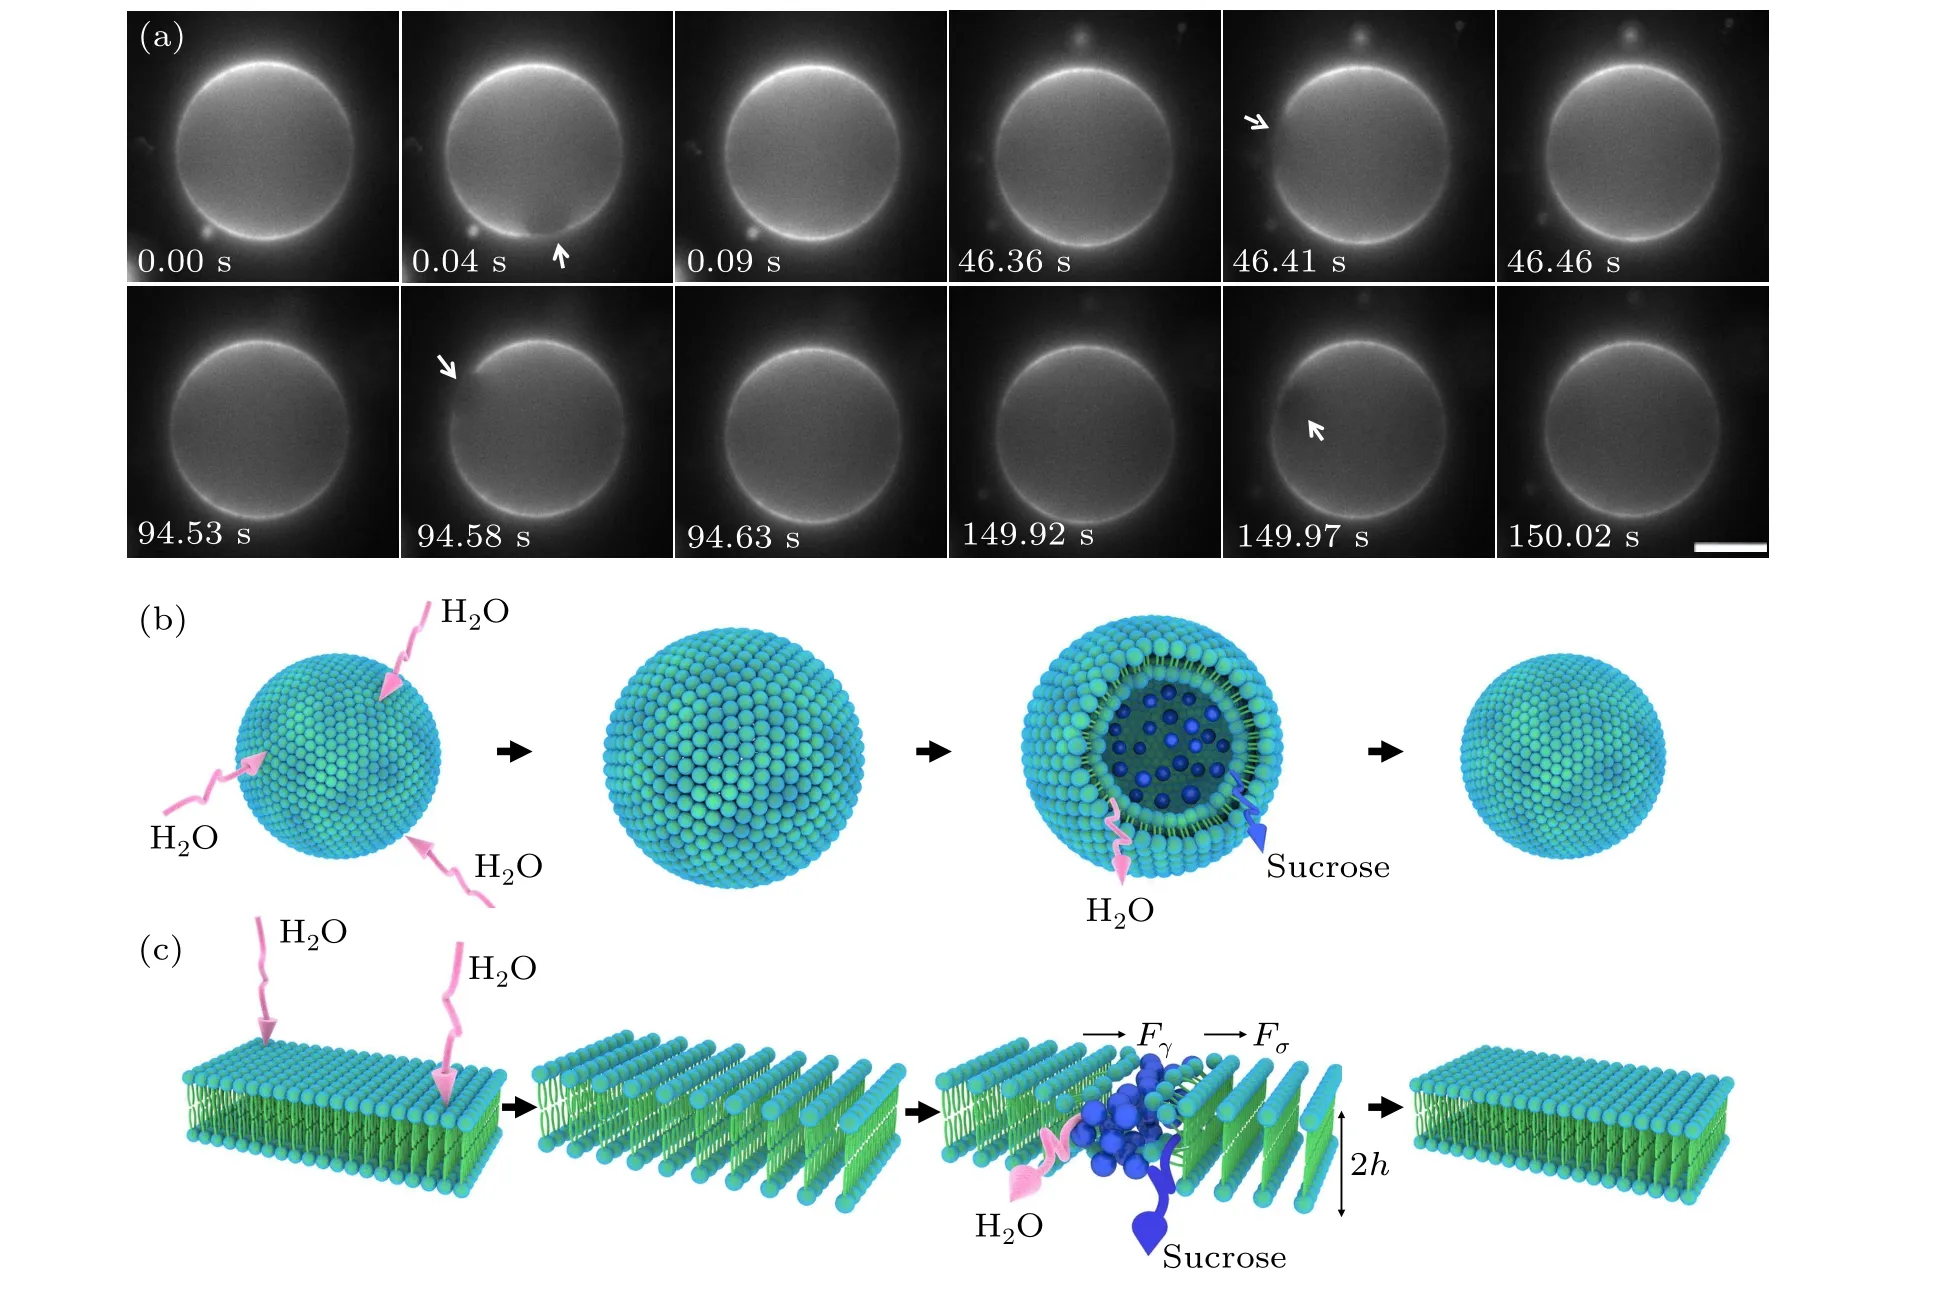
Fig.1. Swell-burst of giant unilamellar vesicles in the hypo-osmotic medium. (a)Micrographs of swell-burst cycles. These images showed the dynamics of four sequent cycles of GUVs,starting at 00:00 and ending at 02:30.02. The white arrows indicate the location of the pore,scale bars represent 5µm. (b)Schematic representation of a swell-burst cycle. The pink arrows indicate that water is permeating through the phospholipid bilayer,and the blue arrow indicates that the leakage of internal solute (blue sphere) through the membrane pore. (c) Schematic representation of the reassembly of phospholipid bilayer during the whole swell-burst cycle. Fσ is the driving force of the pore opening,Fγ is the driving force of pore closing,h is the thickness of liposome monolayer.
whereηmandηsdenote the viscosity of the membrane and solution,respectively,andCis the geometric constant(C=2π).Table 1 shows the typical values of the different parameters used in the theoretical model.
It is worth noting that the subsequent swell-burst cycles of GUVs gradually slow down, indicating that the driving force decreases with the end of each cycle. At present,a unique physical mechanism of solute outflow is needed to make the internal solute concentration change at the end of each cycle. It is also known that there are two types of solute molecule flow in GUVs: sucrose diffusion and solution convection through the pore. Thus,the solute concentration in GUVs can be represented by[35]
HereDis the diffusion constant of solute molecules.
Taken together, the swell-burst cycle of GUVs can be characterized by three differential Eqs.(1)-(3),which are the radius of GUVs,the radius of the pore,and the solute concentration of GUVs.
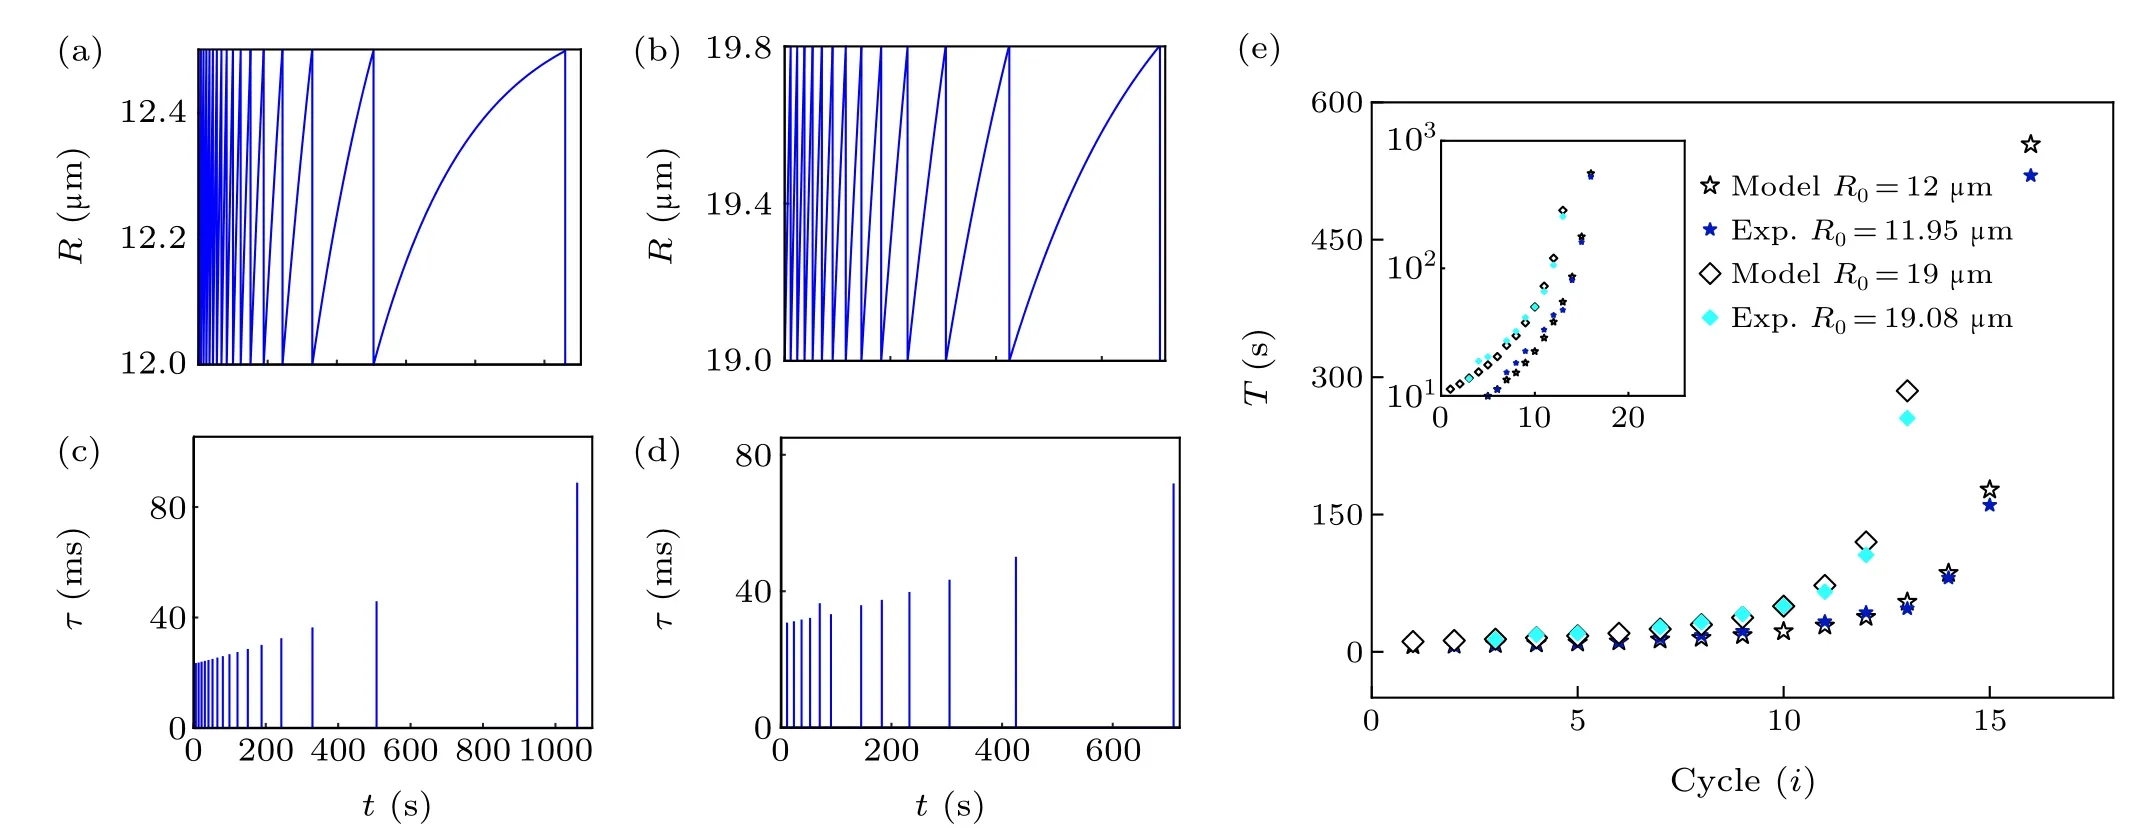
Fig.2. Influence of initial radius R0 of GUVs on the cycle dynamics. (a)Simulation curve of GUV radius change of R0 =12µm. (b)Simulation curve of GUV radius change of R0 =19µm. (c)Theoretical prediction results of pore lifetimes with time(R0 =12µm). (d)Theoretical prediction results of pore lifetimes with time(R0 =19µm). (e)Cycle time curve. The experimental points and theoretical prediction points are drawn in the figure for comparison.The illustration shows the y-axis data with logarithm,highlighting the exponential correlation.
Given the complexity of the GUV swell-burst cycle process, the controllability of the experiment and the adjustable parameters of the model should be taken into account. We discussed how the initial radius of GUVsR0, permeabilityP,and viscosityηsaffected the dynamics of the GUV cycle. By choosing different parameter values of GUV radius of 12µm and 19 µm (Pis 2×10⁻⁵m/s,ηsis 10-3Pa·s), the typical evolution of GUV radius and pore lifetime with time were obtained (Figs. 2(a)-2(d)). The GUVs with a smaller initial radius had a shorter cycle time and greater number of cycles(Figs. 2(a) and 2(b)). Due to the high area-to-volume ratio(Rs/Rv-1,whereRsandRvare the radius of a sphere with the same area and volume as the vesicle, respectively) of GUVs with a small initial radius, external water molecules rapidly permeated the vesicles, resulting in a high velocity of membrane swelling to reach the critical strain more quickly.[36]Furthermore, the numerical calculation suggested that both pore lifetimes had an increasing tendency(the maximum value was about 80 ms) (Figs. 2(c) and 2(d)), indicating that variation in the initial radius of GUVs was not enough to attain prolonged pore lifetimes. In addition, the cycle did not continue indefinitely,and the cycle time was an exponential function of the number of cycles. The reason was that solute leakage during the swell-burst cycle led to a gradual decrease in osmotic pressure difference, which eventually balanced the Laplace pressure and the residual osmotic pressure difference in the GUVs, thus preventing the cycle.[37]In the meantime,we chose the POPC GUVs encapsulated with sucrose(radii of 11.95µm and 19.08µm)from the hypo-osmotic experiments,likewise analyzing the relationship between the number of cycles and cycle time (Fig. 2(e)). The correlation coefficients were 0.99966 and 0.99947 respectively,which meant that the experimental data were well distributed around the theoretical simulation curve. The results contribute to understanding the size dependence of the response of the real cell to the hypoosmotic environment.
The permeability of cell membranes of different species is highly variable(plants have a high magnitude of permeability,while animals have a low magnitude of permeability),regulating physiological functions such as morphological evolution of the membrane and protein activity of the bio-membrane.[38]It can be seen from Eq. (1) that one of the factors affecting the solvent dynamics of GUVs is the membrane permeabilityP, which is the degree of across the membrane of water molecules. Next, we considered swell-burst cycles with permeability of 2×10⁻⁴m/s, 2×10⁻⁵m/s, and 2×10⁻⁶m/s,from whichi-Tcurves were obtained (Fig. 3(a)). It is worth noting that for GUVs ofP= 2×10⁻⁶m/s, the number of cycles required to reach balance was half that for GUVs ofP=2×10⁻⁴m/s. Since the GUVs had a large permeability,more water molecules were permeating across the membrane per unit time,[39]which sped up the swelling velocity, reducing the time used for one cycle. Consequently, the number of cycles was relatively higher. Noticeably,the cycle time increased with the number of cycles,and the GUVs with higher permeability had shorter cycle times for the same number of cycles. The results indicated that the cycle time was influenced by swelling velocity, which could be regulated via the permeability parameter.
Viscosity is one of the key biophysical parameters, and has been increasingly investigated. For example, people who suffer from heart attacks and strokes have a high level of blood viscosity.[40]From Eq. (2), we can see that the dynamics of pore radius have a certain functional relationship with viscosity. To explore the importance of theηsparameter on the swell-burst cycles, it was simulated at 10-4Pa·s, 10-3Pa·s,and 10-2Pa·s,respectively(Fig.3(b)). Then,we fitted the exponential distribution of the cycle time (T) with the number of cycles (i) (the indices are 1.176, 1.184, and 1.399, respectively). Based on the results,it can be seen that the cycle time increased due to taking the higher viscosity for the same number of cycles. The results revealed that the adjustment of the viscosity had an impact on the cycle time. This meant that a large viscosity made the number of cycles decrease (whenηs=10-2Pa·s,the number of cycles was only 4). There is no denying that a prolonged swell-burst cycle of liposomes could be achieved through changing the solution viscosity.

Fig. 3. Influence of permeability P and viscosity ηs of GUVs on the cycle dynamics. (a)Functional relationship between cycle time T and number of cycles i (P=2×10⁻⁴ m/s, P=2×10⁻⁵ m/s, P=2×10⁻⁶ m/s). (b)Function curves of cycle time T with number of cycles i (ηs =10-4 Pa·s,ηs=10-3 Pa·s,ηs=10-2 Pa·s). The cycle time shows the y-axis data logarithmically,highlighting the exponential correlation.
To deeply understand the underlying mechanisms of the dependence of swell-burst cycling dynamics on vesicle radius,permeability,and viscosity,we quantitatively discussed them.For the parameter of vesicle radius, the swelling phase was characterized by a linear increase in the radius of GUVs(except for the final cyclei=12). For example, fori=1, the vesicle radius increased from 8µm to 25µm,and the swelling slope ((Rc/R0)/tswell) decreased by 68.7%; fori= 6, the swelling slope decreased by 75.9%(Fig.4(a)).This shows that at the beginning of the cycle (Δposm>ΔpL), which was sufficient to maintain the velocity of vesicle swelling. As Δposmbecame infinitely close to ΔpL, the reduction of the driving force drove the swelling velocity to slow down, resulting in strong nonlinear time dependence of the final cycle. The cycle time had a near-linear to higher-than-linear dependence on the vesicle radius(Fig.4(b)). This meant that for a small vesicle radius of GUVs,the membrane tension(σ)increased at a fast velocity (this state of the membrane tension was an increasing function of time),allowing the energy barrier for opening a pore to be reached more quickly,thus effectively shortening the cycle time. For the parameter of permeability, the cycle time had a negative exponential dependence on permeability(Fig. 4(c)). The membrane tension (σ) increased intermittently at an accelerated velocity,corresponding to fast stretching of the membrane along with shorter swelling time,leading to a shorter cycle time. For the parameter of viscosity,the cycle time had a strong nonlinear viscosity dependence,increasing at higher viscosity (Fig. 4(d)). Note that the higher part than the linear region from 0.00166°increased to 0.00558°.One potential explanation is that the viscous enrichment of the solution environment permitted the escape of large amounts of solute. This meant that the osmotic pressure (Δposm) for initiating the next cycle decreased dramatically,hence a quick increase in curve deviation.
Indeed,permeability is dependent on the structure of the phospholipid bilayer. The order of the lipid bilayer could be adjusted by polyunsaturated phospholipids. Furthermore,the permeability of the mixture bilayer is a linearly increasing function of SDPC mol%.[41]Hence,we used a lipid mixture of POPC:SDPC(1:1 mol%:mol%)encapsulated with sucrose solution for the experimental study (Fig. 5(a)). We identified that the increase in pore lifetime prolonged the cycle time (250 ms). Following that, we simulated curves of pore lifetimes with dτ/diincreasing exponentially(Fig.5(c)grey histogram and red point-line diagram). From the time range of the vertical axis,it can be seen that the pore lifetimes were prolonged as the permeability increased(the longest pore lifetimes atP= 2×10⁻⁴m/s could reach about 500 ms,while the longest pore lifetimes atP=2×10⁻⁴m/s could reach about 26 ms). It could be inferred that taking the different permeability values influenced the line tension. It was previously reported that the line tension could be measured by different membrane components. It was found that adding dioleoylphosphatidylethanolamine to the DOPC membrane could reduce the line tension.[42]Accordingly,we boldly speculated that the phospholipid mixture of POPC:SDPC(1:1 mol%:mol%)would cause a decrease in the line tension. Our results provided a novel idea for investigation of the quantitative relationship between line tension and polyunsaturated lipid components.

Fig.4. Regulation of the cycling dynamics of GUVs. (a)Time dependence of the vesicle radius during the swelling phase. (b)Vesicle radius dependence of cycling dynamics. (c)Permeability dependence of cycling dynamics. (d)Viscosity dependence of cycling dynamics.
Moreover, viscosity depends on the properties of the solution,as sucrose solution flows more freely than glycerol solution. We exposed POPC vesicles with 70% v/v glycerol to the hypo-osmotic medium to explore the effect of viscosity parameters on the swell-burst cycle by experimental means(Fig. 5(b)). One distinguishing aspect was prolonged pore lifetimes with a consequent increase in the cycle time up to 400 ms. It was evident that such a method provided some time for internal drug release from the vesicles. Thus,we theoretically conducted that the relationship between pore lifetimesτandiwas plotted(Fig.5(c)blue histogram and green point-line diagram). We noticed that the pore lifetime withηs=10-2Pa·s was six orders of magnitude longer than that withηs=10-4Pa·s. This suggested that the increase in viscosity reduced the line tension,stabilized pore boundary,and increased the pore lifetime, thus increasing the cycle time. It is reasonable to assume that the viscosity of different orders of magnitude changed the pore lifetime,thus changing the cycle time of GUVs. We indicated that the vesicles prepared in viscous solution could obtain long-lived pores, which enhanced the efficiency of drug delivery through the membrane pore.
The swell and burst of GUVs are mediated by a transient transmembrane pore,which plays a key role in the swell-burst cycle under osmotic pressure. Thereby, we chose one of the cycles to study its dynamic change of pore(Fig.6(a)). There was a maximum radius (15.58 µm) of GUVs before opening a single pore in the POPC vesicle;once the membrane tension exceeded the critical value,a micrometer pore appeared. The pore radius(6.8µm)was approximately 44%of the maximum radius. On the other hand, it was observed for merely about 45 ms as the excess solute and water molecules overflowed through the pore, leading to pore closure. To check for leakage, we encapsulated GUVs with rhodamine sulfide dye and noticed that some of the dye was released,while the other part remained in the resealed vesicle(Fig.6(b)). Strikingly,a similar dynamic could be obtained from theoretical predictions;we obtained the vesicle radius and pore radius as a function of time. We noticed that the pore radius of pulse rising was up(7µm)to 45%of the critical vesicle radius(15.6µm),and the pore lifetime was 40 ms from the time scale. The theoretical and experimental results were in good agreement, which meant that the pore radius and lifetime could be adjusted by regulation of the parameter values in theory or changing the experimental conditions in the experiment. For example, using a viscous mixture to slow down the leakage of internal liquid in the presence of a pore allowed the pore to reach a large radius (several micrometers) and last for at least a few seconds.

Fig.5. Influence of permeability P and viscosity ηs on pore lifetime. (a)Microscopic images of GUVs composed of POPC:SDPC (1:1). The white arrows indicate the pore location and the cycle time is displayed as 0.25 s.Scale bars represent 5µm. (b)Fluorescence micrograph of POPC vesicle containing 70% glycerol (v/v) for one cycle. The white arrows indicate the pore location and the cycle time is displayed as 0.4 s. Scale bars represent 5µm.(c)When P and ηs take different values(grey histogram: P=2×10⁻⁴ m/s,red point-line diagram: P=2×10⁻⁶ m/s, blue histogram: ηs =10-4Pa·s,green point-line diagram: ηs=10-2 Pa·s),the pore lifetime τ changes with the number of cycles.
Furthermore, it should be noted that short pore lifetime is one of the constraining factors in the practical application of drug on-demand delivery.[43]In addition, the pore lifetime is inversely proportional to the line tension. Nevertheless, it is difficult to measure the value of line tension directly in the experiment. The reason is that the edge of the lipid bilayer is hardly stable for a long time. In this study, we reported a method to determine line tension indirectly. The fluorescent images of pore transmembrane transport (Fig. 6(c)) revealed that the small vesicle (Rs=3.3 µm)inside the large vesicle (RL1= 19.47 µm) was dragged out of the GUVs (RL2=19.18 µm) by the leaking liquid in the hypo-osmotic medium. It was supposed that the small vesicle moved linearly at a constant rate (v) and the initial displacement was set toy= 0. Therefore, it could be determined thatv= dy/dt=19.61µm/90 ms≈0.22µm/ms. Using the following formula:πR2svt+4πR3L2/3=4πR3L1/3, the value ofRL1(19.33 µm) could be deduced. The calculated value was close to the measured value, indicating the availability of the formula. More importantly, it provided a simplified method for roughly estimating the amount of leakage. Of course,drugs with higher molecular mass may undergo a further increase in osmotic pressure difference to achieve release. Moreover, the line tension could be inferred from the rate of small vesicle transport which predicted that the value(3πηsRL1v/2≈2.02×10-11N) was slightly higher than the theoretical simulation value(Table 1,10-11N),yet they were of the same order of magnitude. Indeed, other physical and biological factors also had an impact on the rearrangement of marginal lipids(such as temperature and lipid composition).
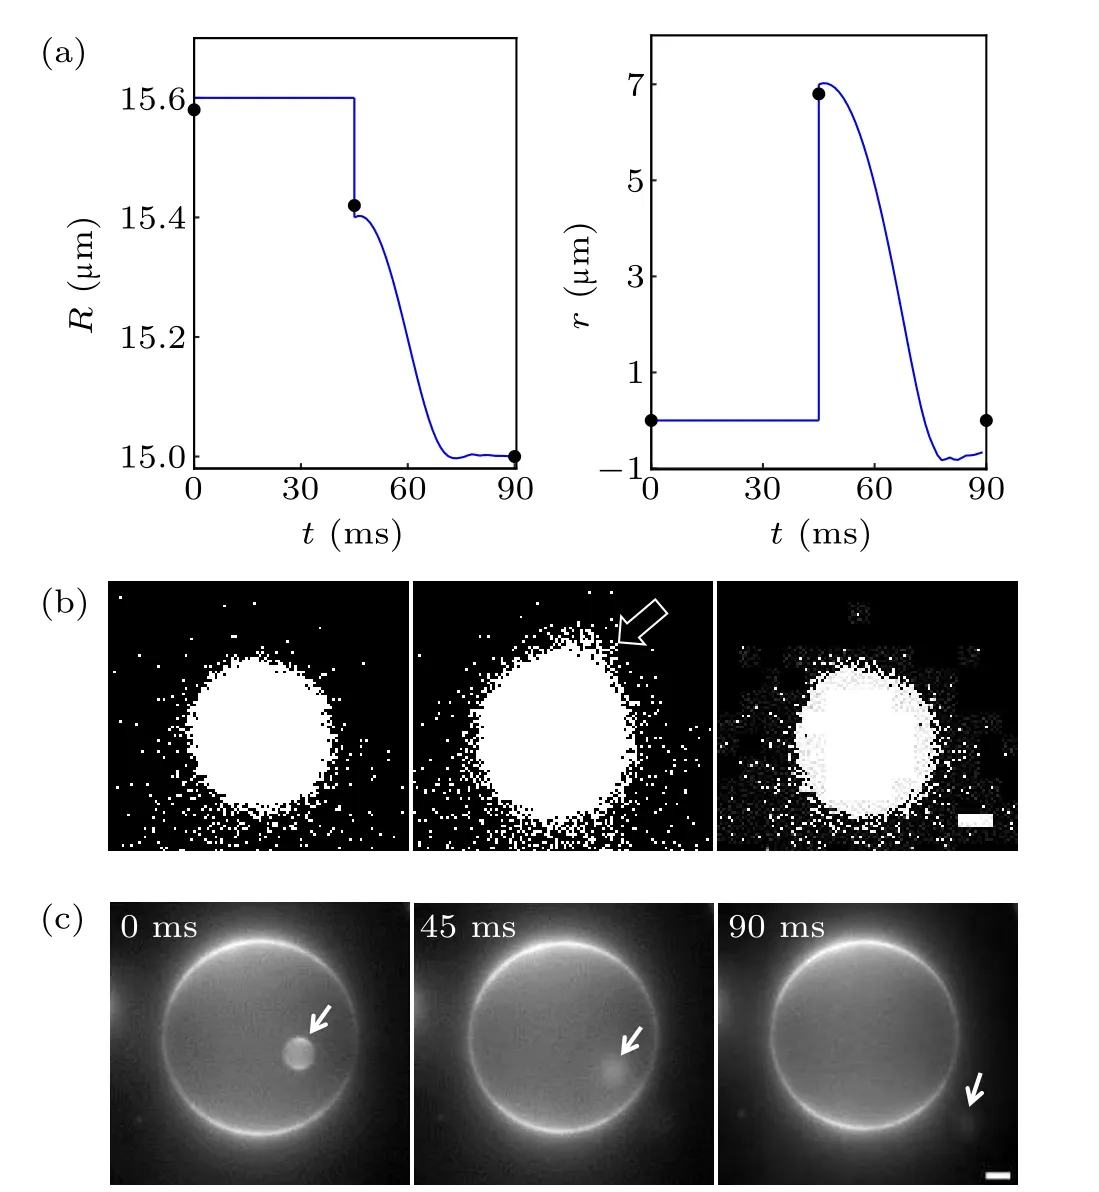
Fig. 6. Pore dynamics of GUVs. (a) Theoretical simulation curves of vesicle radius R and pore radius r with time t. The black dots represent the experimentally measured values. (b)Micrographs of fluorescent leakage visualizing the diffusion of solute through a pore. The leakage of fluorescent dyes is made obvious by increasing the contrast. The white arrow indicates leakage position. Scale bars represent 2µm. (c)Small vesicle escaping from a large vesicle. The small vesicle indicated by the white arrow was first located in the large vesicle (0 ms). Then the appearance of the transient pore promoted the movement of the small vesicle(45 ms),until it finally left the large vesicle(90 ms). Scale bars represent 5µm.
4. Conclusion
In this study, by adjusting the three GUV physical parameters of initial radiusR0, membrane permeabilityP, and solution viscosityηs, quantitative analysis of the swell-burst cycle process in a hypo-osmotic medium was successfully obtained. Both theoretical simulations and experiments showed that a large initial radius depended on a slow dynamic process.The simulation predicted that the membrane permeability decreased by two orders of magnitude,resulting in a halving of the number of cycles required to reach balance. The solution viscosity increased by two orders of magnitude,leading to an increase in pore lifetime by six orders of magnitude. The prediction results provided a theoretical basis for the experiment.We acknowledged that the potential impact of thermal disturbance on the cycle had not been considered here. It will be of great significance to build a model closer to the real biophysical process in future research. Furthermore, it was demonstrated experimentally that the phospholipid membrane with high permeability or vesicles of viscous solution prolonged the cycle time via increasing the pore lifetimes, which depended on the line tension. We quantitatively measured the linear tension of the membrane pore through the release velocity of inclusion, which played a key role in the resealing mechanism of the membrane in the physical scheme of drug release. The findings contribute to the study of self-assembly and self-healing of the bilayer structure of lipids, which has broad application prospects.
Acknowledgments
Project supported by the Joint Funds of Xinjiang Natural Science Foundation, China (Grant No. 2022D01C336),School Level Key Projects of Yili Normal University (Grant No.2020YSZD003),the National Natural Science Foundation of China(Grant Nos.11904167 and 22163011),and the Postgraduate Scientific Research Innovation Project of Xinjiang,China(Grant No.XJ2022G230).
猜你喜欢
杂志排行

Chinese Physics B的其它文章
- Characterizing entanglement in non-Hermitian chaotic systems via out-of-time ordered correlators
- Steering quantum nonlocalities of quantum dot system suffering from decoherence
- Probabilistic quantum teleportation of shared quantum secret
- Spin–orbit coupling adjusting topological superfluid of mass-imbalanced Fermi gas
- Improvement of a continuous-variable measurement-device-independent quantum key distribution system via quantum scissors
- An overview of quantum error mitigation formulas