Hydrophobicity changes of polluted silicone rubber introduced by spatial and dose distribution of plasma jet
2022-05-05ShuangLI李爽XinzhengGUO郭新正YongqiangFU付永强JianjunLI李健俊andRuobingZHANG张若兵
Shuang LI (李爽), Xinzheng GUO (郭新正), Yongqiang FU (付永强),Jianjun LI (李健俊)and Ruobing ZHANG (张若兵)
Engineering Laboratory of Power Equipment Reliability in Complicated Coastal Environments, Shenzhen International Graduate School(SIGS),Tsinghua University,Shenzhen 518055,People’s Republic of China
Abstract The hydrophobicity of polluted silicone rubber was improved rapidly under plasma jet treatment.It is an important phenomenon of the interaction between the plasma jet and the porous surface,and shows a wide application prospect in the power system.In this process, the spatial characteristics and dose of plasma jet are very important.Therefore, the variation of hydrophobicity of polluted silicone rubber under plasma jet treatment was studied, and the spatial characteristics and dose of plasma jet on polluted silicone rubber were also investigated in the work.The results show that the surface property (hydrophilic or hydrophobic)depended on the dose of plasma applied to the surface.The effective treated area was a circle,and the contact angles changed along the radial direction of the circle.This was attributable to the diffusion of plasma bullets on the surface and the distribution of plasma species.The plasma dose could be characterized by the energy density of the plasma applied on the surface.With the increase of plasma dose, the surface contact angles first increased rapidly and then decreased gradually.
Keywords: plasma jet, polluted silicone rubber, hydrophobicity, plasma dose, energy density,spatial distribution
1.Introduction
Surface treatment by plasma has drawn more and more attention due to its advantages in technology, economy, and environment,such as surface etching[1-4],surface activation[5-8], etc.The interaction of plasma and surface is affected by both the plasma characteristics and the surface properties.One important kind of surface is a polymeric surface covered by porous inorganic pollution, for example, silicone rubber(SR)insulators operating in highly polluted environments,which is very common in the power system [9].Our interesting finding proved that the hydrophobicity of SR covered by kaolin pollution layer was improved under plasma exposure, which shows enormous potential for application in the power system, and it is also a novel interaction between plasma and surface [10, 11].
The hydrophobicity transfer property is one of the most important properties of Sr.The hydrophobicity transfer of SR is that when the hydrophobic SR is covered with a hydrophilic pollution layer,the hydrophobicity of bulk SR can transfer to the pollution layer, thus turning the pollution layer hydrophobic[12,13].This characteristic plays an important role in preventing pollution flashover caused by moisture absorption of polluted insulators in the natural environment, which leads to its largescale application in the power system.The hydrophobicity uncross-linked low molecular weight siloxanes (LMWs)contained in bulk SR are adsorbed by the pollution layer and diffuse from the bulk SR to the pollution layer, so the pollution layer which contains LMWs also becomes hydrophobic.This hydrophobicity transfer process usually takes several days and may be weakened due to heavy pollution or high humidity.However,plasma treatment can reduce it to only a few seconds [10].
Our previous studies showed that the plasma species could accelerate the diffusion of LMWs from the bulk SR to the kaolin layer [14, 15].This made the polluted SR obtain hydrophobicity quickly during plasma treatment.Moreover,plasma treatment could improve the adsorption performance of the kaolin layer, so the diffusion of LMWs after treatment was faster than that of untreated ones in the kaolin layer.The plasma jet was generated in the air,and the oxidizing species in the plasma would change the surface from hydrophobic to hydrophilic.Therefore, a competition between plasma acceleration and oxidation existed during plasma exposure,and the hydrophobic state of the surface was determined by the competition.
However, the hydrophobicity state of the kaolin under different treatment conditions and the relationship between surface hydrophobicity and the spatial distribution of plasma species are not studied yet.Besides, it is a challenge to determine the dose of plasma treatment.
The dose of plasma is an essential parameter in plasma application because different plasma doses may lead to large differences in the effect.Currently, several parameters are used to define the plasma dose.Dobrynin et al used the deposited energy on per unit area as the plasma dose to evaluate the direct plasma interaction with living tissue [16].Cheng et al proposed the equivalent total oxidation potential as the definition of plasma dose in plasma medicine [17].Walther et al, Fang et al, Nania et al and Görrn et al all defined the product of plasma discharge power and treatment time as the plasma dose and studied its effects on the surface modification of SU-8, glass, and polydimethylsiloxane,respectively [18-21].Gidon et al utilized the thermal dose metric of cumulative equivalent minutes to quantify the nonlinear thermal effects of the plasma on a substrate [22].These different definitions of plasma dose apply to different studies, and there is no universal definition so far.How to characterize the plasma dose during plasma-induced hydrophobicity improvement of polluted SR needs further study.
In this work, the plasma jet was applied to treat polluted SR to change its surface hydrophobicity and the dependence of the contact angle (CA)on the treatment time was studied.We revealed the relationship between the CA and the spatial distribution of plasma species and proposed the energy density of plasma to characterize the plasma dose.
2.Experimental setup
2.1.Plasma jet system
The plasma jet system used to treat the samples in the work is shown in figure 1,which is the same as that in[15].Working gas was fed into the plasma generator via a flowmeter.The plasma generator consisted of typical needle-ring electrodes and a quartz tube dielectric.The high voltage electrode was a 2 mm diameter copper rod, and the ground electrode was a metal foil of 10 mm in width.The outer diameter of the quartz tube was 10 mm, and the thickness of the tube wall was 1 mm.The plasma generator was placed in a sealed box to control the ambient gas of the plasma.A high-frequency AC power supply was used to generate the plasma jet.A high voltage probe,a current probe,and an oscilloscope were used to measure the applied voltage and discharge current of the plasma jet.The discharge power of plasma applied to the samples was measured by the integration of applied voltage and discharge current.Unless otherwise specified, the peakto-peak value of the applied voltage was 5 kV, the frequency was 30 kHz, the working gas was He at a gas flow rate of 6 l min−1, and the ambience was air.
During treatment, the sample was fixed on a platform and driven to do an s-shaped reciprocating motion so that the plasma jet could sweep the whole surface uniformly.The horizontal movement speed of the sample was adjusted between 1 and 10 mm s−1(according to the treatment time)and the vertical step size was 5 mm.The treatment time was defined as the ratio of the treatment time of the whole sample to its area.
2.2.Samples preparation and hydrophobicity characterization
The high temperature vulcanized SR (provided by CYG Insulator Co., Ltd, China)was used as the sample in the study.Kaolin (provided by the Dalian Insulator Group Co.,Ltd)was used as the pollution for its weak hydrophobic transference.The artificial pollution was applied to the SR samples according to IEC 60507.The non-soluble deposit density of the pollution layer was set at 2.0 mg cm−2.All samples were dried in an environment at a relative humidity of 30%-40% for about 3 h before plasma exposure.The sample was placed 10 mm away from the outlet of the quartz tube during plasma treatment.
After plasma exposure,the surface hydrophobic property was characterized by static CA and spray method according to IEC 62073.The CA method is a measurement that involves the evaluation of the CA formed between the edge of a single droplet of water and the surface of the sample.A 5 μl droplet of deionized water was used in the study, and the CA values were an average of three measured values.The spray method is based on the response of the sample surface after exposure to a fine water mist for a short period.The water mist was sprayed on the samples,and the hydrophobicity after the mist exposure was evaluated by the state of the water droplets on the surface.
3.Results and discussion
3.1.Time dependence of hydrophobicity of SR samples
Figure 2 shows the CA of the SR samples after plasma treatment at different times.In order to avoid the spatial nonuniformity of the plasma effect,the plasma jet swept over the sample to give a uniform treatment of the surface, as described in section 2.1.The untreated sample was hydrophilic with a CA of about 30°.As shown in figure 2(a), the CA first increased from 30° to 120° and then decreased to 0° as the treatment time increased.When the treatment time was very short,such as 1 s and 2.5 s,the CA was about 60°,which was larger than that of untreated samples,but the surface was still hydrophilic.When the treatment time was increased to 5 s and 10 s, the SR samples acquired hydrophobicity during the plasma treatment, and the CA was about 120° after plasma exposure.The CA gradually decreased as the treatment time increased and dropped to 0° when the treatment time was 60 s.

Figure 1.Plasma jet system.
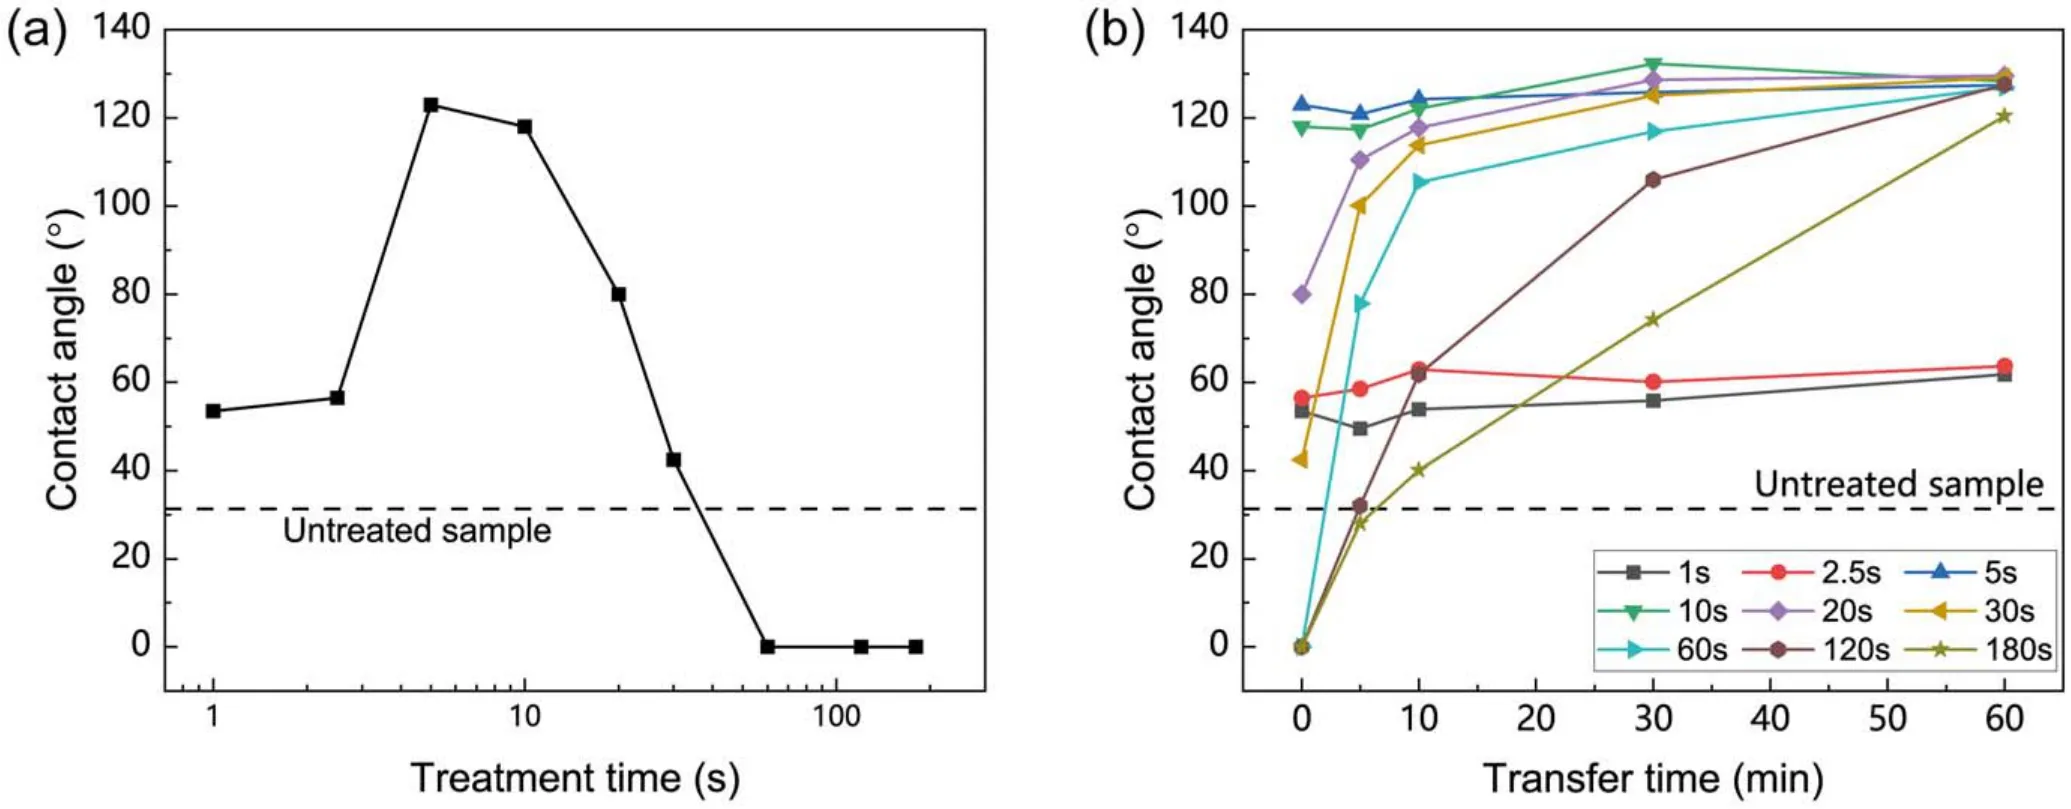
Figure 2.(a)The CA of the SR samples treated for various time.The CA was measured within 1 min after treatment.(b)The CA of the SR samples after plasma treatment for different time.

Figure 3.Photographs of SR samples treated for 10 s.(a)Initial samples, (b)exposure to water mist within 1 min after treatment.
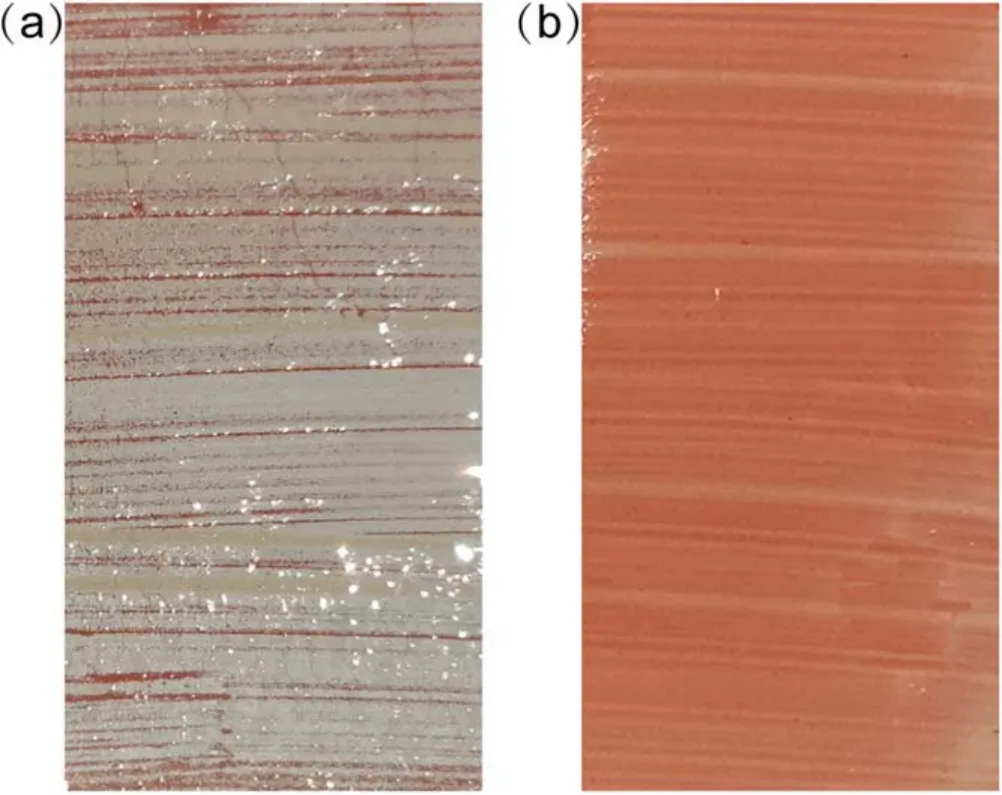
Figure 4.Photographs of SR samples treated for 180 s.(a)Exposure to water mist within 1 min after treatment, (b)exposure to alcohol mist within 1 min after treatment.
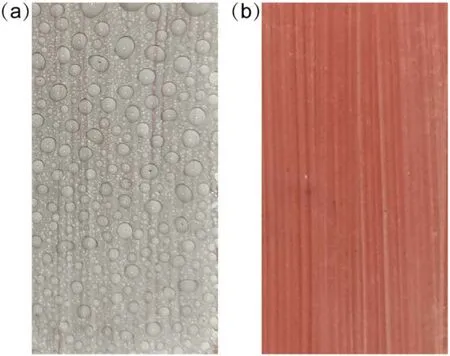
Figure 5.Photographs of SR samples after plasma treatment for 180 s and hydrophobicity transfer for 12 h.(a)Exposure to water mist, (b)exposure to alcohol mist.

Figure 6.The CA of SR sample treated by plasma jet in He and Ar ambiences.
Considering the hydrophobicity transfer characteristics of SR, the relationship between the CA of SR samples and hydrophobicity transfer time after plasma treatment was studied and the results are shown in figure 2(b).The samples treated for 1 s and 2.5 s remained hydrophilic during hydrophobicity transfer.For the samples treated for a longer time,plasma treatment accelerated the hydrophobicity recovery to saturation.But the transfer time to saturation increased with a longer treatment.
The CA could show the hydrophobicity of the kaolin layer surface.The hydrophobicity of bulk kaolin also showed different characteristics after treatment and transfer for different times, which could be evaluated by water mist exposure,as shown in figures 3-5.The dry kaolin layer on the SR samples is white while it turns red after absorbing water,which is the colour of SR under the kaolin layer.Therefore,the colour of the kaolin layer can be used to judge whether it absorbs water or not.As shown in figure 3(a),the kaolin layer was white after 10 s plasma treatment.The water droplets were discrete after water spraying, but the kaolin layer was red, as shown in figure 3(b).This indicates that the kaolin layer absorbed water, although its surface was hydrophobic.When treated for 180 s, the surface was hydrophilic with a CA of 0°.Under water mist exposure,a continuous water film was formed on the surface,but the colour of most kaolin layer was white, as shown in figure 4(a).This indicates that the bulk of the kaolin layer was hydrophobic, while the surface was hydrophilic.The hydrophobicity of the kaolin layer recovered after 12 h transfer, as shown in figure 5(a), so the droplet was discrete and the kaolin layer was white.
As reported in our previous studies[14,15],the bulk SR contains uncross-linked LMWs, and plasma species accelerated the transfer of LMWs from the bulk SR to the kaolin layer and adsorbed them in the pores of the kaolin layer.The LMWs are hydrophobic, thus making the surface hydrophobic.The migrated LMWs gradually accumulated in the kaolin layer with increasing treatment time until equilibrium was reached.After a short treatment, the LMWs adsorbed on the surface of the kaolin layer made it hydrophobic.However,the amount of LMWs transferred to the kaolin layer was too small to prevent it from absorbing water.Under longer treatment, the surface of the kaolin layer was hydrophilic as the LMWs on the kaolin surface was oxidized by the oxidizing species in the plasma jet and turned the surface hydrophilic.This competition between plasma acceleration and plasma oxidization has been discussed in our previous work[15].Although the LMWs on the surface were oxidized,enough LMWs were still transferred and accumulated in the bulk kaolin layer to prevent the diffusion of water, so the white colour was maintained.The longer treatment achieved a stronger effect of the plasma.The hydrophobicity of the sample surface in figure 4(a)could recover within a few hours, and both the bulk and surface of the kaolin layer were hydrophobic, as shown in figure 5(a).
The hydrophobicity of the bulk kaolin lay could be evaluated by its colour under water mist exposure.Adsorption of enough LMWs guaranteed its hydrophobicity and the colour was white,as the organic LMWs are not miscible with water.To further prove the conclusion,the alcohol spray was applied to the white kaolin layer.Because alcohol is an organic solvent and miscible with LMWs.After spraying alcohol mist on the surface of SR samples, the kaolin layer was completely infiltrated and turned red, as shown in figures 4(b)and 5(b).Therefore, the conclusion was confirmed by observing the state of the kaolin layer after alcohol spraying.
As mentioned above,the surface of the SR sample turned to be hydrophilic after a long treatment time, that might be caused by possible oxidation processes during plasma treatment.The plasma jet was generated in the air, and oxidizing species were produced due to the O2and H2O in the air.The species oxidized the LMWs on the surface of the kaolin layer,so the sample became hydrophilic.Figure 6 shows the CA of samples treated with plasma jet in He and Ar ambiences.In He and Ar ambiences, the surface of SR samples remained hydrophobic even after 5 min of treatment.This indicates that oxidizing species of plasma generated in the air play an important role in the hydrophobicity loss in plasma treatment.
3.2.Radial distribution of plasma effect
The plasma will spread over the surface of the SR sample,resulting in the radial distribution of the treatment effect.Figure 7 shows the CA at different distances from the central point of the treated area for different treatment times.During the treatment,the sample and plasma were fixed and relatively stationary.Considering the hydrophobicity recovery in figure 2, measurements were performed at the 1st min and 30th min after treatment, respectively.The results show the spatial and temporal complexity of the radial distribution of the plasma effect.

Figure 7.The CA of SR samples at different distances from the central point of the plasma-treated area.(a)Measured within 1 min after treatment, (b)measured at the 30th min after treatment.
As shown in figure 7(a), the central area of the sample treated for 10 s was hydrophobic and sharply changed to hydrophilic as one moved away from the centre.For the samples treated for 60 s, the central area of the sample was hydrophilic, and an annular hydrophobic zone appeared outside the central area, while the surface became hydrophilic again further from the central point.For the sample treated for 180 s, all the areas were hydrophilic.The CA in the central area was 0°, which increased to 30°-40° outside.Figure 7(b)shows that after 30 min of transfer, the CA in the central region of the sample treated for 10 s increased slightly,but the hydrophobicity distribution remained unchanged.The hydrophilic area in the centre of the sample treated for 60 s acquired hydrophobicity, and the distribution was similar to that of the sample treated for 10 s.For the sample treated for 180 s,the CA in the central region increased but still showed a hydrophilic state.An annular hydrophobic zone appeared outside the central area, while the outermost area was still hydrophilic.As shown in figure 8, the distribution of hydrophobicity can be directly observed by the spray method.Figure 9(b)shows the hydrophobicity distribution of the sample in figure 8(b)after hydrophobicity transfer for 12 h.
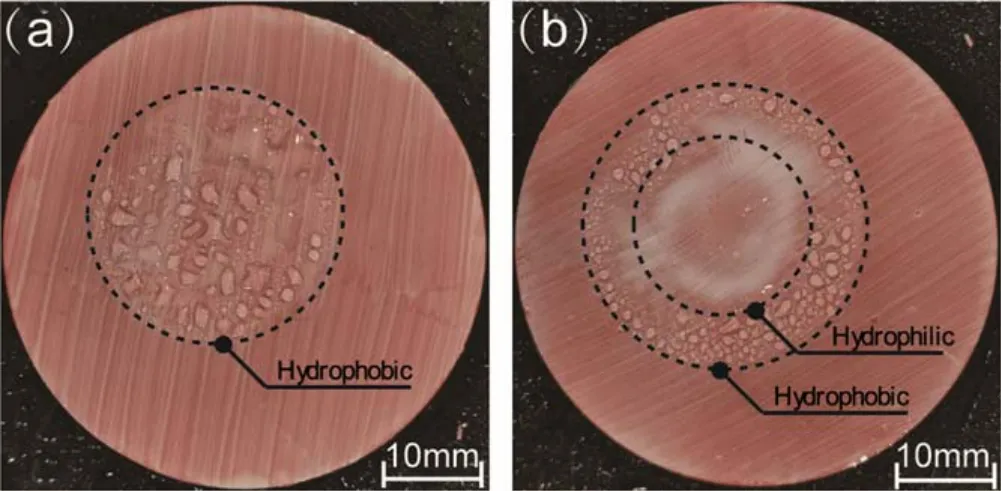
Figure 8.Hydrophobicity distribution on SR samples measured by spray at the 30th min after plasma treatment.(a)Treated for 60 s,(b)treated for 180 s.

Figure 9.Distribution of hydrophobicity on the SR samples measured by spray method after treatment for 180 s and hydrophobicity transfer for 12 h.(a)Gas flow rate at 3 l min−1, (b)gas flow rate at 6 l min−1.
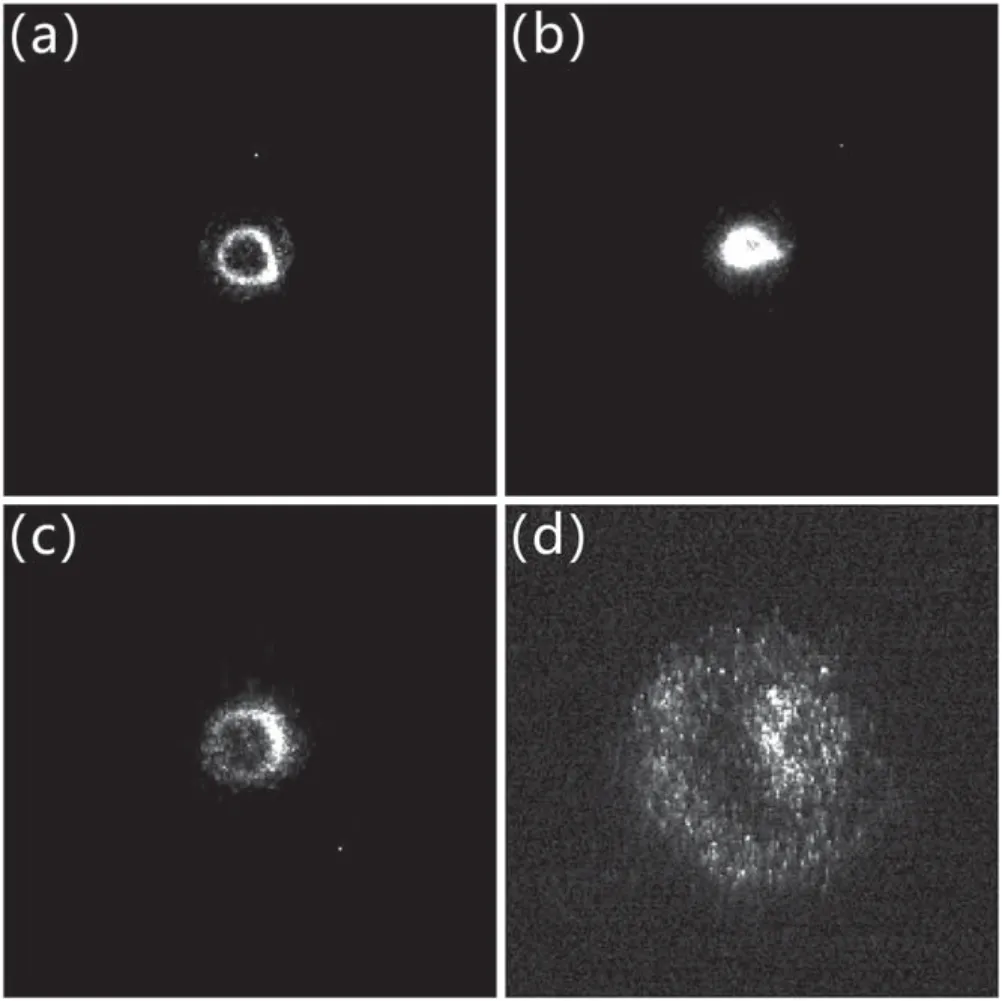
Figure 10.ICCD photographs of the plasma bullets.(a)Propagating in the air at a gas flow rate of 3 l min−1, (b)spread of the bullet on the glass at a gas flow rate of 3 l min−1,(c)propagating in the air at a gas flow rate of 6 l min−1, (d)spread of the bullet on the glass at a gas flow rate of 6 l min−1.
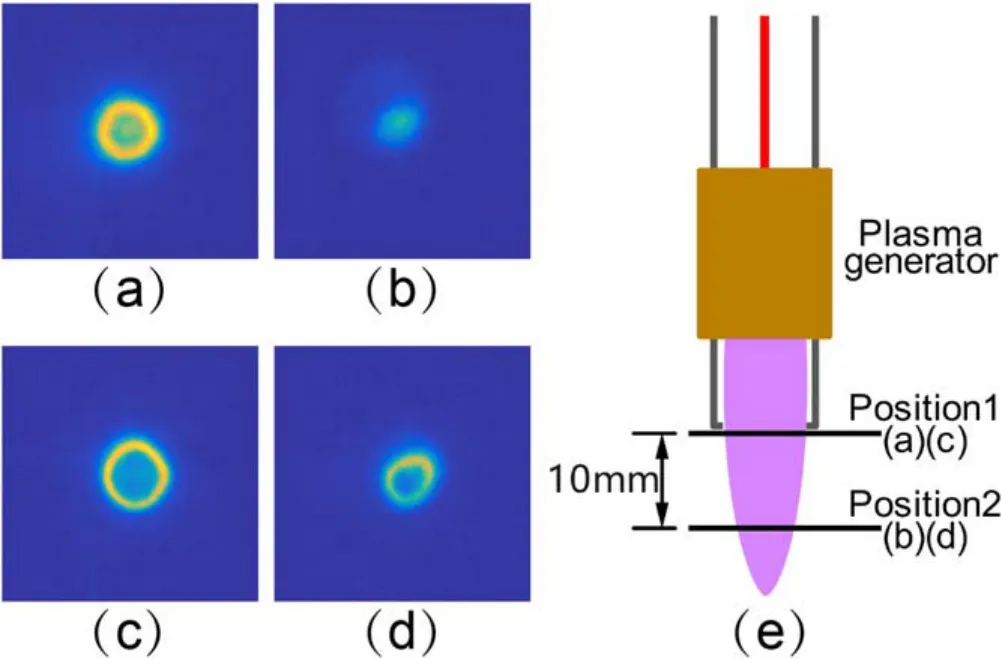
Figure 11.Distribution of OH radicals in the plasma jet observed by PLIF.(a)Gas flow rate was 3 l min−1, position 1, (b)gas flow rate was 3 l min−1,position 2,(c)gas flow rate was 6 l min−1,position 1,(d)gas flow rate was 6 l min−1, position 2, (e)PLIF diagnosis position.
Overall, although the plasma bullets were ring-shaped,the concentration of plasma reactive species in the discharge area was higher than that outside it,as shown in figure 10(d).Corresponding to the treated area, the plasma effect was stronger in the central of the treatment area than that in the surrounding area when considering the spread of plasma on the surface.As discussed in section 3.1,when treated for 60 s,the LMWs on the kaolin surface were oxidized by the oxidizing species in the plasma,so the surface turned hydrophilic in the central of the treated area.In the surrounding area, the plasma effect was weak, so the surface was hydrophobic.When treated for 180 s, the treatment time was long enough that all LMWs on the kaolin surface in the treated area were oxidized, so the surface was hydrophilic.After 30 min, the hydrophobicity recovered for the sample treated for 60 s, as shown in figure 2(b).For that treated for 180 s, the plasma effect in the central area was greater than the surrounding area, so the central area stayed hydrophilic while the surrounding area became hydrophobic.
At different plasma gas flow rates, the differences in the radial distribution were more obvious, as shown in figure 9.Figures 9(a)and (b)show the samples under water mist exposure after plasma treatment at different gas flow rates followed by hydrophobicity transfer.The hydrophobicity area on the SR samples was the effective area of plasma treatment in figure 9(a).The kaolin layer in its centre was white, while the area around it was red.This suggests that the kaolin layer in the centre contained more LMWs than the surrounding area,and the plasma effect in the centre was greater than that in the surrounding area.The surface of SR was hydrophilic outside the treated area.The treated area in figure 9(b)could be divided into three sections from the centre to the outside.All parts were hydrophobic,but the kaolin layer had different colours.The kaolin layer in the central area was red,indicating less LMWs content and a weaker plasma effect.The kaolin layer in the ring around the centre was white,representing a greater effect of plasma treatment.At the edge ring of the treatment area, the kaolin layer turned red again,indicating that the effect of plasma interaction was weakened here.Outside the treated area, the surface remained hydrophilic.
The spatial distribution of the plasma effect was related to the spatial distribution of plasma species.In this work,intensified charge coupled device (ICCD)and planar laser induced fluorescence (PLIF)were used to diagnose the plasma discharge.As shown in figure 10, the propagation of plasma bullets in the air and their spreading on the surface of transparent quartz glass were photographed with ICCD at gas flow rates of 3 and 6 l min−1.The distance between the jet nozzle and the glass was 10 mm and the ICCD was placed perpendicular to the glass.As shown in figures 10(a)and(c),the plasma bullets had a ring-shaped structure when propagating in air.This has been extensively investigated in many studies [23-25].Figures 10(b)and (d)show the subsequent development of the bullet after it propagated onto the glass.At a flow rate of 3 l min−1,the plasma bullets propagated to a solid circle on the glass.The intensity of the plasma discharge was higher in this area, resulting in the white area of the kaolin layer in figure 9(a).When the flow rate was 6 l min−1,the discharge spread around on the glass and formed a ringshaped structure, and the discharge intensity on the ring was greater than that in the ring interior.The distribution of discharge intensity corresponded to the hydrophobic state of the SR sample, as shown in figure 9(b).
Figure 11 shows the distribution of OH radicals in the plasma jet observed by PLIF measurements.It is shown that the OH in the plasma was also distributed in a ring shape near the nozzle of the plasma generator.At the position 10 mm away from the nozzle, where the SR sample was located during treatment,the OH distribution was a solid circle at the gas flow rate of 3 l min−1and a ring at the gas flow rate of 6 l min−1.
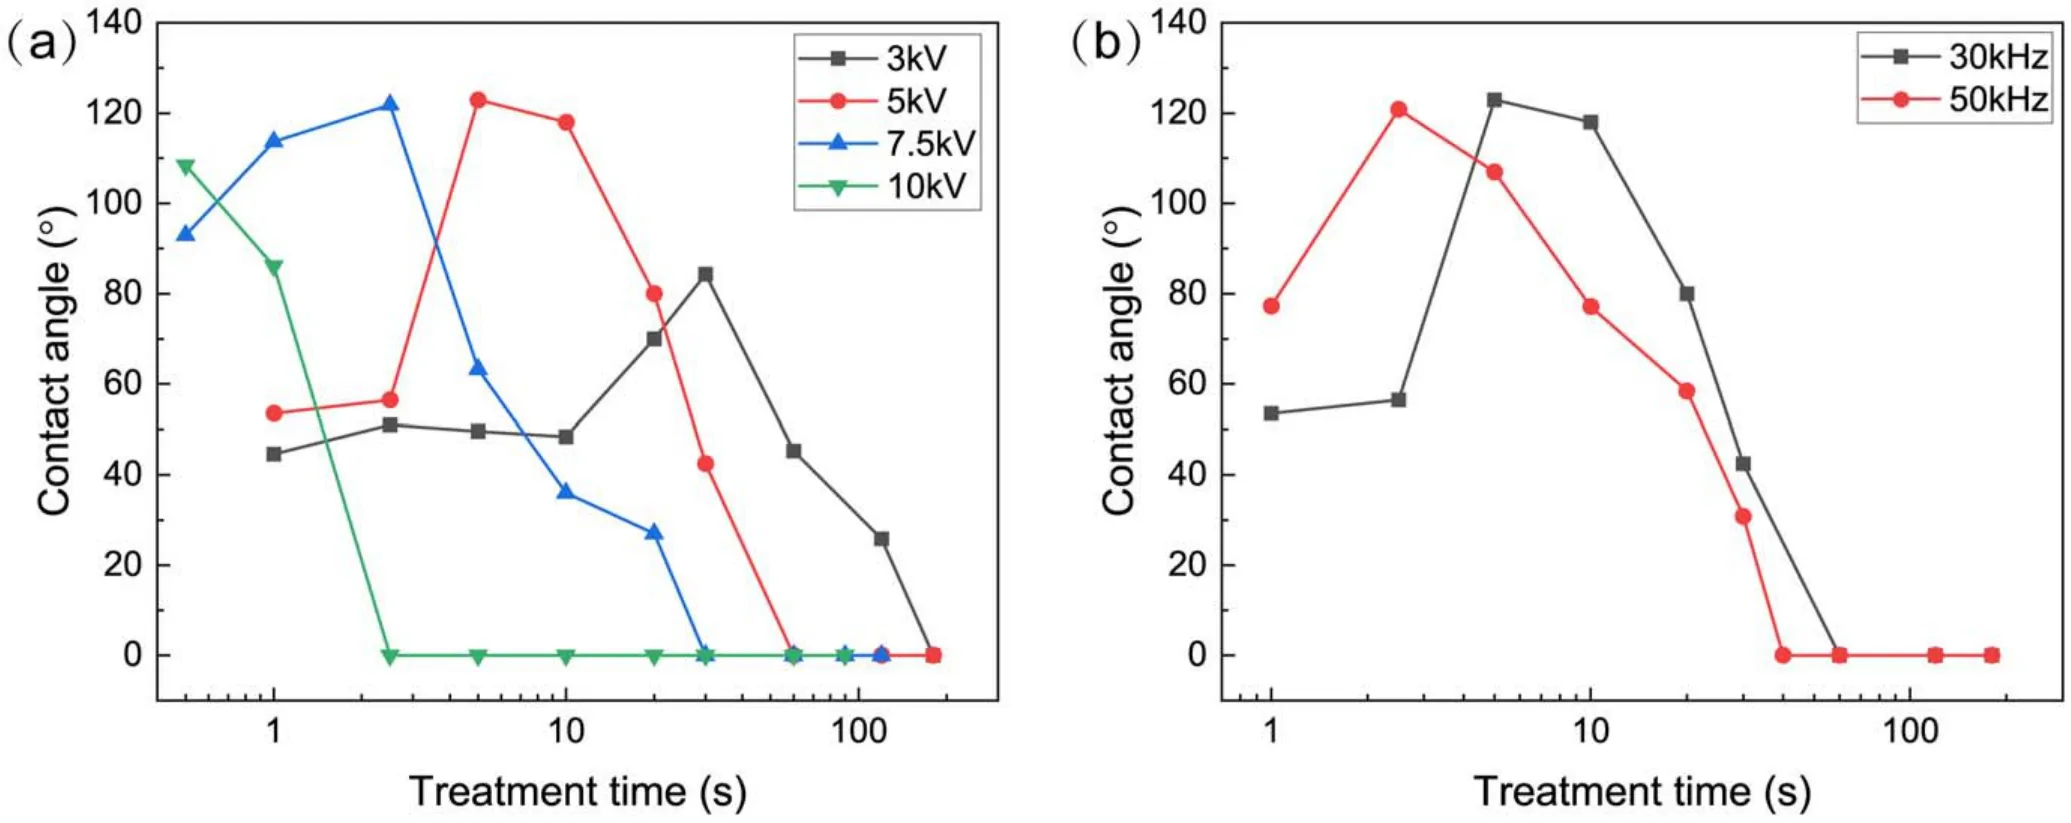
Figure 12.The influence of applied voltage on the CA of SR samples with different treatment times.(a)Influence of peak-to-peak value of voltage, (b)influence of voltage frequency.
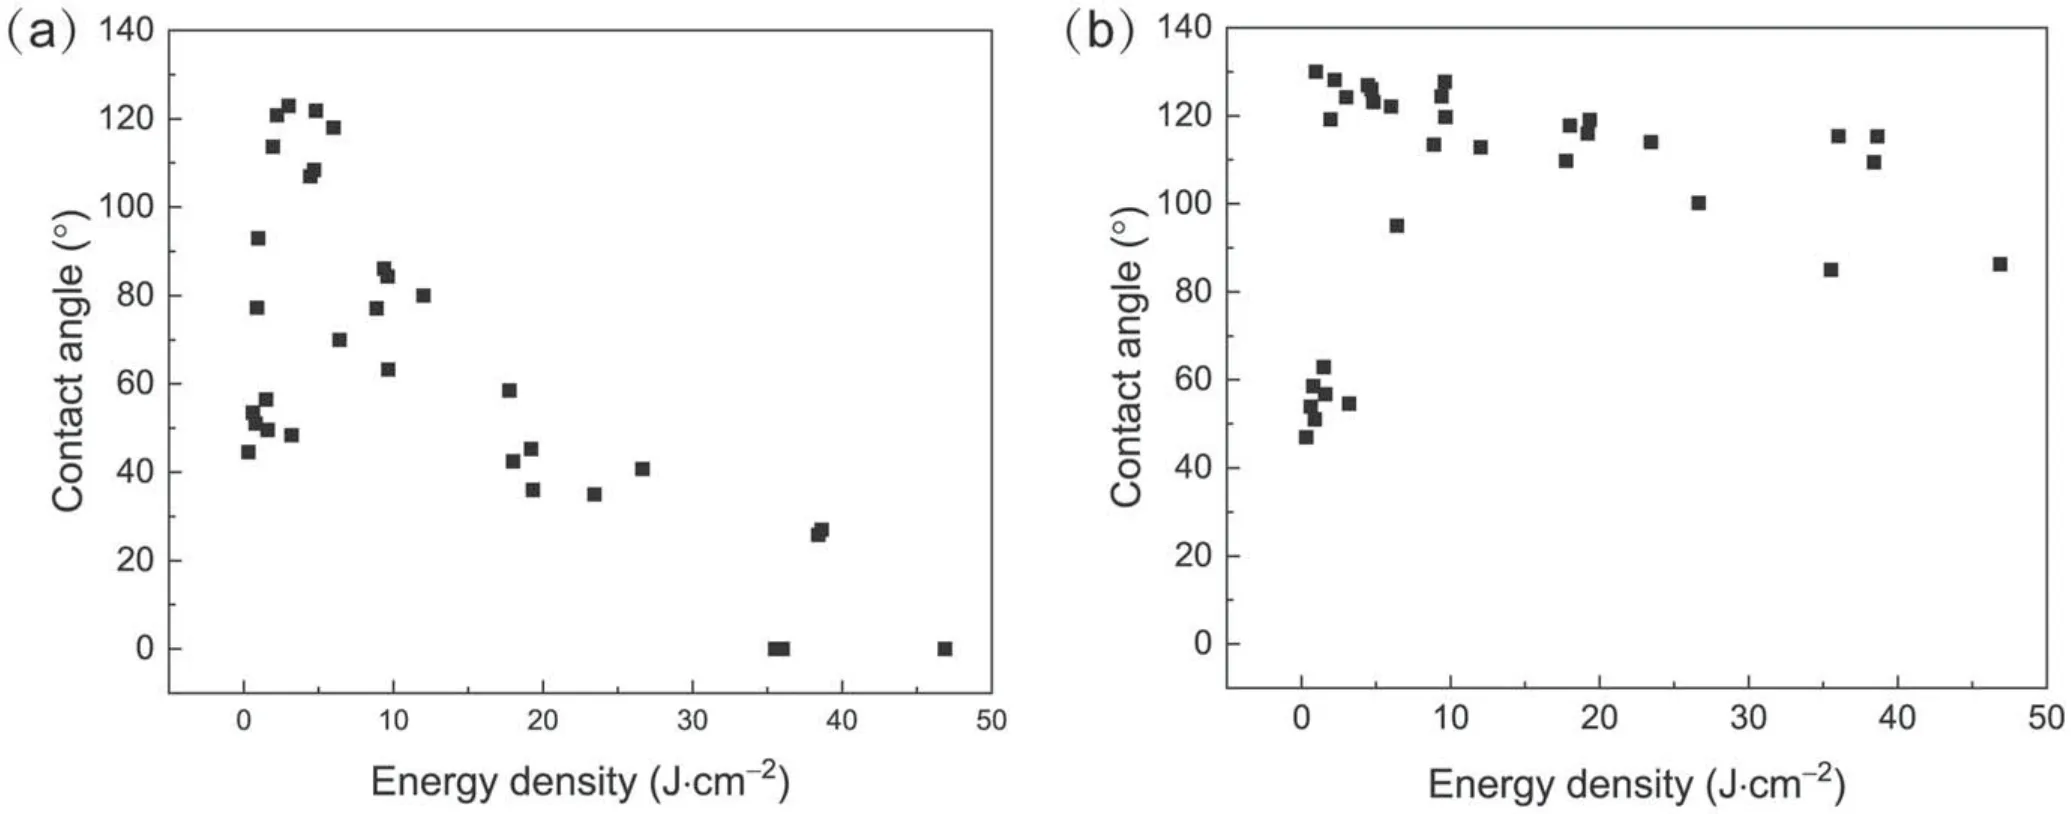
Figure 13.Relationship between the CA of SR samples and the energy density of the plasma.(a)The CA was measured within 1 min after treatment, (b)the CA was measured at the 10th min after treatment.
The white kaolin layer on the SR samples accumulated more LMWs and showed a greater treatment effect.The shape was consistent with the plasma bullet diffusion on the surface.This indicates that the distribution of active species of the plasma was the main factor in determining the hydrophobicity distribution after plasma treatment.
3.3.The plasma dose based on energy density
Numerous factors may affect the effect of plasma,such as the treatment time, parameters of the power supply, etc.In this study, we investigated the influence of peak-to-peak value and frequency of applied voltage, and treatment time on the CA.The results are shown in figure 12.The plasma jet swept over the sample to give a uniform treatment of the surface,as described in section 2.1.
Figure 12(a)shows the CA of SR samples treated for different times at different peak-to-peak values of applied voltage.When the applied voltage was 3 kV, the CA of the sample after plasma treatment was larger than that of the untreated sample after a short treatment, but it could not be transferred to a hydrophobic state.The CA decreased gradually to 0°as the treatment time increased.When the voltage was 5 kV, the surface CA first increased to about 120° and then decreased to 0°.When the applied voltage was 7.5 kV or 10 kV, the surface became hydrophobic after a fairly short treatment.With the increase of treatment time, the CA decreased to 0°.Overall, a ‘mountain shape’ correlation between the CA and the treatment time was observed,and the‘mountain shape’ shifted towards the direction of a shorter treatment time as the applied voltage increased.Figure 12(b)shows the dependence of the CA of treated SR samples on treatment time at different applied voltage frequencies.Similar to figure 12(a), a ‘mountain shape’ correlation between the CA and the treatment time was observed, and it also shifted in the direction of a shorter treatment time at a larger frequency.
How to estimate the plasma dose is an important question in plasma treatment.The plasma dose should be applicable at different treatment times, amplitudes and frequencies of the applied voltage.We calculated the energy density applied to the surface of the SR sample by the plasma,which is given by ED=PT/S,where ED is energy density,P is the discharge power of the plasma jet, T is the total treatment time of the whole sample, and S is the area of the sample.The energy density is a more essential parameter of plasma, and we defined it as the plasma dose.The variation of treatment time and the peak-to-peak values and frequencies of applied voltage led to the variation of discharge energy deposited on the surface.It should be noted that the discharge power of the plasma was smaller than the actual power deposited on the surface by the plasma, as only a part of power can be delivered to the surface.Figure 13(a)depicts the relationship between the plasma energy density and CA which was measured within 1 min after treatment.The CA increased rapidly with the increase of energy density.In a certain range of energy density, the surface CA was greater than 90°, and the surface was hydrophobic.As the energy density increased further, the surface CA decreased gradually and the surface became hydrophilic again.After hydrophobicity transfer for 10 min, the latter half of the curve rose upward as the CA increased during the hydrophobicity recovery, as shown in figure 13(b).The results suggest that energy density can be used to measure the plasma dose.
4.Conclusion
This work focused on the hydrophobicity change of polluted SR under plasma treatment and investigated the effects of plasma dose and spatial distribution on the hydrophobicity of the kaolin layer on Sr.With the increase of treatment time, the kaolin surface first turned hydrophobic, and then hydrophilic due to oxidization processes while the bulk kaolin changed from hydrophilic to hydrophobic.However,the hydrophilic surface recovered hydrophobicity at a quicker speed after treatment, and longer plasma exposure increased the transfer time to saturation.The hydrophobicity showed a ring-shaped distribution in the treated area, and it depended on the spatial distribution of the plasma bullets and, accordingly, the active species generated.The gas flow rate had a significant effect on the bullet structure.The energy density of plasma applied to the surface of polluted SR could be used to characterize the plasma dose.It was applicable at various treatment times and applied voltages.The hydrophobicity first improved and then decreased as the plasma dose increased.Findings in the present study can provide guidance for its application in hydrophobicity improvement of polluted SR insulators.
Acknowledgments
The work was supported by the Intergovernmental International Cooperation in Science and Technology Innovation Program (No.2019YFE0115600), National Natural Science Foundation of China (No.52177152), and Science, Technology and Innovation Commission of Shenzhen Municipality (No.JCYJ20180508152057527).
ORCID iDs
猜你喜欢
杂志排行

Plasma Science and Technology的其它文章
- Numerical analysis on the effect of process parameters on deposition geometry in wire arc additive manufacturing
- Investigation of the gas bubble dynamics induced by an electric arc in insulation oil
- The influence of charge characteristics of suspension droplets on the ion flow field in different temperatures and humidity
- Characteristic studies on positive and negative streamers of double-sided pulsed surface dielectric barrier discharge
- Characteristics of water volatilization and oxides generation by using positive and negative corona
- Preparation of N-doped graphite oxide for supercapacitors by NH3 cold plasma