Investigation of the gas bubble dynamics induced by an electric arc in insulation oil
2022-05-05ChenguangYAN闫晨光YaXU徐雅PengZHANG张芃ShiqiKANG康诗奇XianZHOU周贤andShuyouZHU朱述友
Chenguang YAN (闫晨光), Ya XU (徐雅), Peng ZHANG (张芃),Shiqi KANG (康诗奇), Xian ZHOU (周贤) and Shuyou ZHU (朱述友)
1 State Key Laboratory of Electrical Insulation and Power Equipment, Xi’an Jiaotong University, Xi’an 710049, People’s Republic of China
2 Beijing Zhongruihe Electrical Co., Ltd., Beijing 101300, People’s Republic of China
Abstract In this work, experimental and theoretical studies were carried out on arc-induced bubble dynamic behaviors in insulation oil.Direct experimental evidence indicated that the arc-induced bubble experiences pulsating growth rather than a continuous expansion.Furthermore, a theoretical model and numerical calculation method were proposed,which revealed the dynamic mechanism of bubble growth.Good agreement between the theoretical results and experimental observations verified the general correctness and feasibility of the proposed method.
Keywords: high-energy arc, bubble dynamics, insulation oil, on-site test
1.Introduction
Oil-immersed power transformers are among the most important and expensive equipment in power transmission and distribution.If a fault arc occurs in the insulation oil inside a transformer tank, a considerable volume of flammable gas is generated, which may lead to tank ruptures, oil spills and projection of metal parts [1].Over the past few decades, with the rises in power equipment capacity and voltage level, oil-immersed power transformer ruptures and explosions resulting from arcing faults have occurred more frequently, causing disastrous damage to property, the environment and the public.
Considering the severe consequences mentioned above,since the 1970s, significant effort has been devoted to the investigation of prevention and mitigation methods that alleviate damage [2-7].Meanwhile, studies have also been conducted to investigate the dynamic pressure rises and mechanical responses of oil-immersed transformers or other power equipment under internal arcing faults [8-12].For an arc-in-oil situation, the relationship between gas generation and arc energy has always been a key parameter.Currently,it is generally accepted that gas generation linearly increases with the arc energy released [1, 13].Specifically, based on past studies from the 1950s to the 1980s,a linear relationship of 15 ml kJ−1to 100 ml kJ−1between the arc energy and gas volume was suggested.According to experiments[8,14,15],a constant gas generation rate of 85 ml kJ−1was chosen at standard pressure and temperature.In contrast,some scholars claimed that the gas volume is a logarithmic function of the arc energy [6, 7].Owing to the constraints of the measurement methods and experimental conditions, previous studies did not describe the gas dynamic growth in the arc duration but instead obtained relations between the total volume of the generated gas and the total energy.Based on these static theories of gas generation, existing models disregarded the process of arc-induced gas bubble growth, thus inevitably yielding errors in the dynamic calculations of the pressure fluctuation and tank deformation.
In fact, bubble dynamics has long been a field of focus due to its important applications in various fields, such as shipbuilding, ocean engineering, and medical science, and corresponding studies have been conducted covering many kinds of bubbles, including underwater explosion bubbles,spark bubbles,laser bubbles,and so on[16-24].Arc-induced gas bubbles have distinct characteristics, which make it difficult to describe by previous models.For an underwater explosion or spark/laser bubble, the total energy is released within several microseconds, while the arc-induced gas bubble receives a continuous energy injection from the burning arc for a duration of up to dozens of milliseconds, which would have a significant impact on its dynamic growth.
In this work, two different types of transformer tanks were repurposed as testing platforms and subjected to highenergy arcing fault tests, although this is difficult, dangerous and cost-prohibitive.In particular, partially opening the tank wall makes it possible to film the dynamic gas bubble growth process using a high-speed observation system.The arc current, arc voltage and oil pressure were recorded by a multicharacteristic synchronous measurement system.Furthermore, a theoretical model of the dynamics of an arc-induced gas bubble in insulation oil and a numerical calculation method was proposed.By quantitatively comparing the calculation results and the on-site experimental data, the general correctness of the proposed theory and method were verified.
2.Experimental setup and results
2.1.Arcing test system loop
Figure 1 illustrates the arcing test system loop in this work,which is configured with an intermediate transformer (IT)to integrate into the 220 kV AC grid.The test transformer is connected to the two phases of the IT’s secondary side.The short-circuit current and conduction time are controlled by reactors and breakers.In real situations, the short-circuit current that results in tank deformation or rupture is in the range of 2-30 kA with 3-9 cycles according to case histories[1].In this study,the current peak was set to range from 10.37 to 18.76 kA with durations from 76.1 to 80.9 ms.

Figure 1.Arcing test system loop.

Figure 2.Test transformer #1 in the field.
Test transformer #1 is constructed with a tank size of 1 m3(1000 mm × 1000 mm × 1000 mm),and its tank wall is partially opened to install a quartz glass observation window(500 mm × 500 mm,40 mm thick)to film the arc-induced gas bubble,as shown in figure 2.Similarly,test transformer#2 is a reformed full-scale 40 MVA/110 kV transformer, which is also installed with an observation window of 500 mm ×500 mm.The window heights of both test transformers are set equivalent to the height of the center of the electrodes.The arc triggering device is mounted on the test transformer, which is mainly configured with two electrodes, copper holders, insulation rods and bushings.Between the electrodes, the fault arc is ignited by fusing a copper wire, and the arc voltage can be adjusted by changing the gap length.
2.2.Measurement system
Figure 3 shows the multi-characteristic synchronous measurement system, which mainly comprises a high-speed camera(Phantom VEO1310),current sensor(Rogowski coil),voltage divider, high-frequency dynamic pressure sensors,signal modulation circuit, data acquisition module, communication lines and computers.The high-speed camera was filmed at 5000 frames/s in the arcing test.The data acquisition module has a 500 kHz sampling frequency and 18-way analog synchronous input channels.
2.3.Representative testing results
2.3.1.Test in transformer#1.Figure 4 presents images of the gas bubbles filmed by the high-speed camera during two representative arcing tests in transformer#1.Specifically,the moments at which the bubble reaches its maxima and minima volume as well as specific integer moments are given to show a complete bubble pulsation process.
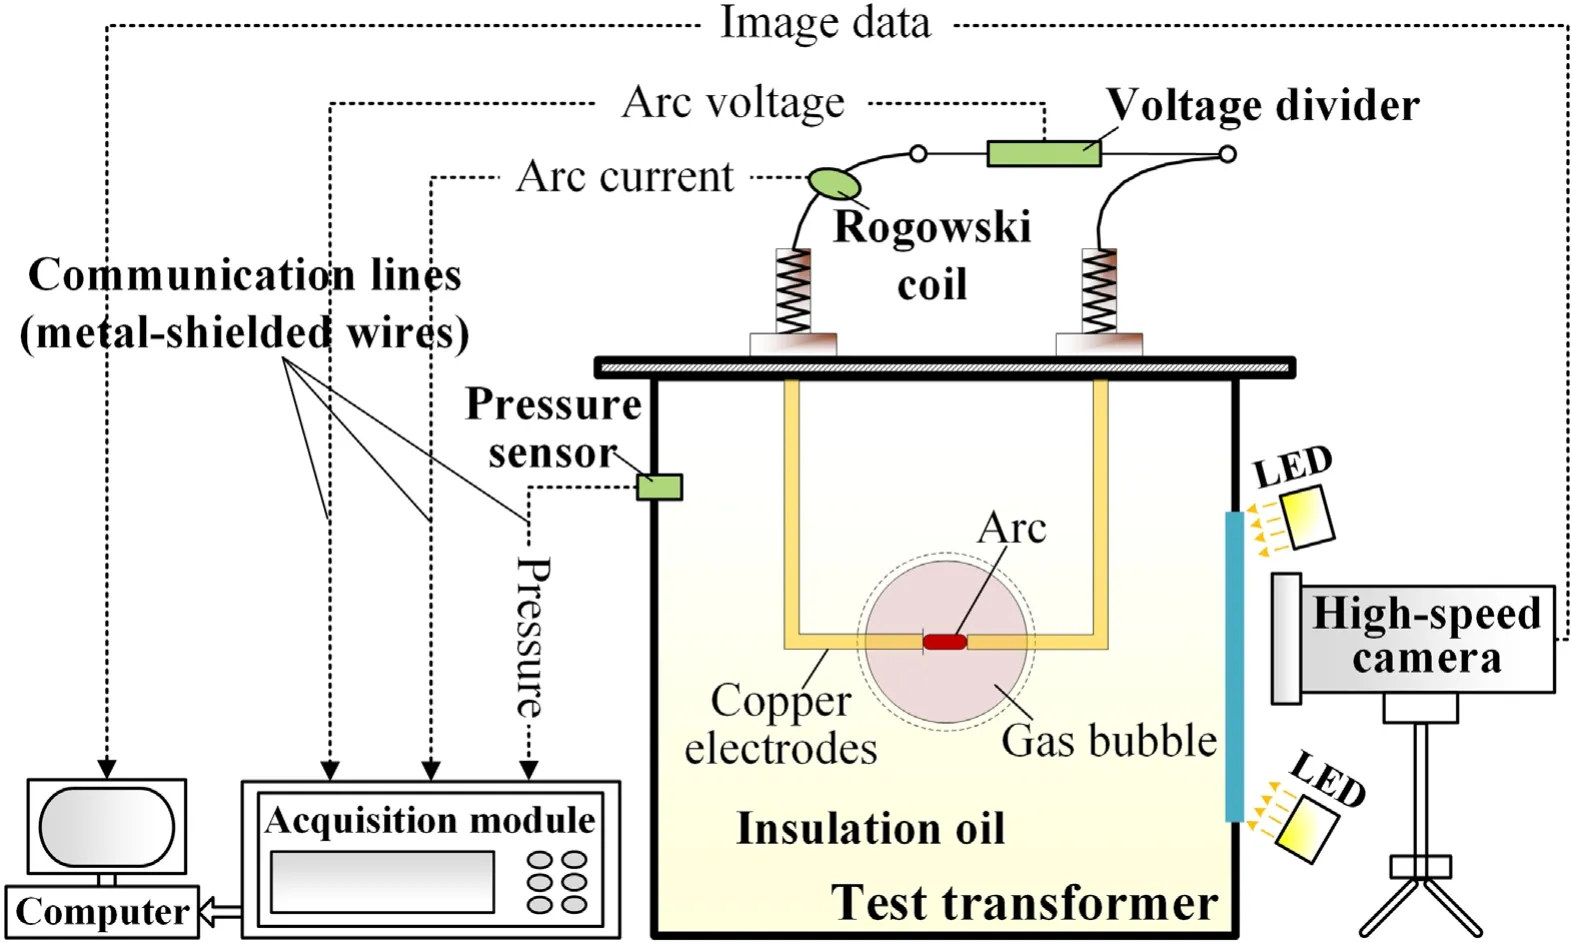
Figure 3.Multi-characteristic synchronous measurement system.
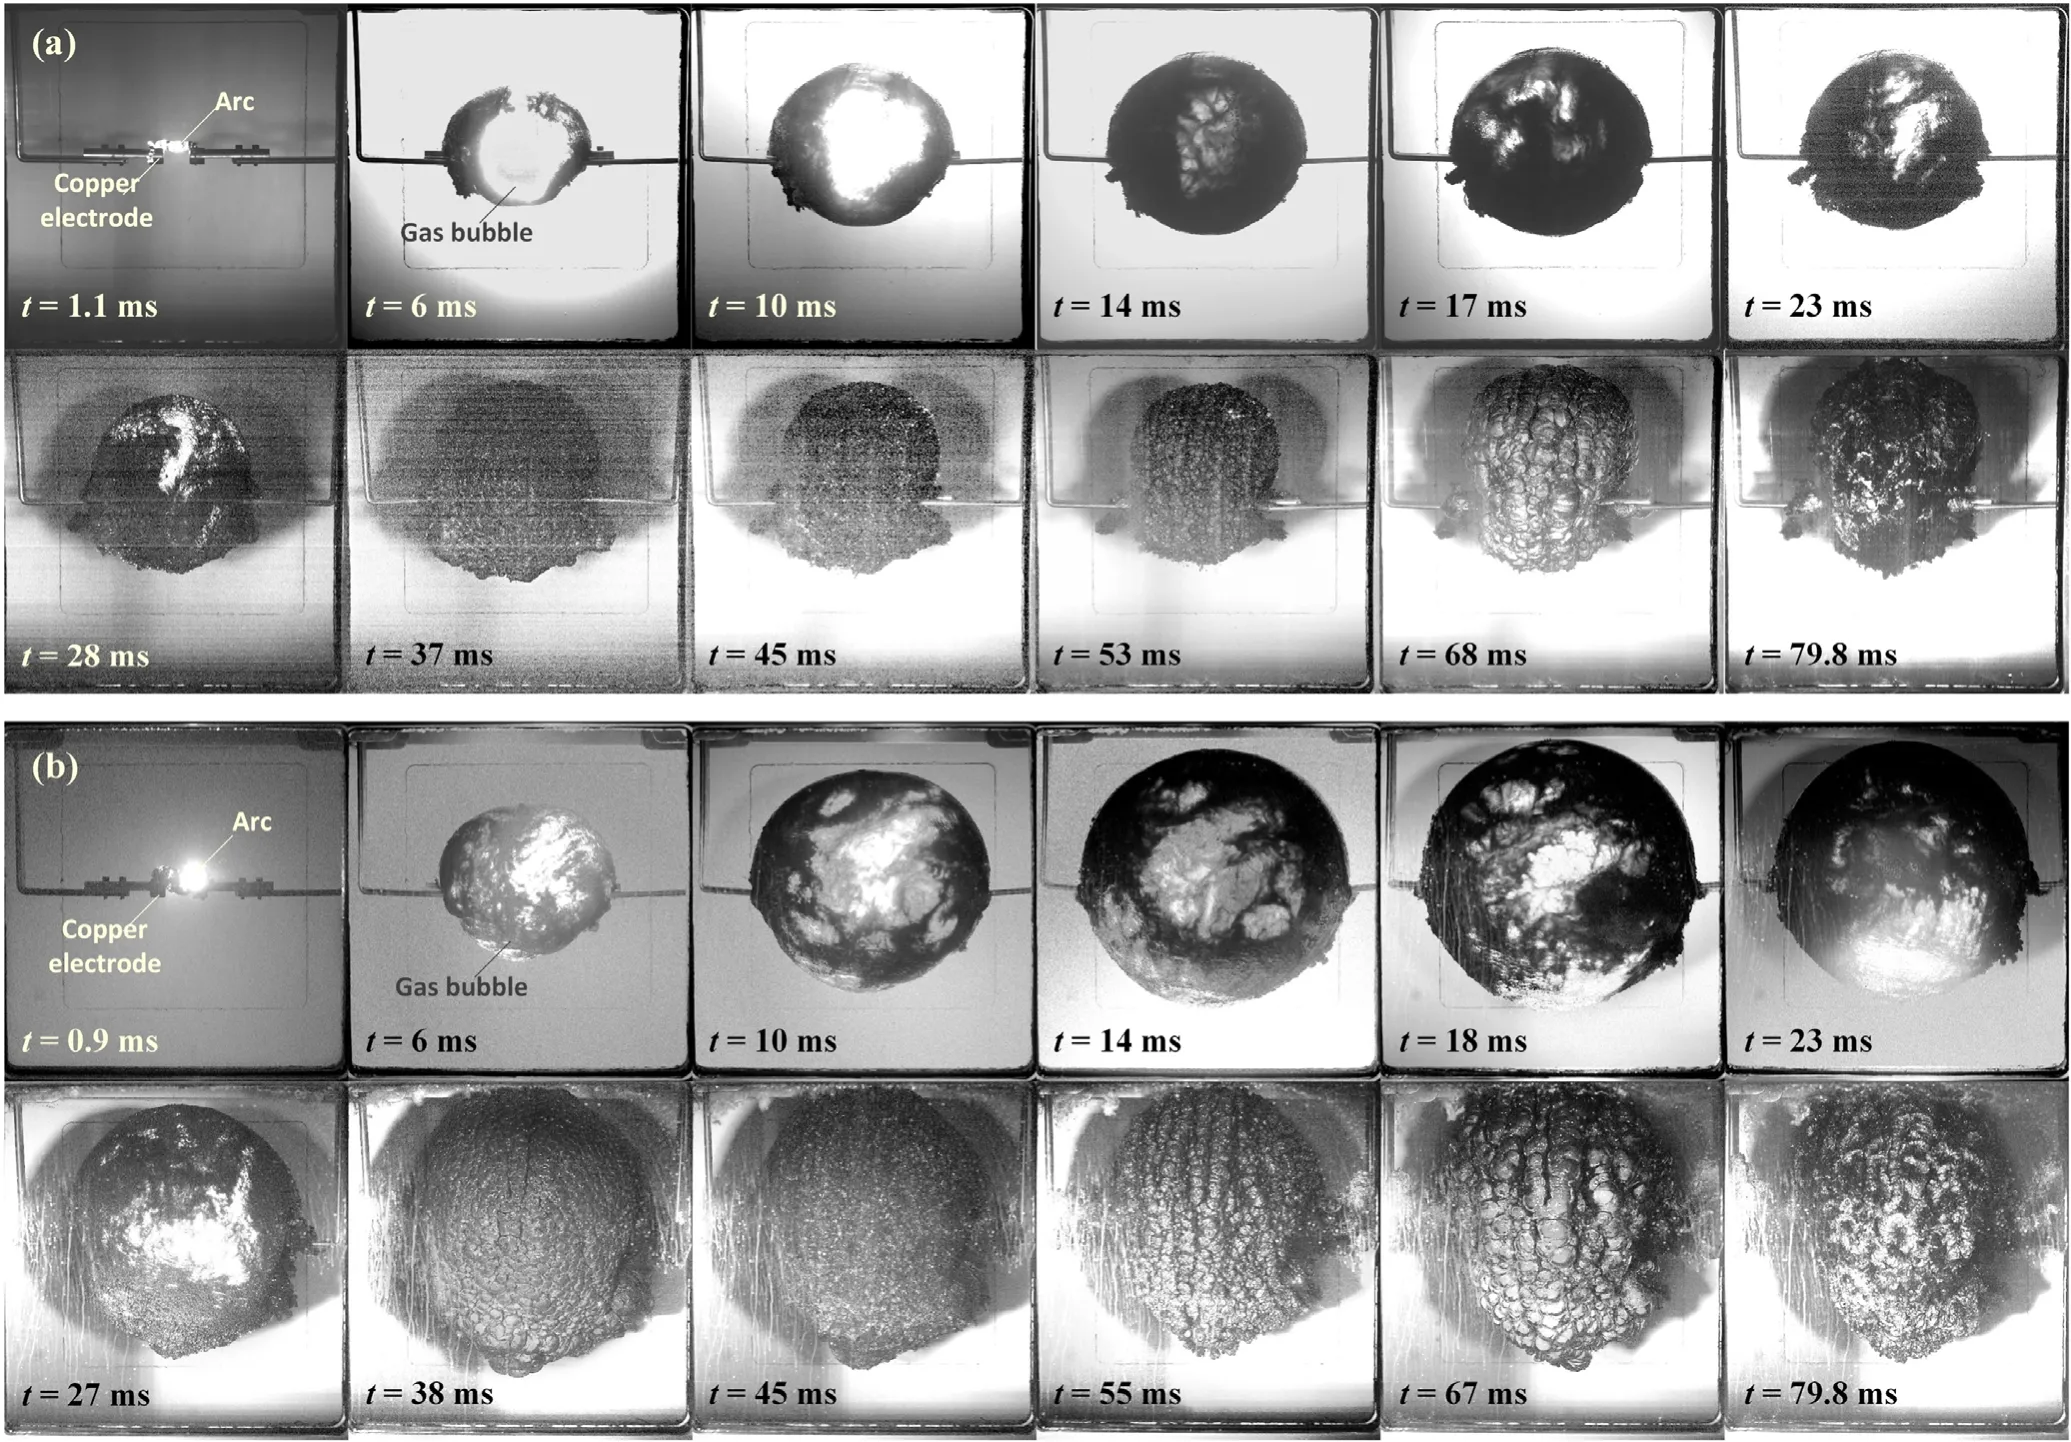
Figure 4.Gas bubble evolution in the arc duration in transformer#1.(a)Case 1:arcing test with a gap length of 50 mm,symmetrical current peak of 12.19 kA, duration of 79.8 ms and total released arc energy of 158.3 kJ; (b)case 2: arcing test with a gap length of 50 mm,symmetrical current peak of 15.85 kA, duration of 79.8 ms and total released arc energy of 284.0 kJ.

Figure 5.Measured waveforms of the arcing test in transformer#1,case 1.

Figure 6.Gas bubble evolution in the arc duration in transformer #2.

Figure 7.Measured waveforms of the arcing test in transformer#2.
From the two cases presented in figure 4, it is observed that for different arc energy levels, the gas bubble presented similar pulsating behaviors throughout the arc duration of 79.8 ms.Specifically, in case 1, the circuit breakers closed at t = 0 ms,creating a large short-circuit current to flow through the copper electrode as well as the fuse wire.At t = 1.1 ms,an arc was ignited in the insulation oil,forming an initial gas cavity of irregular shape around the arc column.The gas cavity then began to expand rapidly and reached its first peak volume at t = 17 ms.Thereafter, the gas bubble volume saturated, and the bubble started contracting.Despite the continuous injection of energy from the burning fault arc,the bubble volume was still maintained at a certain size and pulsated repeatedly until arc extinction at t = 79.8 ms.Notably, dissimilar to the low-energy in-liquid spark discharge or laser ablation, which releases the total energy(mJ)within a very short time duration of several microseconds,a high-energy arc continuously burns and injects the energy (kJ)into the gas bubble over dozens of milliseconds.Therefore, the arc-induced gas bubble showed a distinct behavior manifested as forced pulsating growth instead of damped oscillation.
Taking case 1 as an example, the waveforms of the arc current,arc voltage,arc power and arc energy are presented in figure 5.For the estimation of bubble volume, the polar(vertical)and equatorial (horizontal)radii were measured in this test, and the radius in the depth direction was approximately represented by the polar radius.The dynamic gas bubble volume was then obtained according to the ellipsoid volume formula, and the corresponding equivalent radius is plotted in the third subgraph of figure 5.
When the arc column was formed, a distinct short-lived ignition peak with a voltage of 1.77 kV appeared at t = 1.1 ms, and the gas bubble started to grow.The arc voltage then rapidly decreased to an average value of 270.5 V for a gap length of 50 mm as the fault arc stably burned, and the average voltage drop was 54.1 V cm−1in this test, which was close to the empirical constant value of 60 V cm−1according to previous studies [8, 13].In the meantime, the bubble radius rose to the first peak of 191.5 mm at t = 17 ms.Instead of a continuous expansion, the bubble fluctuated repeatedly around this size afterward and reached 180.5 mm at t = 79.8 ms.
The arc power was obtained from the product of the arc current and the voltage, and its maximum value exceeded 11 MW.The arc energy, calculated from the time integration of the arc power, increased approximately linearly with the arc duration.At t = 79.8 ms,the arc was extinct,and the total energy released was 158.3 kJ.
2.3.2.Test in transformer #2.In test transformer #2, an arcing fault test was conducted with a gap length of 60 mm,asymmetrical arc current peak of 15.89 kA and duration of 76.1 ms.The total arc energy released in this test was 228.1 kJ.Images of the arc-induced gas bubble recorded by a high-speed camera during the test are presented in figure 6.
As shown in figure 6, the gas cavity quickly expanded within the first 12 ms and soon became covered with carbon,which was the marked byproduct of oil decomposition.Therefore,it is reasonably deduced that when the arc burns,a high-temperature high-pressure gas cavity is produced, and according to experimental findings in [25], the internal temperature of the cavity would reach 1500-2100 K.Considering that the surrounding oil remained at almost ordinary pressure, a considerable pressure difference existed between the gas bubble and insulation oil, which drove the gas cavity to rapidly expand in the earlier stage.As the arc energy continued to be injected into the gas bubble,the bubble grew to a larger volume at t = 28 ms.It could be observed that,after t = 48 ms, the bubble surface changed from smooth to rough.This phenomenon is largely due to the instability development resulting from the accumulation effect of disturbance as the bubble expands and contracts.During the later period of bubble evolution, the bubble remained approximately the same size until arc extinction, with more moderate pulsations compared to the two cases in transformer #1.
From figure 7,the arc was ignited at t = 2.7 ms with an ignition peak voltage of 1.89 kV,and the average arc voltage drop in this test was 75.3 V cm−1.After arc ignition, the bubble expanded and reached its peak at approximately t = 28 ms and fluctuated until arc extinction.The experimental results in test transformers#1 and#2 show that the dynamic behavior of the arc-induced gas bubble is pulsating growth rather than a simple continuous expansion.In an attempt to clarify the complex phenomenon, theoretical studies are conducted and introduced in the following section.
3.Theoretical modeling
Based on direct experimental observations, arc-induced bubble growth manifests as a dynamic expansion and compression and cycles over time.Essentially, it is a complicated problem of arc-induced bubble dynamics inside a finite domain.This section focuses on the fundamental characteristics of arc-induced bubbles,constructs a dynamic model for bubble pulsation under a continuous arc, and introduces a corresponding numerical calculation method to solve the problem.
3.1.Arc-induced bubble dynamic model
3.1.1.Bubble internal energy.A high-energy electrical arc in the insulation oil generates a high-temperature high-pressure gas bubble by vaporizing or decomposing the insulation materials.
The arc energy Warcat time t is calculated as follows:

where t0is the time of arc ignition,uarcis the arc voltage and iarcis the arc current.
Neglecting the gas bubble flotation and assuming that the heat transferred from the bubble all results in insulation oil vaporization [25], according to the first principle of thermodynamics,the bubble internal energy Ugascan be obtained by the following:
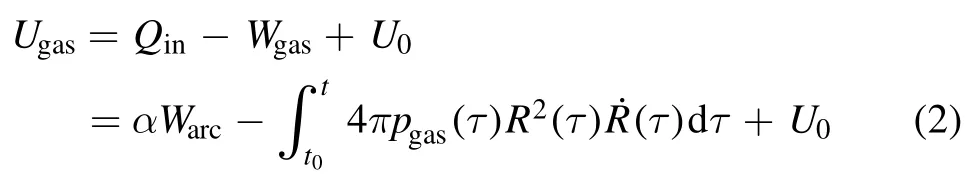
where Qinis the heat supplied by the arc energy defined as αWarc(α is the transfer coefficient obtained from field tests),Wgasis the work done by the growing bubble against the insulation oil,pgasis the gas bubble internal pressure,R is the bubble radius and dot denotes the time derivative.U0is the initial gas internal energy, which is ignored in this model.
3.1.2.Bubble pulsation dynamic model.For a spherical bubble of radius R(t)in an infinite domain with the gravitational effect neglected, the Navier-Stokes equation for motion in the r direction can be written as [20]:

where u is the radial outward flow velocity, r is the radial position,ρ is the liquid density,p is the liquid pressure and ν is the liquid kinematic viscosity.
Substituting the flow velocity u in (3)withaccording to the conservation of mass and integrating the equation from R to the domain boundary re,the equation in a finite domain is expressed as [18]:
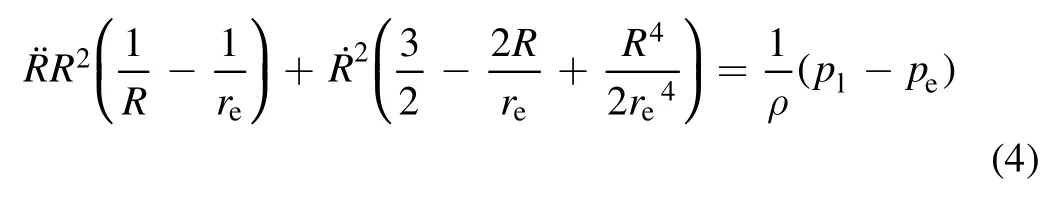
where reis the equivalent radius of the finite domain,plis the liquid pressure acting on the bubble surface and peis the liquid pressure at the domain boundary.
The mixed gas inside the bubble generated by the arc can be regarded as an ideal gas with a composition of approximately 70% H2, 15% C2H2and 15% other hydrocarbons (CH4and C2H4)[8], whose internal pressure pgasfollows (γ-1)Ugas/Vgas.Considering the net force on the bubble-fluid interface as zero and taking equation (2)into equation (4), the bubble dynamic radius in the arc duration is obtained:

where γ denotes the specific heat ratio of 1.352, σ is the surface tension of 0.03 N m−1at the oil-bubble interface, μ is the oil viscosity of 8.6 × 10⁻³Pa·s and Vgasis the gas bubble volume.
3.2.Numerical calculation method
Based on the theoretical model, a numerical calculation method was proposed to simulate the dynamic behaviors of an arc-induced gas bubble during an arcing fault.Figure 8 shows the detailed calculation process.

Figure 8.Numerical calculation process.

Figure 9.Comparison of experimental and calculation results.

Figure 10.Calculation results of different theories.

Figure 11.Dynamic gas growth rates in the arc duration.
In figure 8, N denotes the step counter, where N = 1 corresponds to the time of arc ignition and N = Nmaxaccords with the time of arc extinction.The values of the arc energy Warcand the oil pressure peat the domain boundary are two sets of known data measured from the field tests.First, the initial values of Wgas, bubble radius R and its derivative are specified.Then, the previously obtained Wgas, R and ˙Rare utilized to calculate the time-varying pgasand the amount of work done by the pulsating gas bubble within this time step,which will be accumulated in Wgas.Thereafter,by solving the differential equation of bubble dynamics based on equation (5), the new values of the bubble radius and its derivatives are calculated and updated.
4.Results and discussion
In this section, the calculation results of four specific tests in transformers#1 and#2 are obtained and plotted as solid-line curves in figure 9.The corresponding experimental values of the gas bubble dynamic volume Vgasare also plotted as scattered points in the same graph for direct comparisons.
Comparing the dotted lines and solid lines in figure 9, it is found that the calculation results match well with the experimental data during the whole process and have similar trends and amplitudes.Taking the red solid-line curve as a study case, it rose to the first peak of 65.8 l at t = 18.1 ms,which was close to the experimental result (the red dotted line)of 66.5 l at t = 17.9 ms.Then,it started to decrease and dropped to a valley value of 50.3 l at t = 27.3 ms.Compared with the first valley value of 51.6 l at t = 26.9 ms in the experiment, the findings indicate that the calculation results could give a relatively accurate description of the on-site test in the initial period.Eventually, the solid-line curve reached 65.0 l at t = 79.9 ms, which is basically consistent with the experimental data of 62.3 l.Notably, since the gas bubble in the test is not perfectly ellipsoidal and slightly moves upward due to buoyancy, the experimental and calculation results show a certain degree of deviation.
Furthermore, the calculation results of different gas generation theories are directly compared in figure 10.The orange solid-line curve shows the result obtained from the previous linear theory [1, 14], which suggested a linear relationship of 500 ml kJ−1between the generated gas volume and the arc energy at normal pressure and 2000 K.For the yellow solid-line curve,the gas volume was estimated by the formula V = 0.44ln(Warc+5474.3)-3.8 according to the logarithmic theory from [6, 7].It is apparent that these two steady-state theories produce significant differences compared with the experimental data.Particularly for logarithmic theory, a gas volume of approximately 1.5 m3was calculated from the empirical formula [6].For comparison in the same graph, its result had to be multiplied by 0.1.
In addition, the dynamic gas growth rate is introduced and calculated by Vgas/Warcbased on the experimental data.In figure 11, four dynamic gas growth rate curves under different fault conditions are plotted.The dynamic relationship between the gas bubble volume and the arc energy is not linear or logarithmic but varies over a wide range.
During the initial period of an arcing process in the insulation oil, a gas bubble is generated and expands rapidly,which compresses the surrounding oil and results in an oil pressure rise.As the gas bubble further expands due to inertia,the dynamic gas growth rate reaches its peak.For the blue curve, the peak value exceeds 1100 ml kJ−1at t = 11.4 ms.Subsequently, due to the gas volume saturation and contraction, the dynamic rate decreases despite the continuous arc energy accumulation.As shown in the time range of 40-80 ms in figure 11, all curves gradually fluctuated and remained relatively steady at approximately 200 ml kJ−1.
5.Conclusions
Gas generation and dynamic growth caused by arcing faults are prerequisites and foundations for studies on oil pressure rises and tank ruptures.In our work,experimental and theoretical methods were employed to investigate this complex phenomenon.Arcing fault tests were conducted using two different types of oilimmersed power transformers, and the arc current, voltage and gas bubble growth were measured and filmed.Furthermore, a theoretical model of spherical arc-induced bubble dynamics in insulation oil inside a finite domain has been proposed.The experimental and theoretical results are in good agreement,demonstrating that the gas bubble dynamic behavior in the arc duration is pulsation growth rather than a linear or logarithmic expansion in traditional viewpoints.Based on the direct experimental findings and theoretical investigation, the oil pressurization and tank deformation during arcing faults can be further elucidated and quantitatively analyzed.In addition, further investigations on the erratic characteristics of the high-energy arc in insulation oil and the bubble dynamics implications are necessary to conclude on error analysis.
Acknowledgments
This work is supported by National Natural Science Foundation of China (No.51807151).
ORCID iDs
杂志排行

Plasma Science and Technology的其它文章
- Numerical analysis on the effect of process parameters on deposition geometry in wire arc additive manufacturing
- The influence of charge characteristics of suspension droplets on the ion flow field in different temperatures and humidity
- Characteristic studies on positive and negative streamers of double-sided pulsed surface dielectric barrier discharge
- Hydrophobicity changes of polluted silicone rubber introduced by spatial and dose distribution of plasma jet
- Characteristics of water volatilization and oxides generation by using positive and negative corona
- Preparation of N-doped graphite oxide for supercapacitors by NH3 cold plasma