Numerical analysis on the effect of process parameters on deposition geometry in wire arc additive manufacturing
2022-05-05ShilongFAN樊世龙FeiYANG杨飞XiaonanZHU朱晓楠ZhaoweiDIAO刁兆炜LinCHEN陈琳andMingzheRONG荣命哲
Shilong FAN (樊世龙), Fei YANG (杨飞), Xiaonan ZHU (朱晓楠),Zhaowei DIAO (刁兆炜), Lin CHEN (陈琳)and Mingzhe RONG (荣命哲)
State Key Laboratory of Electrical Insulation and Power Equipment, School of Electrical Engineering,Xi’an Jiaotong University, Xi’an 710049, People’s Republic of China
Abstract Here we develop a two-dimensional numerical model of wire and arc additive manufacturing(WAAM)to determine the relationship between process parameters and deposition geometry,and to reveal the influence mechanism of process parameters on deposition geometry.From the predictive results, a higher wire feed rate matched with a higher current could generate a larger and hotter droplet, and thus transfer more thermal and kinetic energy into melt pool, which results in a wider and lower deposited layer with deeper penetration.Moreover,a higher preheat temperature could enlarge melt pool volume and thus enhance heat and mass convection along both axial and radial directions, which gives rise to a wider and higher deposited layer with deeper penetration.These findings offer theoretical guidelines for the acquirement of acceptable deposition shape and optimal deposition quality through adjusting process parameters in fabricating WAAM components.
Keywords: additive manufacturing, arc plasma, process parameter, deposition geometry,numerical analysis
1.Introduction
Wire and arc additive manufacturing(WAAM)is a promising 3D printing technology for fabricating complex and large-scale metal structural components, which has important engineering application potentials in the field of high voltage power equipment manufacturing.High voltage power equipments, are greatly demanded and widely used in electrical power grid [1], such as high current conductors [2], switchgears [3], and inductors [4].Manufacture of these devices leads to a large scale consumption of metal materials due to shortcoming of existing equipment manufacturing technology [5].In contrast to traditional casting technology, the WAAM shows tremendous technology and economy advantages in high voltage power equipment manufacturing, which includes the improvement of production efficiency, the reduction of production cost and the flexibility of design scheme [6-8].During the WAAM, arc plasma is utilized to melt filler wire to form parts layer-by-layer[9],during which a series of materials[10],including stainless steel[11],copper[12]and aluminium [13], can be applied to deposit metal structural components.Thus,it is especially suitable for fabricating complex and large-scale power equipment.The WAAM breaks through the limitation of forming ability of existing equipment manufacturing technology,and provides new approach into the field of high voltage power equipment manufacturing.
The macroscopic phenomena, such as heat and mass transfer, strongly affect the geometry evolution of liquid melt pool during WAAM processes, which is directly related to the mechanical properties of the final products [14].In order to obtain additively manufactured components with good performances, it is extremely necessary to determine the relationship between process parameters and deposition geometry, and to reveal the influence mechanism of process parameters on deposition geometry.Typically,experimental approaches during WAAM have largely focused on the final geometrical and structural features rather than the transient nature of the process.Dinovitzer et al[15]experimentally studied the effect of process parameters on geometrical morphology and microstructural feature in TIG based WAAM.From their results,they concluded that a lower travel speed or higher current could lead to a wider deposited layer with a deeper penetration.Geng et al [16]investigated the influence that substrate speed and heat source current had on the morphology of a single-layer bead in WAAM.They found that the layer height decreases as increasing either the substrate speed or current.Besides,the layer width increases as rising the current and decreases as increasing the substrate speed.Rodrigues et al [17] studied the effect of wire feed speed/travel speed ratios (WFS/TS)on the singlebeads appearance in UC-WAAM.They determined a contour fill plot of the most feasible process parameters(wire feed speed and travel speed),which divides the window of parameters into four regions.From their results, the suitable WFS/TS ratios could generate regular-shaped beads, but unsuitable WFS/TS ratios could lead to visible humps,discontinuities and irregularshaped beads.However, these experimental studies are hard to reveal the impact mechanisms of process parameters on deposition geometry due to the high temperature,opaque feature and fast flow dynamics of the liquid metal within melt pool.
Besides the experimental approach, numerical modelling is an effective way to optimize the process parameters and predict the deposition morphology.Ogino et al [18] developed a 3D model to study the effect of the interpass temperature and deposited procedure on the geometry appearance of the deposited layer in the CMT process.The arc and the wire are not included in the model,but the related heat input and arc pressure are assumed as the Gaussian distribution.From their results, they concluded that a longer cooling time could form a higher and thinner deposited layer,and a reverse motion direction of the torch could generate more uniform deposition height.Ou et al[14]built a 3D model to compute the thermal field and flow field during the single-layer deposition of WAAM.The effects of wire diameter,wire feed rate, arc power and travel speed on deposition morphology and solidification parameters are investigated.Hejripour et al[19]built a 3D multi-physics model to study the relationship between clad geometry (width, thickness and penetration)and process parameters(travel speed,wire feed rate)during the CWT using GTAW process.In this model,the wire feeding process and the arc plasma are not included into computational domain, but their effects on the thermal and fluid field are equivalently imposed by the form of heat source and boundary condition.The current density, heat input and arc pressure are considered as Gaussian distribution at the top surface of the entire domain.In all of the above modelling research, the interaction among arc plasma, droplet and melt pool was not explicitly computed.However, several basic physical phenomena, including Lorentz force, surface tension arc pressure and buoyancy, have been suggested to have strong relationships with flow dynamics and geometrical evolution within melt pool [20].Therefore, a complete model of WAAM is needed to explore the underlying affect mechanisms of process parameters on deposition geometry to achieve the quality control of components.
In this work,a unified 2D model is developed to simulate the first layer deposition of a vertical rod,to compute the heat transfer,material transport and electromagnetism mechanisms in the arc plasma and metal regions during GMAW-based WAAM process.This 2D model simulates the physical process of WAAM by a coupled approach, which bases on the computation of electromagnetic-thermal-fluid dynamic equations coupling with level set equation.This simulation consists of the formation and detachment of droplets as well as their impingement into melt pool,and the growth and solidification of melt pool.To prove the promising potential of the model, the obtained results by the model are compared against experimental observations in literatures.The aim of the model is to determine the process parameter-deposition shape relations and explore the influence mechanisms of process parameters(wire feed rate,preheat temperature)on the deposition shape.
2.Mathematical models
The schematic diagram of GMAW-based additive manufacturing can be displayed in figure 1(a).The model configuration consists of the filler wire, the arc plasma, the substrate and the gas nozzle.The argon is used as the shielding gas,and the 304 stainless steel is selected as the material for the filler wire and substrate.In particular, the gas nozzle is not included into the computational domain.Considering the symmetry of the entire model, only half of total meshes is computed, as shown in figure 1(b).The cylindrical coordinate system is as follows:the point M is set as the origin,the r-axis points to the right and the z-axis corresponds to the reverse direction of metal deposition.
2.1.Basic assumptions
Considering the complexity of the modeling, the following assumptions are made to simplify the calculation:
(1)A 2D axisymmetric geometry is assumed in the model.The wire is fed downward along the axis and the substrate is assumed to be fixed.
(2)The arc plasma is at local thermodynamic equilibrium(LTE)[21, 22] and the effects of metal vapors are not considered [19].
(3)The argon is considered as gaseous phase, both the liquid and solid 304 stainless steel are recognized as liquid phase.The two-phase flow is treated as incompressible laminar flow with Newtonian flow characteristics [19, 23].
(4)The eddy current caused by the time-varying magnetic field in arc and metal regions is not considered [24].
(5)The Marangoni stress due to surface tension gradients is ignored, since the impact momentum carried by droplets causes a strong fluid flow [23, 25-27].
2.2.Level set approach
The gas-liquid interface is captured using the level set approach.The scalar Φ divides the fluid configuration for all of the grid cells into three types, gaseous phase, liquid phase and mixture phase.For each one of the meshes, Φ = 0 represents that the mesh is in gaseous region, Φ = 1 represents that the mesh is in liquid region,and Φ = 0.5 represents that the mesh is at gas-liquid interface.Besides, the Φ value of mixture phase is between 0 and 1.The convection transport equation of scalar Φ can be expressed as [28]:

whereγlsis the reinitialisation parameter,∊lsis the interface thickness andvis the velocity vector.
The delta functionδ( φ)is used to impose boundary conditions at the gas-liquid interface by adding source terms[28, 29].Moreover, the material properties of the two-phase flow, such as densityρ, electrical conductivityσ, thermal conductivitykand dynamic viscosityμeqare assigned using the variable φ, which can be expressed as follows [30, 31]:

whereαis the material properties of the two-phase flow,αgis the material properties of gaseous phase,αmis the material properties of liquid phase.
2.3.Governing equations and source terms
The Navier-Stokes equations and energy conservation equation are used to solve temperature and flow fields, the Maxwell’s equations are applied to compute electromagnetic field in arc plasma and metal regions.
Conservation of mass:

Conservation of momentum:

wheretis the time,Pis the pressure,is the identity matrix,(·)Tis the transposed matrix,is the gravitational acceleration, ⇀is the Darcy damping force,⇀ is the surface tension,⇀is the electromagnetic force.
Conservation of energy:

whereCpis the specific heat,Tis the temperature,SJouleis the Joule heat,Qradis the radiation heat loss,Sanodeis the heat source at anode sheath layer,Scatodeis the heat source at cathode sheath layer.
Electric potential:

whereVis the electrical potential.
Magnetic vector potential:

whereμ0is the magnetic permeability,is the magnetic potential.
Magnetic field:

Ohm’s law:

The surface tension is converted to volume force by multiplying the delta functionδ( φ), and then is introduced into the momentum equation as a source term [28].The surface tension can be described as:

whereγis the surface tension coefficient,is the normal unit vector,κis the curvature of free surface.
In this study, the increase of electromagnetic force induced by the current pulse is not explicitly calculated.According to Wang [32], the electromagnetic force proportionally increases accordingly with the square of current density.The electromagnetic force is equivalently increased to the square of the ratio of the peak current to the base current during the high level of the pulse,which is expressed as[25]:
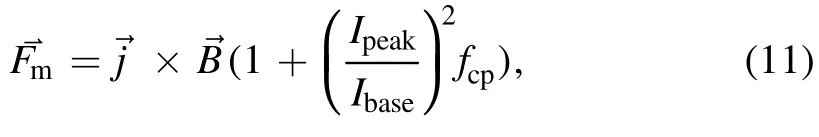
whereIpeakis the peak current,Ibaseis the base current,fcpis the periodic pulse function.
The Joule heatSJoulein both arc plasma and metal regions can be calculated as follows:

The radiation heat lossQradfrom the arc can be approximately computed by an empirical expression about net emission coefficient, which is described as [33, 34]:

where∊Nis the net emission coefficient.
Due to that the sheath layers at the anode/arc interface and arc/cathode interface do not meet the LTE condition,two energy source terms are introduced into the energy equation to treat the heat effect of sheath layers [35-37].At the anode surface,the source termSanoderepresents the heating effect due to the absorption of the electrons,which can be calculated as:

At the cathode surface, the source termScathodeincludes both ions heating energy and electrons cooling energy.The heating effect is due to that the positive ions are absorbed by the cathode surface, while the cooling effect is caused by the fact that the electrons leave from the cathode surface [34].The source termScatodecan be computed as:
Moreover,if the thermionic current densityexceeds the total current densitythe ions current densityequals to zero.Otherwise, the ions bombard the cathode surface and supply extra current density [35].The theoretical thermionic current densityat the cathode surface can be expressed as:

whereAris the Richardson’s constant,eis the elementary charge,eφis the cathode effective work function,kBis the Boltzmann constant.
2.4.Solid-liquid phase change
In this model,two methods are exploited to treat the metal phase change.The first method is the enhanced viscosity method applying to all metal domains.Below the solidus temperature,a large dynamic viscosity (1000 Pa· s)is applied to suppress the flow velocity of the liquid phase [25].Above the liquidus temperature,the real dynamic viscosity is utilized.In the mushy region,a smooth transition occurs in the dynamic viscosity.The dynamic viscosity of the metal is given as [28, 29]:

The volume fraction of liquid metalflis a function related to the temperature, which is defined as [30]:

whereμlis the dynamic viscosity of liquid metal,sμis the dynamic viscosity of solid metal,Tlis the liquidus temperature,Tsis the solidus temperature.
As the second approach, the Darcy force is applied to the wire, which can decrease the axial velocity of the solid metal to zero during the wire feeding process.This not only avoids filler wire suffering from the axial impediment, but also eliminates the undesired motion of the wire along radial direction.The Darcy force can be described as[28, 29, 35]:
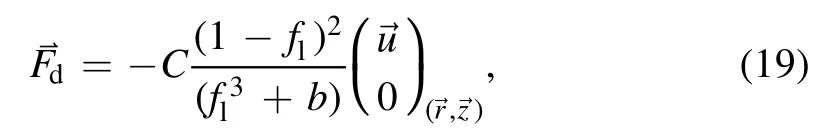
whereCis a huge constant (1 × 10⁹),bis a low constant (0.001).
To solve the fusion and solidification of the metal, the latent heat of fusion is introduced into the formula of specific heat capacity [34].
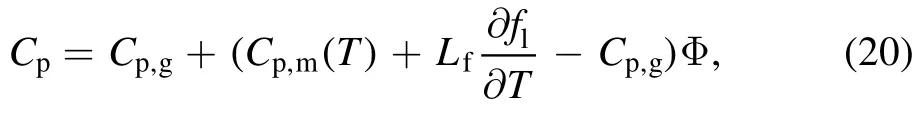
whereCp,gis the specific heat of gas,Cp,m(T)is the specific heat of metal,Lfis the Latent heat of fusion.
2.5.Boundary conditions
The fixed wire feed rateviand the gas inlet velocityvgas(r)are assigned to the boundaries AB and BC, respectively.Along the gas inlet boundary BC,the inlet velocity in the z direction can be defined as [19, 25, 30]:

whereQvis the volume flow rate,Rnis the nozzle radius,Rcis the wire radius.
The outlet boundaries of both the thermal field and fluid field are imposed on FG and GH.The heat insulation and the non-slip conditions are set to the inner wall of the gas nozzle CD,DE and EF.The temperatures along the boundaries AB and BC are set as ambient temperature 300 K.The pressure along the boundaries FG and GH are assigned to atmospheric pressure.The current of 40 A is imposed on the top of the wire,and grounding condition is set to the bottom of the substrate.The heat loss conditions caused by convection and radiation are imposed on the substrate surface HI and IJ, which can be expressed as follows[18, 19]:

wherehcis the convective heat transfer coefficient,Tambis the ambient temperature,εis the radiation emissivity,Bσis the Stefan-Boltzmann constant.
2.6.Simulation conditions and material properties
A trapezoidal current waveform is applied in the one-dropletper-pulse (ODPP)WAAM process, which is shown in figure 2.The flow rate of pure argon is 15 l min−1[25, 38].The base current of 40 A and 0 A are respectively applied to the wire during the deposition and solidification process.Thepeak current is set as 300 A.Five cases are computed by varying one of these parameters and keeping being the same for all of the others.The combination relation of process parameters is given in table 1.

Table 1.Simulated cases.
All of the physical properties used in the simulation are summarized in table 2.
2.7.Solver settings and meshing
The simulation is implemented by the COMSOL Multiphysics.All physics interfaces used in this model (magnetic field, electric field, flow field, thermal field and level set)are computed separately by two solvers:the stationary solver and the transient solver.At each time step, the electromagnetic problem is firstly solved by the stationary solver, and the thermal and fluid flow problems are then computed by the transient solver.The coupling is performed through data transfer between solvers in each time step.This process is iterated at all of the time steps until the giving time is finished.In order to precisely capture the moving interface with a reasonable calculation time,non-uniform free triangular mesh is used [43].As shown in figure 3, the meshes size for the regions of the vicinity of the gas/liquid interface is set as 0.025 mm, while the meshes size for the domains far away from the gas/metal interface is set as 0.1 mm.The time step size of 1 ×10⁻⁴s is applied during heating and cooling process.The simulation was run within 20 h on the computer with 10 cores (3.3 GHz)and 32 GB RAM.
3.Results and discussion
3.1.Arc behavior and metal transfer
The model of WAAM can be applied to simulate the metal transfer process.The temporal and spatial distributions of the temperature field in metal regions and arc plasma during the deposition of the first two droplets are illustrated in figure 4.Under the effect of the base current, the shielding gas is ionized and the arc is ignited at the region between the substrate and the wire.The maximum temperature in the bellshaped arc is around 14 000 K.Under the effect of the arc heating and the sheath heating,the tip of the filler wire melts.In the first 20 ms, a round droplet forms and grows larger at the wire tip under the combined effect of the electromagnetic force, surface tension force and gravity force.At t = 20 ms,the imposed current pulse greatly enhances the electromagnetic pinch force.From this moment, the intensified electromagnetic force continuously pinches and elongates the droplet to form liquid metal bridge at the neck.At t = 22.5 ms, the pendent droplet turns into pear shape from round shape.At t = 24 ms,the pinch force ruptures the liquid bridge and the droplet detaches from the wire tip.As the droplet flies by the arc plasma,its temperature rises under the heating effect of the arc.At the same time,the velocity of the droplet increases under the accelerating effect of the electromagnetic force and gravity force.Once the droplet contacts the substrate,the substrate surface is heated and melted by the thermal energy carried by the droplet.At t = 30 ms,it can be observed that the melt pool appears at the substrate surface.At t = 44 ms, the current pulse is imposed once again.From t = 44 ms to t = 60 ms,the metal transfer recurs and the melt pool enlarges.From t = 60 ms to t = 67 ms,the arc gradually extinguishes.
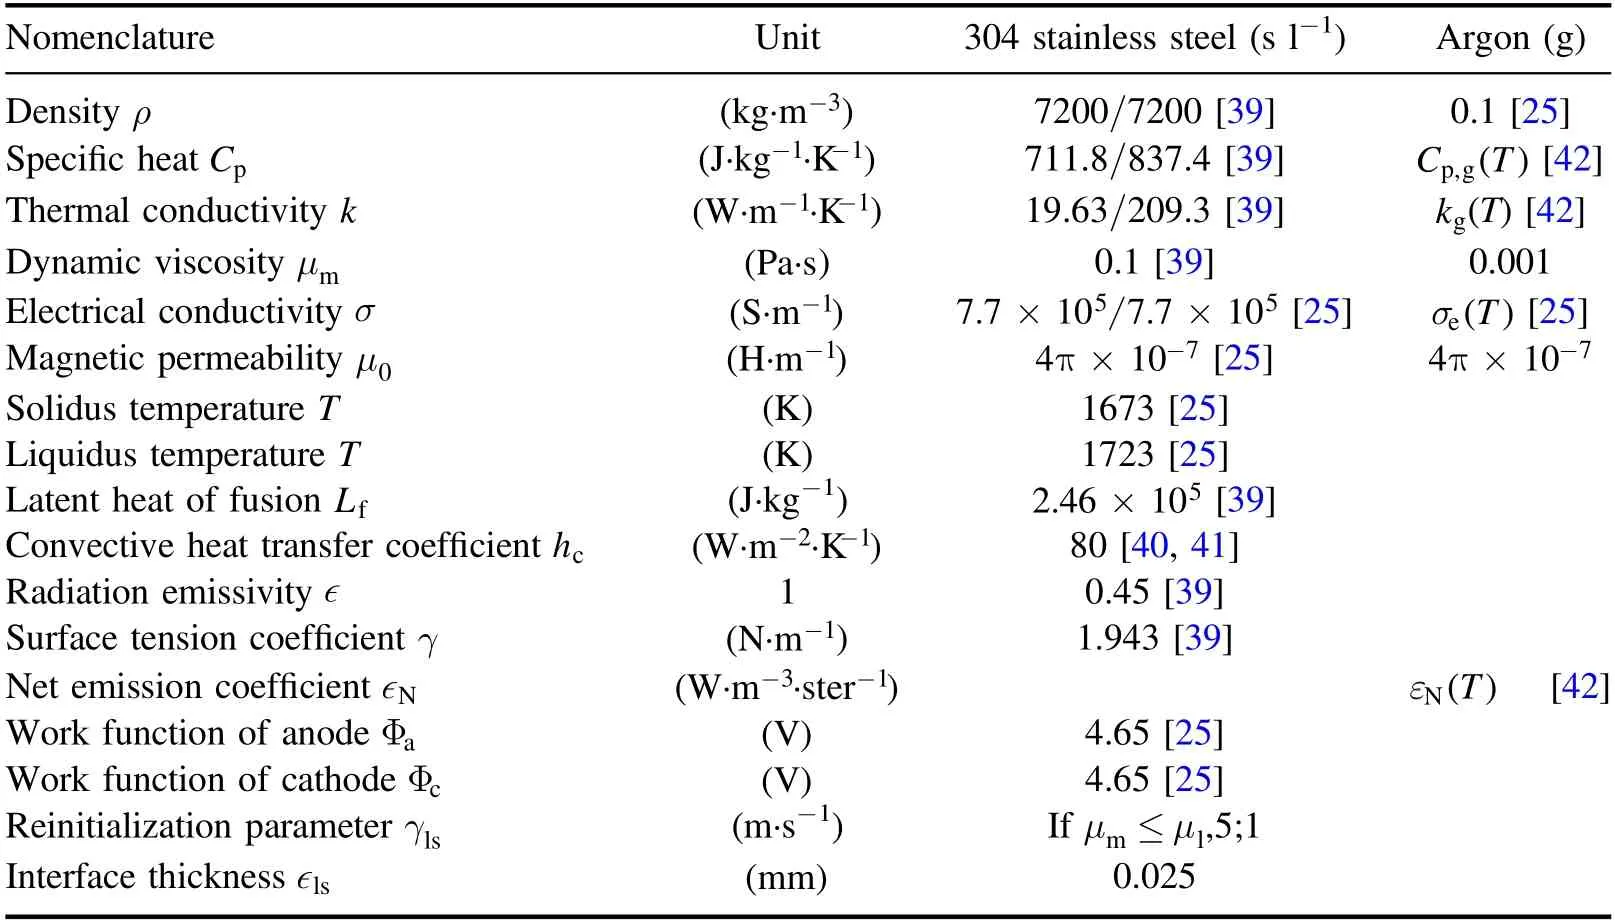
Table 2.Material properties.
3.2.Validation of model
To validate this model,the metal transfer during a pulse cycle is compared with the high-speed images from Bruno et al[44], as shown in figure 5.It is clear that the computed data agree basically with the measured results in respect of the detaching time of droplet.Besides, the computed average value of the droplet impact velocity is 1.025 m s−1, which is comparable to 0.98 m s−1observed by Hu et al [45].The agreement of the droplet detaching time and the impact velocity computed by the model with experimental results in literature provides confidence in using the model to study the underlying influence mechanism of process parameters on deposition geometry and grains feature.
3.3.Liquid metal dynamics
The model is also utilized to quantify and analyze the liquid metal flow dynamics, which visualizes the internal flow behavior and enhances the understanding of the heat transferfluid flow relation in metal regions.Figure 6 highlights the evolution of the velocity field in the metal regions during the 2nd deposition cycle.After the deposition of the 1st droplet,the 2nd droplet gradually generates and becomes larger at the wire tip.At the same time, the fusion line gradually shrinks and the flow velocity continuously decreases in the melt pool.Before t = 43 ms, the liquid metal within the droplet flows down.At t = 43 ms, the fluid flow pattern within the droplet changes and two vortexes appears at its two sides.The two vortexes drives the hot liquid metal at the bottom to run up,which can help to melt more filler wire and enlarge the droplet.At t = 45 ms, the liquid metal bridge forms under the effect of the electromagnetic force and surface tension as well as gravity, which leads to the downward flow of fluid within the droplet.As the necking intensifies, the distribution of the electromagnetic force acting on the liquid bridge changes,which results in the change of flow direction inside it.At t = 46 ms, the liquid metal above the neck flows up and the liquid metal below the neck flows down under the effect of the electromagnetic force.At t = 47 ms, the droplet leaves from the wire tip and flies toward the substrate.At the same time, the backflow appears at the wire tip under the effect of the surface tension force.At t = 49 ms, the 2nd droplet carrying kinetic energy entries into the completely solidified melt pool.Under the effect of the impact momentum, the liquid metal flows toward both the bottom and outer edges of the melt pool.At t = 50 ms, the flow pattern with the melt pool quickly changes from downward flow to upward.At t = 51 ms and 52 ms, the liquid metal within melt pool continues to flow downward and upward under the influence of the inertia.The oscillation of the melt pool constantly repeats and reaches the equilibrium state until t = 58 ms.Besides the impact momentum, the thermal energy taken by the droplet is also transferred into the melt pool.The up-anddown oscillation of the melt pool promotes the spatial exchange of liquid metal and drives the hot fluid rush at the fusion line to melt more unfused substrate,which can help to deepen the penetration.At t = 60 ms, the current changes from 40 A to 0 A and the arc gradually extinguishes.Since the energy dissipation from the melt pool to the substrate by conduction and radiation, the melt pool shrinks with time,rendering complete solidification of melt pool at t = 67 ms.

Figure 1.(a)Schematic diagram of the GMAW-based additive manufacturing, (b)computational domain of the model (mm).

Figure 2.The waveform of pulse current used in the model.
Figure 3.Meshes of model.

Figure 4.Computed evolutions of temperature field in arc plasma(left)and metal regions (right)during the first two deposition cycles (K).

Figure 5.Comparison of computed and measured [44] detached moment during metal transfer.
3.4.Effect of preheat temperature on deposition geometry
To explore the effect of preheat temperature on deposition geometry, three cases (C1, C2, C3)are performed under different preheat temperatures i.e.300 K, 600 K and 800 K.Figure 7 illustrates the variation of layer width, layer height and the depth of penetration under different preheat temperatures.It is observed that the higher preheat temperature generates a wider and lower deposition layer with a deeper penetration.The observed flow dynamics suggests that deposition geometry is directly correlated with heat transfer and fluid flow in the melt pool.To better explain geometric shape, the distributions of temperature field in the melt pool under different preheating conditions are presented in figures 8(a)-(c).The greater the preheating temperature is,the faster the time that solid substrate material reaches its melting point is,and thus the volume of the melt pool becomes larger.Figures 8(d)-(f)present the distributions of flow field in the molten pool for cases with different preheat temperatures.It is clear that the melt pool with a larger volume has higher flow rate.The combined effect of the impact momentum carried by the droplet, arc pressure and gravity tend to drive the flow from the top to the outer edge and bottom in the melt pool.The greater the volume of the melt pool,the stronger the heat and mass convection in the melt pool.The enhancement of outward flow tends to transfer more hot liquid metal towards its lateral edges from the top region in the melt pool,causing that the deposited layer becomes wider and lower.At the same time, the enhancement of downward flow tends to transport more hot liquid metal towards the bottom from the top region in the melt pool,which can help to melt more solid substrate below the fusion line and thus makes the penetration become deeper.In the work of Takeyuki et al [46], layer width increases and layer height decreases as increasing the preheat temperature, which agrees with the predicted results by the model.

Figure 6.Computed evolutions of fluid field in metal regions (m s−1)during the 2nd deposition cycle.(The white lines represent the melt pool boundaries, and the red arrows symbolize the fluid flow directions.)

Figure 7.Relationship between preheat temperatures and deposition geometry (mm).(The right schematic diagram displays the measured positions of layer width, layer height and the depth of penetration.)

Figure 8.The distribution of the temperature and the velocity field in the initial solidification stage under the preheat temperatures of(a),(d)300 K,(b),(e)600 K and(c),(f)900 K.(The black arrow points the location of the lowest point,the white arrow points the maximum speed of the red rectangle.)
3.5.Effect of wire feed rate on deposition geometry
To analyze the effect of wire feed rate on deposition geometry, three cases (C1, C4, C5)are executed under different wire feed rates i.e.2.5 m min−1, 3 m min−1and 3.5 m min−1.According to Palani [47], the wire feed rate must match with wire melting rate to stabilize the arc length.The burn-off rate is directly related with the current, and a higher current tends to induce greater Joule heating and thus melts a larger amount of filler wire.However,the pulse of current is not considered in the inlet current in the model.Hence, a Gaussian heat source is applied at the wire tip to equivalently replace the increase of Joule heating effect caused by the increased current.As adopted by Cadiou [25], the power of the Gaussian heat source is equal to the volume integrals of Joule heating calculated by the model, which can be expressed as follows:

whereais an adjustable constant to regulate the arc length,r0is the Gaussian distribution parameter which equals to the radius of the filler wire.
The layer width,layer height and depth of penetration for cases with different wire feed rates are presented in figure 9(a).It is observed that the greater wire feed rate generates a wider and higher deposition layer with a deeper penetration.The wire feed rate exerts influence on the morphology of deposition layer through changing the thermal energy and the momentum carried by the droplet transferring into the molten pool.The calculated diameter and average temperature of the droplets for cases with different wire feed rates are presented in figure 9(b).It can be seen that a higher wire feed rate could generate a larger and hotter droplet.A larger volume of the droplet enables to transfer more kinetic energy into the melt pool,while a higher average temperature of the droplet increases the heat input into the melt pool.The kinetic energy transferred into the melt pool under different wire feed rates is shown in the table 3.Figures 10(a)-(c)illustrate the distribution of fluid field in the melt pool under different wire feed rates.It is clear that the melt pool obtaining more impact momentum could induce stronger radial and axial convection, which accelerates the fluid motion from the top to the rim and the bottom within the melt pool, which leads to the final shape of the deposited layer becoming wider.At the same time, the enhanced axial convection favors the scouring effect of the hot liquid metal for the unfused substrate, rendering a deeper penetration.In addition, the layer height increases with the wire feed rate,which is due to that a larger wire feed rate enlarges the volume of the droplet and thus transfers more metal material into the deposited layer.The variation trend of bead shape with wire feed rates computed by the model is qualitatively consistent with the simulated data by Ou W et al [14].
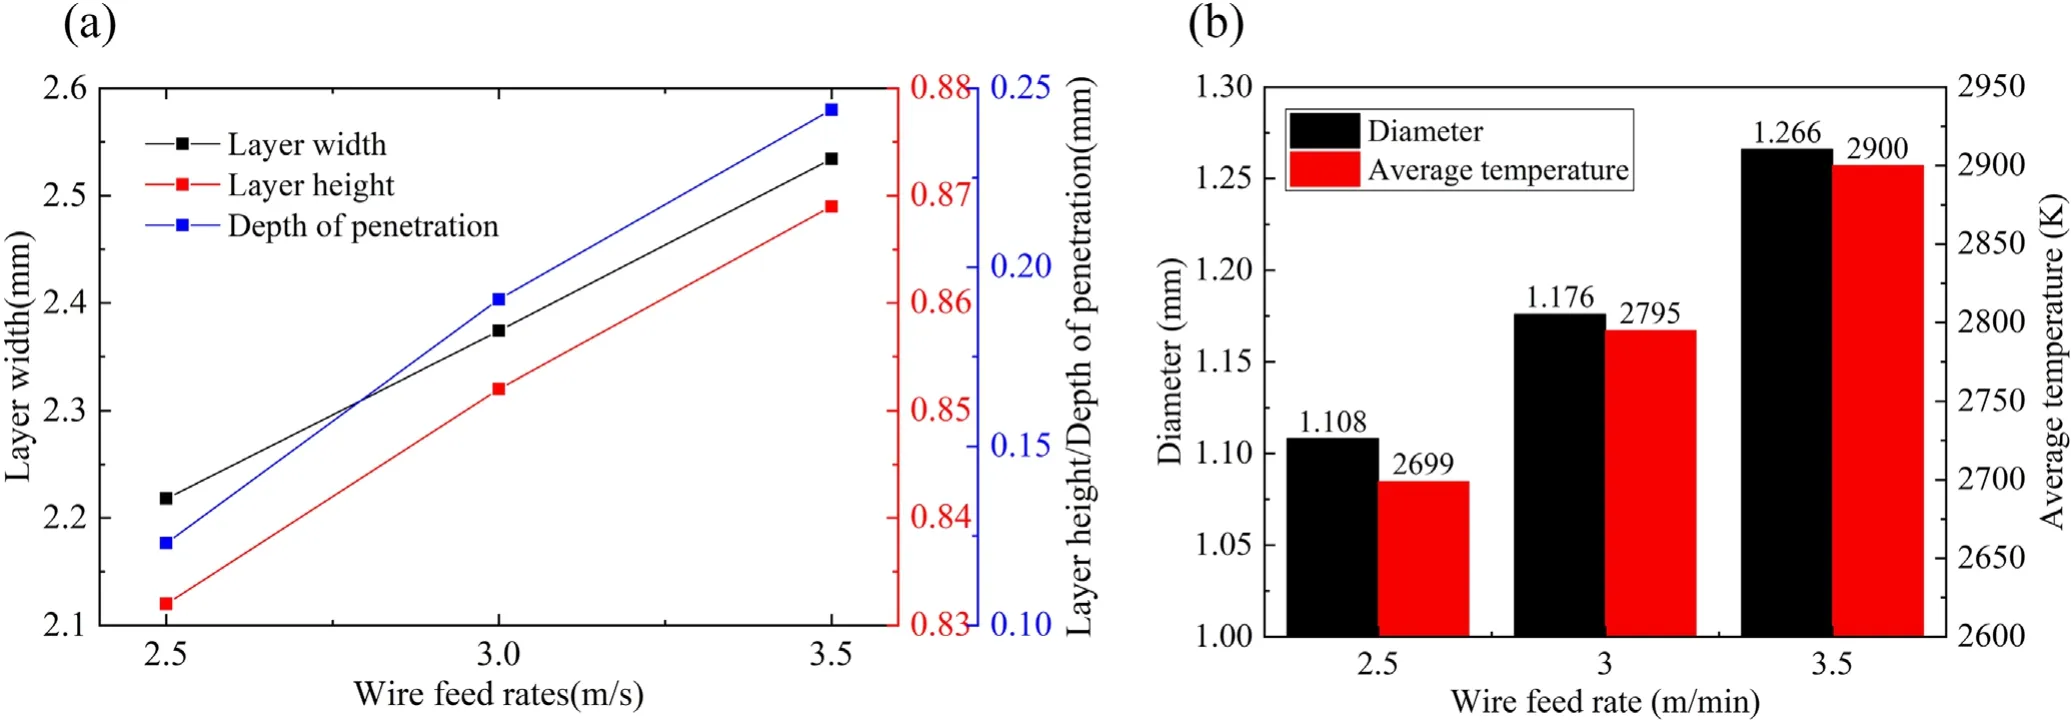
Figure 9.(a)Relationship between wire feed rates and deposition geometry(mm),(b)diameter and average temperature of detached droplet under various wire feed rates.
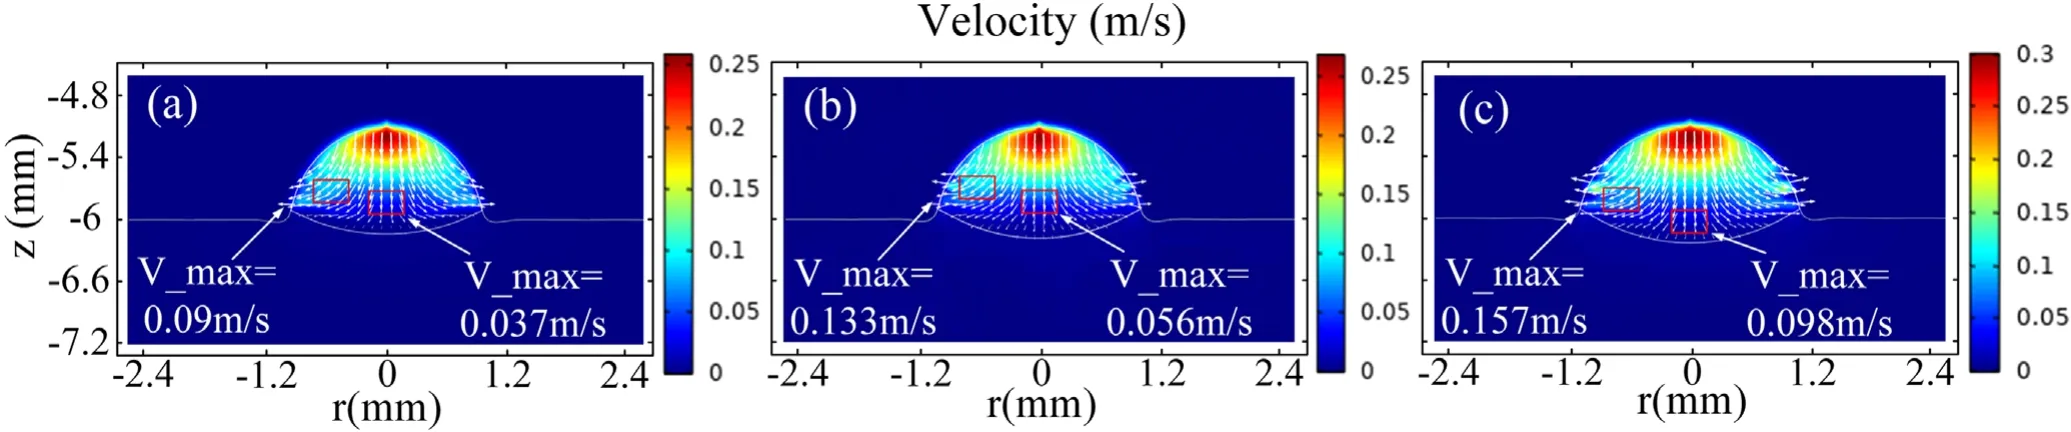
Figure 10.The distribution of the velocity field in the initial solidification stage under the wire feed rates of(a)2.5 m s−1,(b)3 m s−1 and(c)3.5 m s−1.(The white arrow points the maximum speed of the red rectangle.)
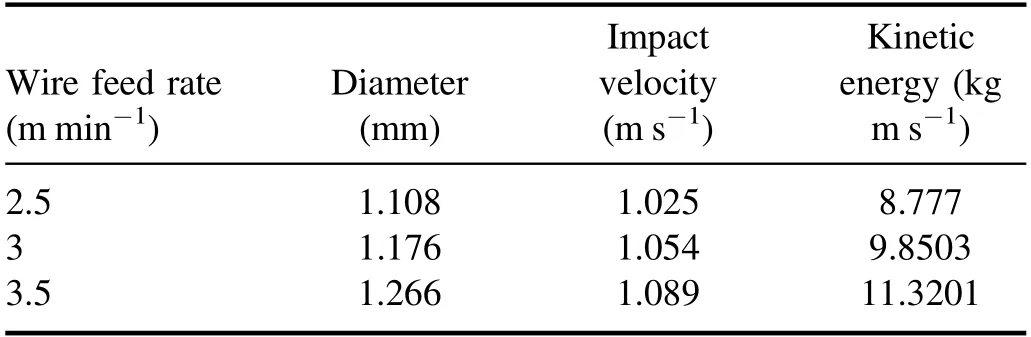
Table 3.Kinetic energy transferred into the melt pool
4.Conclusions
In this study, a unified 2D model of WAAM is developed to compute the heat transfer and mass transfer in the arc plasma and metal regions,which considers the coupling of flow field,thermal field and electromagnetic field.Using this model,the impact mechanisms of various process parameters on the deposition morphology are investigated.Besides, the relationship between substrate preheat temperature and solidification morphology is revealed by the model.The key conclusions are summarized as follows:
1.The model not only considers the interaction among arc plasma, droplets and melt pool, but also analyzes the evolution mechanism of electromagnetic,heat transfer and mass transport in arc plasma and metal regions.The metal transfer and melt pool dynamics are computed in the model.
2.Layer width, layer height and depth of penetration linearly increase with wire feed rate.A higher wire feed rate could generate a larger and hotter droplet,and thus transfer more thermal and kinetic energy into melt pool.The enhanced energy and impact momentum increase layer width and depth of penetration, and the enlarged droplet volume increases layer height.
3.Increasing preheat temperature tends to generate a wider and lower deposited layer with deeper depth of penetration.A higher preheat temperature could enlarge melt pool volume and thus enhance heat and mass convection along both axial and radial directions, which would accelerate the fluid motion to the outer edge in the melt pool, and give rise to a wider and lower deposited layer.
4.The model determines the relationship between process parameters and deposition geometry, and reveals the influence mechanism of process parameters on deposition geometry,which offers theoretical guidelines for fabricating optimal WAAM components through adjusting process parameters in high voltage power equipment manufacturing.
Acknowledgments
This work was supported by National Natural Science Foundation of China(Nos.52077172,U1966602),Shaanxi Province‘Sanqin scholar-s’Innovation Team Project(Key technology of advanced DC power equipment and its industrialization demonstration innovation team of Xi’an Jiaotong University).
猜你喜欢
杂志排行

Plasma Science and Technology的其它文章
- Investigation of the gas bubble dynamics induced by an electric arc in insulation oil
- The influence of charge characteristics of suspension droplets on the ion flow field in different temperatures and humidity
- Characteristic studies on positive and negative streamers of double-sided pulsed surface dielectric barrier discharge
- Hydrophobicity changes of polluted silicone rubber introduced by spatial and dose distribution of plasma jet
- Characteristics of water volatilization and oxides generation by using positive and negative corona
- Preparation of N-doped graphite oxide for supercapacitors by NH3 cold plasma