Spatial characteristics of nanosecond pulsed micro-discharges in atmospheric pressure He/H2O mixture by optical emission spectroscopy
2022-02-24ChuanjieChen陈传杰ZhongqingFang方忠庆XiaofangYang杨晓芳YongshengFan樊永胜FengZhou周锋andRugangWang王如刚
Chuanjie Chen(陈传杰) Zhongqing Fang(方忠庆) Xiaofang Yang(杨晓芳)Yongsheng Fan(樊永胜) Feng Zhou(周锋) and Rugang Wang(王如刚)
1School of Information Engineering,Yancheng Institute of Technology,Yancheng 224051,China2School of Automotive Engineering,Yancheng Institute of Technology,Yancheng 224051,China
Atmospheric pressure micro-discharges in helium gas with a mixture of 0.5%water vapor between two pin electrodes are generated with nanosecond overvoltage pulses. The temporal and spatial characteristics of the discharges are investigated by means of time-resolved imaging and optical emission spectroscopy with respect to the discharge morphology,gas temperature, electron density, and excited species. The evolution of micro-discharges is captured by intensified CCD camera and electrical properties.The gas temperature is diagnosed by a two-temperature fit to the ro-vibrational OH(A2Σ+–X2Π,0–0)emission band and is found to remain low at 425 K during the discharge pulses. The profile of electron density performed by the Stark broadening of Hα 656.1-nm and He I 667.8-nm lines is uniform across the discharge gap at the initial of discharge and reaches as high as 1023 m−3. The excited species of He,OH,and H show different spatio-temporal behaviors from each other by the measurement of their emission intensities,which are discussed qualitatively in regard of their plasma kinetics.
Keywords: atmospheric pressure micro-discharges,nanosecond repetitively pulsed discharge,helium,optical emission spectroscopy
1. Introduction
Atmospheric pressure micro-discharges exhibit distinctive merits in applications, such as plasma medicine, surface treatment, combustion enhancement, and environmental remediation, for their high chemical reactivity, easy operation,and low maintenance cost.[1–3]With increasing pressure the electron–neutral collision frequency increases up to 109s−1at atmospheric pressure, leading to a sufficient momentum transfer via elastic collisions, and thus the discharges have a tendency to approach the state of thermal equilibrium.[4]Such high gas temperature restricts their applications in the treatment of heat-sensitive materials,such as biological tissue and polymers,[5]and leads to discharge contraction. Over the years, several techniques have been proposed to prevent excessive gas heating.[4]One of the most efficient methods is to generate the discharge by applying a pulsed high voltage with short duration across the electrodes, as the typical timescale of gas heating is of the order of hundreds of nanoseconds or longer. Therefore,nanosecond repetitively pulsed(NRP)discharges are of great interest for applications due to their nonequilibrium state.[6,7]Numerous designs of electrode geometry have been realized and one of which is the pin-to-pin discharge for it has the simplest electrode configuration and well reproducible in time and space.[8–10]
In the last two decades,many properties of the pin-to-pin NRP discharges have been reported. Paiet al.investigated the three regimes (corona, glow, and spark) and streamer-tospark transition of NRP discharge in air.[9,11]Rusterholtzet al.verified the fast gas heating mechanism in air discharge occurs at nanosecond time scales due to the dissociative quenching of oxygen by electronically excited states of nitrogen N2(B/C).[12]Shaoet al.found that the fast runaway electrons and x-rays produced from the streamer head are benefit to obtain a diffuse and homogeneous discharge.[13]Huanget al.studied the effect of the repetition rate on the discharge properties, which found that the residual charges from previous discharge pulse play a key role in the breakdown period.[14]Recently a thermal spark discharge in air was generated by applying a single high voltage pulse.[15]Previous works on the discharges in air, nitrogen or noble (He, Ar) gases have been studied extensively with regard to the time evolution of the densities of electrons, reactive species (such as oxygen atoms,excited nitrogen molecules N2(A,B,C)and N2(υ),nitrogen oxide NOx, OH radicals), the neutral and vibrational temperatures.[16–19]However, the properties of such microdischarges show steep gradients in both time and space due to their filamentary in nature, which have significantly impact on the plasma chemistry. In many applications, water vapor (H2O) is usually added as a reactive gas or already present in the operation environment as impurity to providea rich source of OH radial which plays a vital role in plasma chemistry.[5,20,21]The specific case of NRP generated in water containing helium gas is an interesting one due to its low gas temperature and breakdown voltage,and high electron excitation energy in comparison to other gases.[19,21]For He–H2O mixture, Verreyckenet al. studied the kinetics of OH radical in NRP discharges using spatially resolved laser-induced fluorescence (LIF) and the plasma parameters (such as electron density and gas temperature) by means of OES.[19,22]In these studies, the optical emission is mostly captured from the center of discharge but there is no description of the spatial distribution of the aforementioned plasma parameters and excited species. In this work, the temporal evolution of discharge properties along the inter-electrode axis is investigated in He–0.5%H2O mixture pin-to-pin discharges by applying short overvoltage pulses repetitively. This will provides quantitative and qualitative insight into the plasma parameters and discharge kinetics for better understanding of process of such nanosecond pulsed micro-discharges.
2. Experimental setup
Figure 1(a) presents a schematic diagram of the experimental setup of the nanosecond pulsed discharge source. The geometry of the electrodes consists of two tungsten pin electrodes separated by a gap distance of 4.2 mm. The discharge was produced between the upper and bottom electrodes with diameters of 1.0 mm and 3.2 mm respectively, which are tapered to sharped tips with a radius of approximately 0.15 mm.A high-voltage (HV) power supply (NPG-18/3500, Megaimpulse: Modern Semi. Technol.) with a fixed pulse amplitude of 16 kV was connected to the upper pin electrode via a matched 75-Ω transmission line and the HV pulses were triggered by a function generator (Tektronix AFG3022B). A resistor of 72.5 Ω was placed between the bottom electrode and ground to avoid a short cut.[23]The voltage applied on the upper pin was measured by a high voltage probe (Tektronix P6015A). A Rogowski coil (Pearson electronics 2878) was employed to record the current through the discharges,which was placed between bottom pin and resistor. The waveforms of the applied voltage and current were recorded by a digital oscilloscope(RIGOL DS 1204B).The time delay between the voltage and current probes was obtained by recording the voltage and current curves of a vacuum capacitor. And the voltage and current probe signals are synchronized by shifting the current curve of−4.4 ns. In this work,the discharges were generated in a chamber to avoid air diffusion and the chamber was pumped down and filled three times with He–0.5%H2O gas. The gas flow rate was controlled by a mass flow controller (MFC) with a constant value of 1.0 L·min−1. The gas outlet was opened to the ambient air through an overpressure valve in order to maintain the pressure of the chamber to be 1 atm(1 atm=1.01325×10⁵Pa).

Fig. 1. Schematics of (a) experimental setup of pin-to-pin nanosecond pulsed discharge and (b) the optical emission spectroscopic measurement scheme.
The axial plane of the pin-to-pin discharge was imaged by an achromatic lens(UV-NIR Triple Lens,f=90 mm)on the entrance slit of monochromator(Andor Shamrock 303i)with a magnification of 1:1. The entrance slit width was set to be 20µm. The plasma emission is transmitted to the monochromator equipped with three gratings of 150, 1800, and 2400 grooves/mm, respectively. Then, the time-resolved emission spectra were recorded by an intensified charged coupled device(ICCD, Andor iStar DH340T-25U-3). The external triggering signal of the ICCD was synchronized to that of the power supply by a series of TTL signals from the same function generator. The instrumental broadening profile was determined by using a low-pressure mercury–argon lamp(Newport Model 6035). The wavelength calibration of the spectrometer was also performed by the lamp with several well-known emission lines given by the NIST database.[24]
3. Results and discussion
3.1. Electric properties and time-resolved imaging
Figure 2 displays the applied voltage and total current waveforms of the discharge. Note that the total current is almost entirely conduction current, as the current monitor was located at the ground electrode shown in Fig. 1. Besides,the displacement current was measured to be negligible by applying low voltage pulses without discharge. The voltage across pin electrodes driven by the high power supply starts to increase att=−5 ns with a rise rate of 2.6 kV/ns and reaches the peak of 16 kV.Within a few nanoseconds,the discharge is ignited by the overvoltage pulse as the breakdownfield in helium requires just 4.0 kV/cm.[25,26]Then, the discharge current starts to increase and the voltage drops rapidly.We observed that the current reaches its peak up to~100 A during the second half of the voltage, which is characteristic of spark discharges.[9]From Fig. 2, a weaker secondary discharge pulse is generated att=35 ns after the primary pulse.This is attributed to the fact that the primary pulse reflects from discharge to the generator and then towards back to the electrodes.[26]Since the length of the coaxial cable is about 3 m,the propagation time through the cable filled with teflon as insulator is estimated to be~32 ns,which is consistent with the time interval between two pulses. The energy coupled to the discharge by the primary and secondary pulses is estimated to be approximately 1.30 mJ and 0.18 mJ respectively,which is typical for NRP discharges in spark regime.
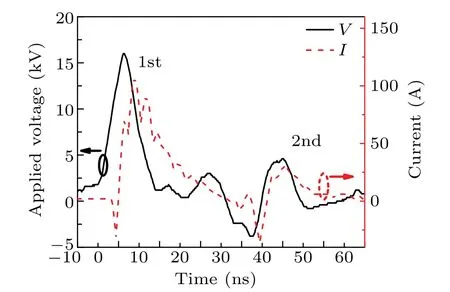
Fig. 2. Applied voltage and current waveforms for the nanosecond pulsed discharge.
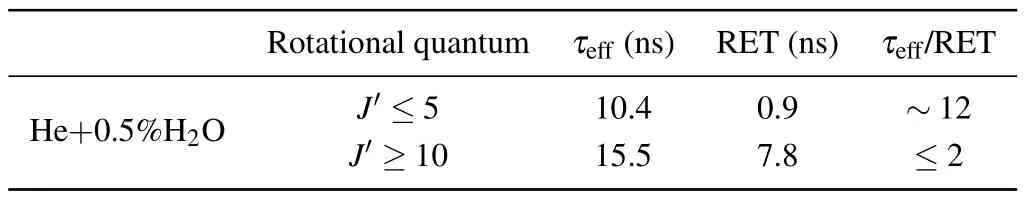
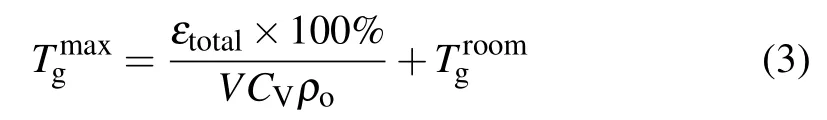
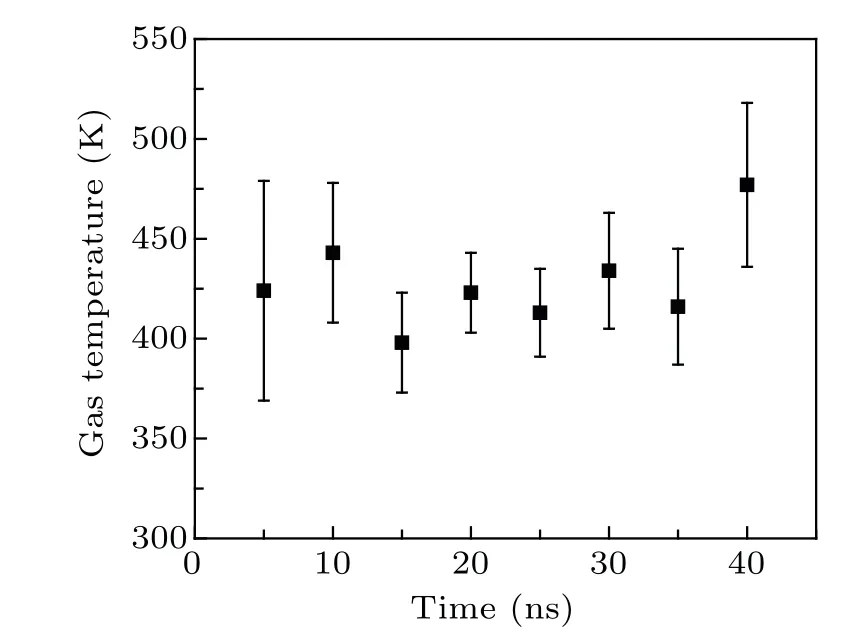
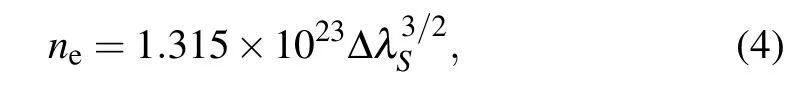
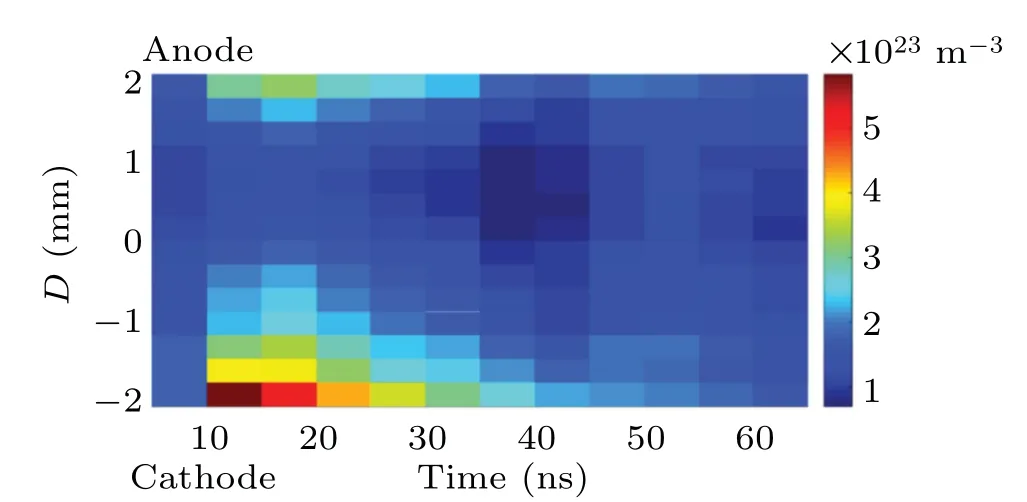
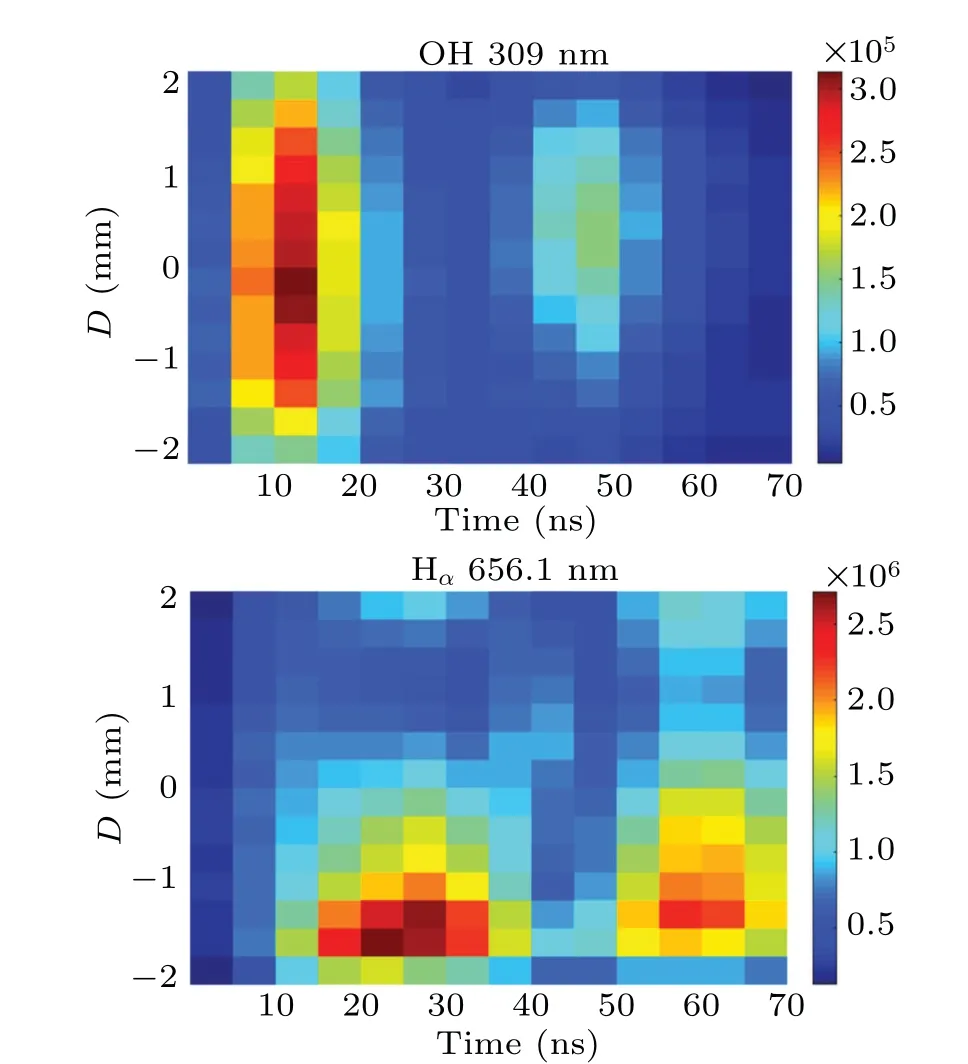
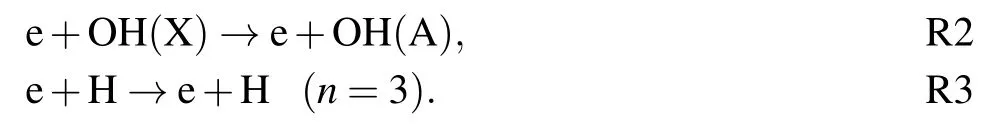
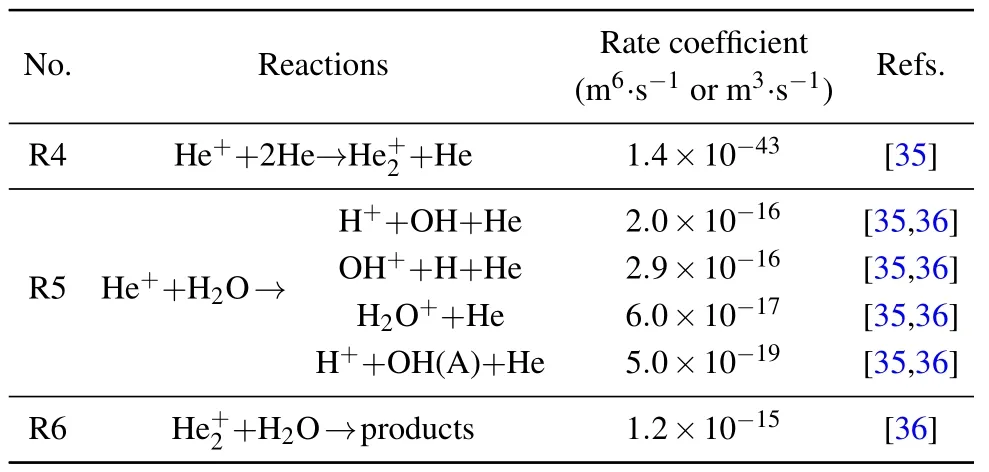
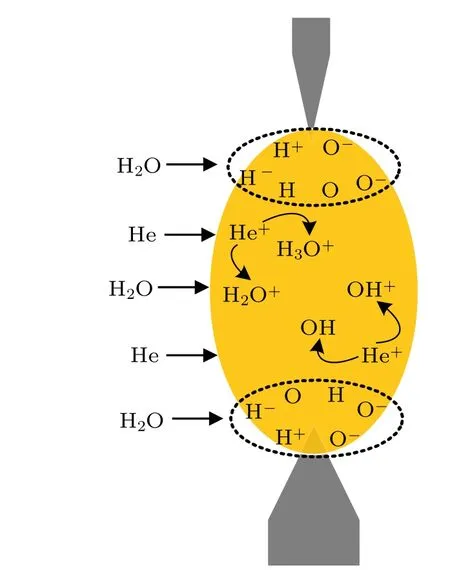
The time-resolved images of the pin-to-pin discharges in He–0.5%H2O gases are captured by the ICCD camera with an exposure time of 5 ns as presented in Fig.3. The first observable light at the initial breakdown (t ≤5 ns) shows that the spark discharge fills the gap with a strong emission intensity.The dynamics evolution of the streamer propagation followed by spark discharge across the gap is almost indistinguishable with a gate time of 5 ns,since the propagation velocity of ionization front is higher up to 105m/s.[27]The optical emission of discharge is only detected during the period of current pulse(t ≤15 ns), presenting a homogeneous filament. And due to the high electric field near the tips,ions and electrons could be accelerated toward the cathode and anode respectively,which produces a large amount of secondary electrons accompanying with a high current of 100 A.Afterward(t ≤15 ns),the emission intensity of discharge shrinks into two small bright balls.And a secondary discharge is observed at 35 ns Fig. 3. (a) Time-resolved images of nanosecond pulsed discharge in He–0.5%H2O gas. The optical emission pattern is accumulated over 200 discharges,the gate width is 5 ns and the gain is kept constant. The time indicated in each picture corresponds to the delay time of ICCD.The emission intensities in all images are normalized for the same intensity scale. (b)Emission intensity along the inter-electrode axis for different delay time. Fig. 4. Calibrated overview spectra of the He+0.5% H2O nanosecond pulsed discharges in the range of 250 nm to 750 nm recorded with a gate of 5 ns at 10 ns and 55 ns,respectively. In Fig.4,overview emission spectra between 250 nm and 750 nm are recorded with a grating of 150 g/mm from the bulk of discharge at 10 ns and 55 ns, and the spectral-sensitivity calibration is performed using a standard light source (Energetiq EQ-99). During the discharge phase (t= 10 ns), the spectrum is covered by the neutral atomic helium and hydrogen lines, and OH(A–X) band. Besides, strong continuum emission from the bremsstrahlung of electron is detected dueto the high electron density.[23]In the recombination phase(t=55 ns),emission from helium atomic and molecular bands become weak, but the intensity of OH(A–X) and hydrogen lines(Hαand Hβ)are still strong. The gas temperatureTg,which represents the kinetic energy of heavy particles(e.g.,helium atoms and ions),is one of the most fundamental parameters. The measurements of gas temperature are usually performed by fitting the ro-vibrational emission spectra of diatomic species to obtain the rotational temperatureTr.[28]In water containing helium discharges,the emission of OH(A2Σ+–X2Π, 0–0) band with its bandhead at 309 nm is the most often used candidate for estimatingTr.[19]However, in many cases, the excited state OH(A) is not directly excited by the electron impact excitation with the ground state OH(X), so the nascent rotational distribution of OH(A) is not a mapping of its ground state.[28]As for high pressure, the rotational levels of the excited state could be thermalized by collisions with the neutral gas, provided the rotational–translational energy transfer time is shorter than the effective lifetime of the excited state. In this section,the rotational population of OH(A)state is represented by a superposition of two Boltzmann distributions as whereJ′is the rotation quantum number of the upper state,Ris the fraction of the population of the OH(A) with high rotational temperature,FJ′is the rotational energy of levelJ′,, andare the rotational temperatures of the high and low temperature components of OH(A) which represent the high and low rotational excited OH(A)characterized by twotemperature Boltzmann distribution. This behavior is related to the formation and relaxation processes of OH(A).Then,the emission intensity of OH(A–X,0–0)can be given by[28] hereAJ′J′′is the Einstein emission coefficient,his the Planck constant,λis the wavelength of the rotational transition, andΦinsis the line profile function. As shown in Fig. 5, a fit of the observed OH(A2Σ+–X2Π, 0–0) spectra with a synthetic spectra is performed, assuming a two-temperature rotational population distribution. The fitting is carried out using the nonlinear curve-fitting function FIT in the CURVE FITTING TOOLBOX of MATLAB. The values of,, andRare obtained simultaneously by using the method of least squares. In Fig.5,it is clear that the rotational distribution deviates significantly from equilibrium as the population of high temperature component of OH(A) accounts for 77% of the total population,which can be attributed to two aspects. On the one hand, the quenching rate constant for OH(A) by H2O is four orders of magnitude larger than that by helium atoms.[28]In spite of very low concentration of water added, the effective lifetime of OH(A)reduces significantly from several hundred ns to ten nanoseconds. On the other, the rate coefficient of the rotational energy transfer(RET)of OH(A)decreases dramatically with the increase of the rotational quantum numberJ′,which means that the high rotational levels cannot achieve the state of translation-rotational equilibrium.[29]With the increasing ofJ′from 0 to 10, the ratio of the effective lifetime and the RET time constant (τeff/RET) decreases from 12 to 2, as listed in Table 1. It is verified in the literature that the low part of rotational temperatureis a good estimate of gas temperature due to the faster RET rate of low rotational levels,i.e.,Tg=.[28] Fig. 5. Best fit of the experimental measured and synthetic spectra of the OH(A–X)transition with minimum residual of the fit. Table 1. The time constants of effective lifetime and RET of OH(A)molecule in helium+0.5% water discharge for different rotational quantum numbers. The effective lifetime and the RET are calculated by τeff =1/(++τRad)and RET=1/(+).[28] Table 1. The time constants of effective lifetime and RET of OH(A)molecule in helium+0.5% water discharge for different rotational quantum numbers. The effective lifetime and the RET are calculated by τeff =1/(++τRad)and RET=1/(+).[28] Rotational quantum τeff (ns) RET(ns) τeff/RET He+0.5%H2O J′≤5 10.4 0.9 ~12 J′≥10 15.5 7.8 ≤2 The time-resolved gas temperature of discharge at midgap determined fromof OH(A)is illustrated in Fig.6. The gas temperature during the discharge pulse remains 425 K with a maximum error of 50 K.A simplified model for the gas heating in nanosecond pulsed discharges proposed by Paiet al.is employed to estimate the upper limit of gas temperature.[9]Assuming that the energy of discharge is converted totally into gas heating and this process is infinitely fast and adiabatic,the temperature of neutral gas can be given as[26] with the discharge energyεtotal=1.48 mJ(in Subsection 3.1),the density of heliumρo=0.1249 kg·m−3, the specific heatcapacity of helium gasCV= 5193.2 J·kg−1·K−1, the room temperature≈300 K.The volume of dischargeVis calculated by assuming a cylindrical volumeV=πR2D,whereRis obtained from the HWHM of the plasma emission in Fig.3.Taking these parameters into Eq. (3), the maximum gas temperature cannot exceed~720 K.From Fig.6,there is no significant gas heating during the discharge pulse which is in contrast to the spark discharge in air. Similar results have also been reported by Verreyckenet al.[19]and Chenet al.[26]in nanosecond pulsed helium discharges driven by a low voltage. Fig.6.Time evolution of the gas temperature in the center of the nanosecond pulsed discharges. The Stark broadening of atomic lines is the most often used technique for determining the electron number density in atmospheric pressure discharges.[30]As shown in Fig. 4,the intensity of Hβline is too weak to be detected during the discharge pulse, thus another Balmer line Hαatλ=656.3 nm and helium line atλ=667.8 nm are employed to extract the Stark broadening width. The Voigt shape of atomic line is a convolution of the Gaussian and Lorentzian components, where the Gaussian part originates from the instrumental and Doppler broadenings,[29]being given by ΔλG=,and the Lorentzian part is mainly ascribed to the van der Waals broadening,resonance broadening and Stark broadening,ΔλL=Δλvan+ΔλR+ΔλS. The full width at half maximum (FWHM) of Doppler broadening is a temperature dependent parameter withand. The resonance FWHM of He I line is calculated by ΔλR(He)=26.26/Tg,while that of Hαis negligible, ΔλR(Hα)≈0.[31]For the van der Waals broadening, one obtains the FWHM relation aswhereCtakes the values of 2.42 and 1.79 for Hαand He lines, respectively.[31]Substituting the gas temperature into the above expressions,one obtains the calculated FWHMs of these broadening mechanisms,as listed in Table 2. It is noted that even in the case of discharges driven by a high voltage pulse,the broadening of Hαdue to the Stark effect of external electric field(<80 kV·cm−1)is negligible.[16] Then, the Stark FWHMs of Hαand He I lines are obtained by deconvolving the experimental line profiles using a Voigt function. Two examples of the fitting of Hαand He I lines are illustrated in Fig. 7. The Stark broadening formula of Hαline is derived from the tabulated values of FWHMs in Ref.[32]for the electron temperature of 1 eV and reduced massµ∗=10,given by where ΔλSandneare in units of nm and m−3,respectively.[16]From Fig.7(a)the electron density is determined to be 4.96×10²²m−3by substituting the Stark FWHM of HαΔλS=0.522 nm into Eq.(4).In Fig.7(b),the Stark broadening of He I at 667.8 nm is also applied to checkneobtained by Hα. For an electron density of 1022m−3–1023m−3,the Stark broadening formula for He I is given by Ref.[30]andneis estimated to be 4.66×10²²m−3. The results indicate that the electron density obtained from these two lines correspond well with each other. Table 2.Calculated full widths at half maximum(FWHMs)of different broadenings for Hα and He lines with Tg=425 K and p=1 atm. Fig.7. Line profile of the Voigt fit of(a)Hα and(b)He I lines at 667.8 nm measured at t=5 ns. The temporal evolution of electron density along the inter-electrode axis by means of the HαStark broadeningtechnique is depicted in Fig. 8. During the initial discharge phase (t ≤10 ns), the axial profiles ofneare uniform (~1×10²³m−3) across the gap. Then, theneprofile becomes non-uniform characterized by two maxima located in the region near the electrodes. Furthermore,we can observe that the electron density near the cathode is higher than that near the anode,which could be attributed to the secondary electrons by ion bombardment. This is in agreement with the results for air spark discharges measured by the Mach–Zehnder laser interferometer when the discharge is fully formed.[33] Fig. 8. Temporal and spatial evolutions of the electron density during the discharge pulses in He–0.5%H2O nanosecond pulsed discharges. The anode is at the top of the image. Figure 9 shows the time and space resolved emission intensity of the excited levels of helium. During the discharge onset, the emission of helium is found to be strong and uniform along the inter-electrode axis which is similar to the profile of electron density(see Fig.8),but a peak in He emission intensity is clearly observed att=5 ns despite the fact that the electron density do not reach its maximum value. This suggests that the excited helium atoms He∗are predominantly populated by the direct electron impact excitation(e+He→e + He∗) when the electron temperature is high due to the high electric field. Meanwhile,the conductive channel across the gap has built up accompanying with the current peak as shown in Fig.2. Afterward, the emission intensity of helium decreases rapidly and shrinks to the tips of electrodes especially the cathode where the electron density is locally higher.Another possible reason is that a strong light scattering reflected from the surface of the thicker cathode electrode. In addition, the optical emission of He in this case is only observed during the discharge pulse and early afterglow,which is quite different from that observed in helium or in helium with 0.05% H2O mixture.[34]In these case, we saw an increase in He emission again when the discharge is switched off with a fluorescence decay time of several hundred nanoseconds. It is obvious that these different behaviors is related to the addition of water molecules as will be discussed later. The spatio-temporal evolution of the emission intensities of OH(A–X) bandhead at 309 nm and Hαline at 656 nm is plotted in Fig.10. Both the OH(A–X)and Hαemission show peaks during the recombination phase,which is in contrast to the emission of He shown in Fig. 9. As the applied voltage declines, the electrons cool down resulting in an increase in OH(A–X)and Hαemission by electron-ion recombination. Fig.9. Temporal and spatial evolutions of the emission intensities of neutral helium lines from different transitions at 706.5 nm and 728.1 nm along the inter-electrode axis during the discharge pulse. The anode is at the top in both images. Fig.10. Time resolved axial profiles of the emission intensity of OH(A–X)at 309 nm and Hα at 656.1 nm along the inter-electrode axis for the He–0.5%H2O nanosecond pulsed discharges. However,there are some differences between them as follows: (i) the OH emission could be observed during the discharge (t <10 ns), while the Hαemission is almost unde-tectable;(ii)the maximum in OH emission is produced in the early afterglow,which precedes the maximum in Hαemission;(iii)the OH emission originates mainly from the center of discharge channel both during and after the discharge,but the Hαemission is from the region near the electrodes in the recombination phase,especially the cathode. The spatially homogeneous emission of OH(A–X) and Hαduring the discharge is similar to the profile of electron density, when the electric field is high. This indicates that OH(A) and H(n=3) are mainly produced by the direct dissociative electron excitation of H2O:[28] and direct excitation from their ground states: Since the excitation energy of H(n=3)(12 eV)is much larger than that of OH(A)(4 eV),the production of H(n=3)is more difficult than OH(A),and as a result the Hαemission is very weak during the discharge. In helium discharges without water vapor, the He emission could last for several hundred nanoseconds in the afterglow (not shown here). Besides, the helium molecular bandranging from 462 nm to 469 nm is detected in the spectra. These He∗andin the afterglow are mainly produced by the dissociative recombination reactions of helium molecular ions,e.g.,e+→He∗+He and, since He+is readily converted into He+2andvia three body collisions (see R1 in Table 3).[35]However,when 0.5%H2O is added to helium gas,in our case,both the He and He2emission disappeared in the afterglow. It is inferred that even if He+andions produced are comparable to the electron density they will be quenched rapidly by water molecules. Table 3. Main reactions for the loss of helium ions in He–0.5%H2O nanosecond pulsed discharges. In the case of He–0.5%H2O discharge,the dominant ion produced initially is still He+, rather than H2O+, for the ionization rate of He is higher than that of H2O.[34]The loss of He+ions, apart from electron-ion recombination reactions,could be the charge transfer reactions R4 and R5. The rates for these reactions can be estimated by, andrespectively, whereis the total rate coefficient of R5.[36]In our experimental conditions, the value ofν1is approximately equal toν2, which indicates that He+is quenched by H2O as fast as it is converted into. Furthermore, theions will also be quenched rapidly by the charge transfer reaction R6, which is an order of magnitude faster than R5,to produce H+,OH+,and H2O+ions.Consequently,the addition of H2O provides an important loss channel of He+ions that should be responsible for the disappearance of He∗andemissions during the afterglow. As a result of the fast charge transfer reactions, a large amount of ionized water fragments(OH+,H+)and water ions(H2O+) will be produced during the discharge. The rates for R5 suggest that the production of water fragments is more likely than water ions. However, it is verified in the work of Verreyckenet al.that the charge transfer processes of H+and OH+ions with water molecules followed by dissociative recombination seems to be important in the production of OH in the afterglow.[34]When the applied voltage collapses, the electron temperature decreases drastically to the temperature of neutral gas with a decay time within~10 ns as the frequency of electron energy transfer in atmospheric helium is about 108s−1.[28]Hence,in the early afterglow,both the(dissociative) electron excitation (R1) and electron–ion recombination reactions (R7, R8) contribute to the production of OH(A),resulting in the maximum of OH(A–X)emission during the second half of the voltage pulse. There are several processes that can produce hydrogen atoms in the recombination phase, as list in Table 4. The reactions R7 and R8 cana prioribe excluded as the available energy are 7.5 eV at most, which is not enough to excite the upper level of H(n=3). The significant Hαemission can thus only be created by the three-body electron–atomic ion recombination R9. Since the rate coefficient of R9 is proportional to,the H(n=3)production depends strongly on the electron temperature and so the Hαemission peak lags behind the OH(A–X)emission peak. Table 4. Main reactions for the electron–ion recombination in the afterglow. The spatial profiles of OH(A–X) and Hαemission infer that the plasma kinetics are strongly dependent on the axial position,as shown in Fig.11. Similar mechanism is responsible for the dip in the radial profile of OH density in the midgap as discussed in the work of Verreyckenet al.[34,37]In the vicinity of electrodes where the electric field and electron temperature are higher, the water molecules could be dissociated more highly than in the mid-gap. Correspondingly, the discharge products in the region near the electrodes are dominantby water fragments (H and O atoms) and their ions, while in the mid-gap the water ions and its clusters(H2O+,H3O+)are more abundant. Consequently, the production of OH(A) in the mid-gap is more likely than the production of H(n=3).As reaction R9 shows a quadratic dependence on the electron density, significant Hαemission is detected near the cathode where the electron density is much higher as shown in Fig.8. Fig. 11. Schematic drawing of the plasma kinetics of H2O that are proposed to explain the observed spatial profile of OH(A–X)and Hα emission in Fig.10. The nanosecond pulsed pin-to-pin micro-discharge is produced in helium gas with water containing of 0.5% at atmospheric pressure. The temporal and spatial evolutions of the discharge characteristics are investigated by means of the optical imaging and optical emission spectroscopy. A uniform emission profile in space is observed at the initial phase of discharge.The population of OH(A2Σ+,υ=0)deviates from the Boltzmann distribution,which is attributed to the fact that the water molecules could reduce the effective lifetime of OH(A)significantly and the RET time constant decreases with the increasing of rotational quantum number. The gas temperature is extracted by a two-temperature fitting of the ro-vibrational OH(A–X)band and remains to be low at 425 K.The electron density measured by the Stark broadening of Hαand He is found to be uniform across the gap at the initial of discharge forne~1×10²³m−3, and afterward shrinks to the tips of cathode and anode due to the secondary electron emission induced by the bombardment of helium ions and electrons. The evolution of He emission is similar to that of electron density,which indicates that the excited helium atoms are produced dominantly by the electron impact excitation. The production of OH(A)is attributed to the charge transfer between H2O and helium ions and subsequent the dissociative electron recombination of water ions,resulting in its maximum intensity in the early afterglow and the disappearance of the emission from helium and its molecules. The maximum in Hαemission during the recombination phase indicates that the exited H atoms are produced by electron–ion recombination of H+. According to the spatial profiles of OH(A–X) and Hαemission, the water molecules near the electrodes are more easily to be dissociated into ionized water fragments (H+and O+) than in the centre of discharge due to the higher electric field, which means that the discharge in the region near the electrodes is atomic. Since the production rate of excited H atoms is proportional to the square of electron density,the intensity of Hαis much stronger near the electrodes,especially the cathode. Acknowledgements Project supported by the National Natural Science Foundation of China (Grant No. 51806186), the Natural Science Foundation of the Jiangsu Higher Education Institutions of China (Grant No. 20KJB140025), the Natural Science Foundation of Jiangsu Province, China (Grant No. BK20181050),and the Scientific Research Project for the Introduction Talent of Yancheng Institute of Technology(Grant No.XJR2020).

3.2. Gas temperature


3.3. Electron density


3.4. Emission spectra of the excited species and discharge kinetics


4. Conclusion and perspectives
猜你喜欢
杂志排行

Chinese Physics B的其它文章
- High sensitivity plasmonic temperature sensor based on a side-polished photonic crystal fiber
- Digital synthesis of programmable photonic integrated circuits
- Non-Rayleigh photon statistics of superbunching pseudothermal light
- Refractive index sensing of double Fano resonance excited by nano-cube array coupled with multilayer all-dielectric film
- A novel polarization converter based on the band-stop frequency selective surface
- Effects of pulse energy ratios on plasma characteristics of dual-pulse fiber-optic laser-induced breakdown spectroscopy