Influence of the X-point location on edge plasma transport in the J-TEXT tokamak with a high-field-side single-null divertor
2022-01-10HaoWANG王灏YunfengLIANG梁云峰ShuaiXU徐帅ZhongheJIANG江中和YuheFENG冯玉和KNIEPSDREWSJieYANG阳杰XinXU徐鑫TingLONG龙婷ShaodongJIAO焦少东XiaolongZHANG张晓龙ZhigangHAO郝志刚QinglongYANG杨庆龙ZhipengCHEN陈志鹏ZhongyongCHEN陈忠勇NengchaoWANG王能超Zhoujun
Hao WANG (王灏), Yunfeng LIANG (梁云峰),,3,∗, Shuai XU (徐帅),Zhonghe JIANG (江中和), Yuhe FENG (冯玉和), A KNIEPS,P DREWS , Jie YANG (阳杰), Xin XU (徐鑫), Ting LONG (龙婷),Shaodong JIAO (焦少东), Xiaolong ZHANG (张晓龙),Zhigang HAO (郝志刚), Qinglong YANG (杨庆龙),Zhipeng CHEN (陈志鹏), Zhongyong CHEN (陈忠勇),Nengchao WANG (王能超), Zhoujun YANG (杨州军),Xiaoqing ZHANG (张晓卿), Yonghua DING (丁永华),Yuan PAN (潘垣) and the J-TEXT Team,7
1International Joint Research Laboratory of Magnetic Confinement Fusion and Plasma Physics,State Key Laboratory of Advanced Electromagnetic Engineering and Technology,School of Electrical and Electronic Engineering, Huazhong University of Science and Technology, Wuhan 430074, People’s Republic of China
2 Forschungszentrum Jülich GmbH,Institut für Energie-und Klimaforschung-Plasmaphysik,Partner of the Trilateral Euregio Cluster (TEC), 52425 Ju¨lich, Germany
3 Institute of Plasma Physics, Chinese Academy of Sciences, Hefei 230031, People’s Republic of China
4 Max-Planck-Institut fur Plasmaphysik, EURATOM Association, 17491 Greifswald, Germany
5 Southwestern Institute of Physics, Chengdu 610041, People’s Republic of China
6 Advanced Energy Research Center,Shenzhen University,Shenzhen 518060,People’s Republic of China
Abstract High-density experiments in the high-field-side mid-plane single-null divertor configuration have been performed for the first time on J-TEXT.The experiments show an increase in the highest central channel line-averaged density from2.73×101 9m−3 to6.49×101 9m−3, while the X-point moves away from the target by increasing the divertor coil current.The corresponding Greenwald fraction rises from 0.50 to 0.79.For the impurity transport, the density normalized radiation intensity (absolute extreme ultraviolet and soft x-ray) of the central channel density decreased significantly(>50%)with an increase in the plasma density.To better understand the underlying physics mechanisms,the 3D edge Monte Carlo code coupled with EIRENE(EMC3-EIRENE)has been implemented for the first time on J-TEXT.The simulation results show good agreement with the experimental findings.As the X-point moves away from the target, the divertor power decay length drops and the scrape-off layer impurity screening effect is enhanced.
Keywords: edge plasma transport, divertor configuration, EMC3-EIRENE
1.Introduction
Compared to the limiter configuration, the divertor configuration has advantages in manipulating the power flow,controlling the impurity production and removing reaction waste[1–5].ITER will operate in a divertor configuration[6].The method discussed here to reduce the target heat load is used to optimize the downstream flux [7–10] because the particle temperature and density at the scrape-off layer(SOL)upstream are mainly related to the core plasma,depending on the conditions of the fusion reaction.The SOL transport not only influences the plasma-wall interaction, but also affects the core confinement.The impurity generation and impurity transport,such as impurity screening,are also affected by the edge plasma transport.Therefore,it is essential to understand the SOL plasma transport for optimized divertor operation.J-TEXT is a conventional iron core tokamak with a divertor power system, which supplies 400 V/25 kA bipolar direct current for 500 ms [11].It has reached an advanced level in the study of magnetic perturbation physics and plasma disruption mitigation, but the absence of divertor configuration research hinders further explorations [12].A divertor configuration on J-TEXT may contribute to the improvement of operation parameters and expansion of its physics research scope.Additionally, the application of a divertor configuration on J-TEXT would offset the gap between itself and advanced devices.Therefore these experiments at J-TEXT will have a greater degree of universality.
Recently, a series of high-density experiments in the high-field-side (HFS) mid-plane single-null divertor configuration was carried out for the first time on J-TEXT [13].These experiments show that the divertor configuration improves the density limit, and that the edge plasma transport is affected by the distance between the X-point and the HFS target.The diagnostic results obtained from the experiments are the foundation to understanding the physical mechanism of this divertor configuration.To qualitatively describe the transport processes, especially at the plasma edge, the three-dimensional numerical simulation code EMC3-EIRENE [14–20] was applied for the first time on J-TEXT.The main reason for applying the EMC3-EIRENE code to the current axisymmetric divertor configuration of J-TEXT is to experimentally validate the 3D code before it is used in real 3D divertor configurations caused by resonant magnetic perturbation (RMP) fields planned for the near future.
In this HFS mid-plane single-null divertor configuration on J-TEXT,the X-point is located in the favorable curvature area.This research is dedicated to the understanding of the factors influencing the edge plasma and impurity transport,such as the X-point location and the density ramp-up.Additionally, the possibility of entering the high recycling regime has been studied.
This paper is structured as follows.In section 2, the experimental results are presented,including the experimental setup (section 2.1) and the diagnostic measurement analysis(2.2).In section 3, the comparison between simulations and experiments is presented and discussed in detail.Finally, the conclusions are summarized and discussed in section 4.
2.High-density experiments with different divertor coil currents
2.1.Experiment setup
J-TEXT is a circular medium-sized tokamak with a major radiusR0=1.05 m,which can be operated in the limiter and the HFS divertor configuration.The first physical experiment in HFS divertor configurations is analyzed and discussed in this work.The HFS target located atRtarget=75.4 cm is made of graphite and covered with SiC film.Wall conditioning is realized by the glow discharge.In this work, J-TEXT was operated in the HFS mid-plane single-null divertor configuration with a toroidal magnetic field ofBt=2 T at the magnetic axis.The plasma currentIp=150 kA was fixed through all experiments with only ohmic heating ofPohmic≈270 kW.
The X-point location was controlled by changing the divertor coil current with a ramp-up time of ∼150 ms.The density ramp-up was realized by gas puffing from the lower window of port 8 at=R105 cm,= −Z32.6 cm.The divertor currentIdivwas set as 15 kA,12 kA,10 kA and 8 kA,respectively.The radial distributions of the plasma electron temperatureTeand the densitynewere measured by a reciprocating probe(RP)system installed on the upper window of port 12 atR=105 cm.The probe was stopped atZ=20 cm to measure the time evolution of the ion saturation current, and the measured results were compared with the ion saturation current of the downstream target probe to observe the upstream and downstream changes.The lineintegrated density was derived from the multi-channel polarimeter interferometer system(POLARIS).The soft x-ray diagnostic (SXR), the absolute extreme ultraviolet diagnostic(AXUV), the carbon III (CIII) photodiode array (PDA) and Doppler coherence imaging spectroscopy (CIS) provided the radiation signals to investigate the evolution of the impurity density and the CIII radiation distribution with increasing plasma density [21–24].Figure 1 shows the optical path distributions of the above diagnostic systems.The toroidal angle of the optical diagnostic is limited by an optical channel slit.The toroidal widths of the slit are 5 mm, 4.4 mm and 33 mm, corresponding to AXUV, SXR and CIII PDA,respectively.Because of the small optical channel slit, the optical path distributions are regarded as 2D in the experiment.Besides,the divertor configuration is toroidal symmetry in this paper.
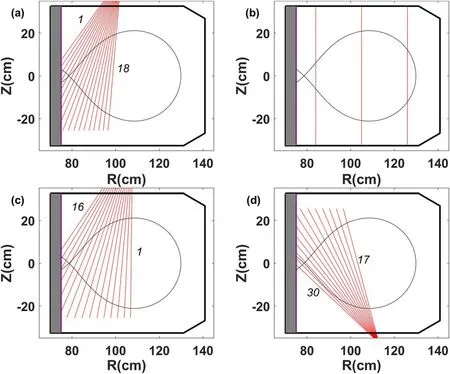
Figure 1.Optical path distributions of(a)CIII,(b)POLARIS,(c)AXUV and(d)SXR.The R,Z locations of the AXUV focus,CIII focus and SXR focus are (107.7 cm, 55.6 cm), (102.6 cm, 46.2 cm) and (112.9 cm, −31.2 cm), respectively.

Figure 2.(a) Plasma current, (b) divertor coil current, (c) central channel integral density, (d) AXUV central channel radiation intensity, (e) SXR central channel radiation intensity, (f) CIII innermost channel radiation intensity.(Divertor coil currents in the shots 1070665, 1070667, 1070668 and 1070669 are 15 kA, 12 kA,10 kA and 8 kA, respectively.)
2.2.The influence of X-point and the density ramp-up on the edge plasma transport
For a better understanding of the influence of the X-point location and the plasma density on the edge plasma transport,a series of experiments has been performed on J-TEXT.An overview of the key discharges is shown in figure 2.The X-point location (distance between the X-point and the HFS target) influences the maximum density reachable before disruption.As seen in figure 2, with continuous gas puffing,the chord integral density of the central channel measured by the POLARIS gradually increases over time.The maximum integrated density before disruption increases with the increasingIdiv.The detailed data are shown in table 1.Figure 3 indicates the separatrix locations reconstructed by the EFIT[25]code.It should be mentioned that the plasma in the case ofIdiv=8 kA operates in a limiter configuration due to the X-point being located behind the target, which is represented by the negative correspondingΔrin table 2.This explains why the maximum chord integral density drops considerably withIdiv=8 kA.Combined with the EFIT results,the line-averaged density and Greenwald fraction[26]are obtained, as shown in table 2.The divertor configuration improves the density limit compared to the limiter configuration, increasing the Greenwald fraction from 0.50 to 0.79.
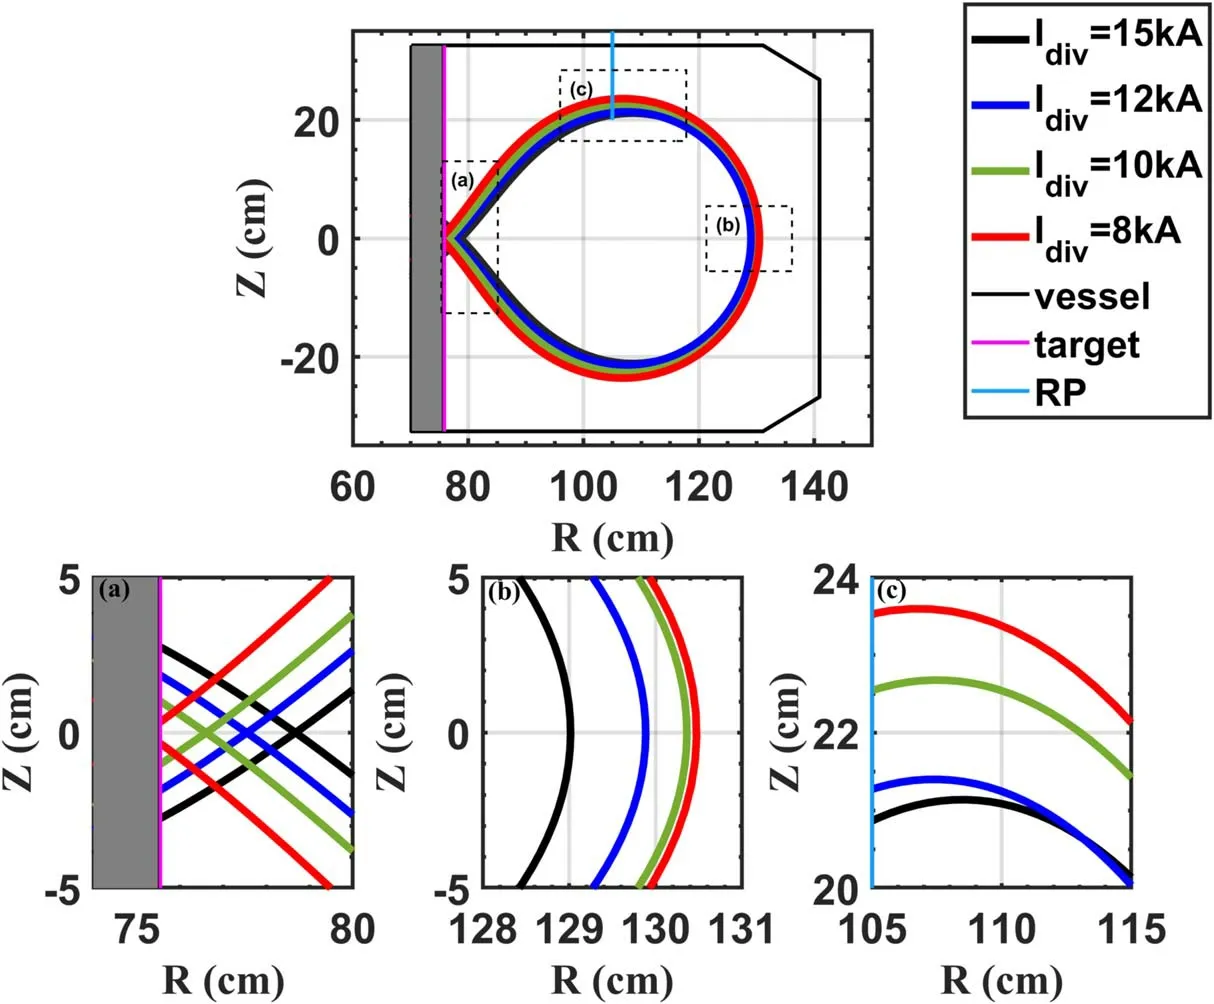
Figure 3.The separatrix generated from the EFIT code.(a)–(c) correspond to the area of the above full picture.

Table 1.Central channel diagnostic results.
The plasma density and the X-point location also influence the edge impurity transport.The radiation intensity measured by AXUV, SXR and CIII rises with increasing plasma density.In table 1, the density normalization ratio ofIAXUVbefore disruption toIAXUVat 200 ms is less than 50%in the cases ofIdiv=15 kA, 12 kA.The density normalization radiation intensity decreases significantly, while the temperature barely changes.This proves that the X-point moving away from the target helps to reduce the core impurity concentration.Figure 4 shows the time evolution of the radiation intensity in the studied experiments.When comparing the radiation intensities measured by AXUV and SXR at differentIdiv,one finds that the impurity radiation in both the core and the SOL is reduced when the X-point moves away from the target.This observation supports the hypothesis that moving the X-point away from the target can improve the SOL impurity screening effect, thus reducing the impurity concentration in the core plasma in J-TEXT.
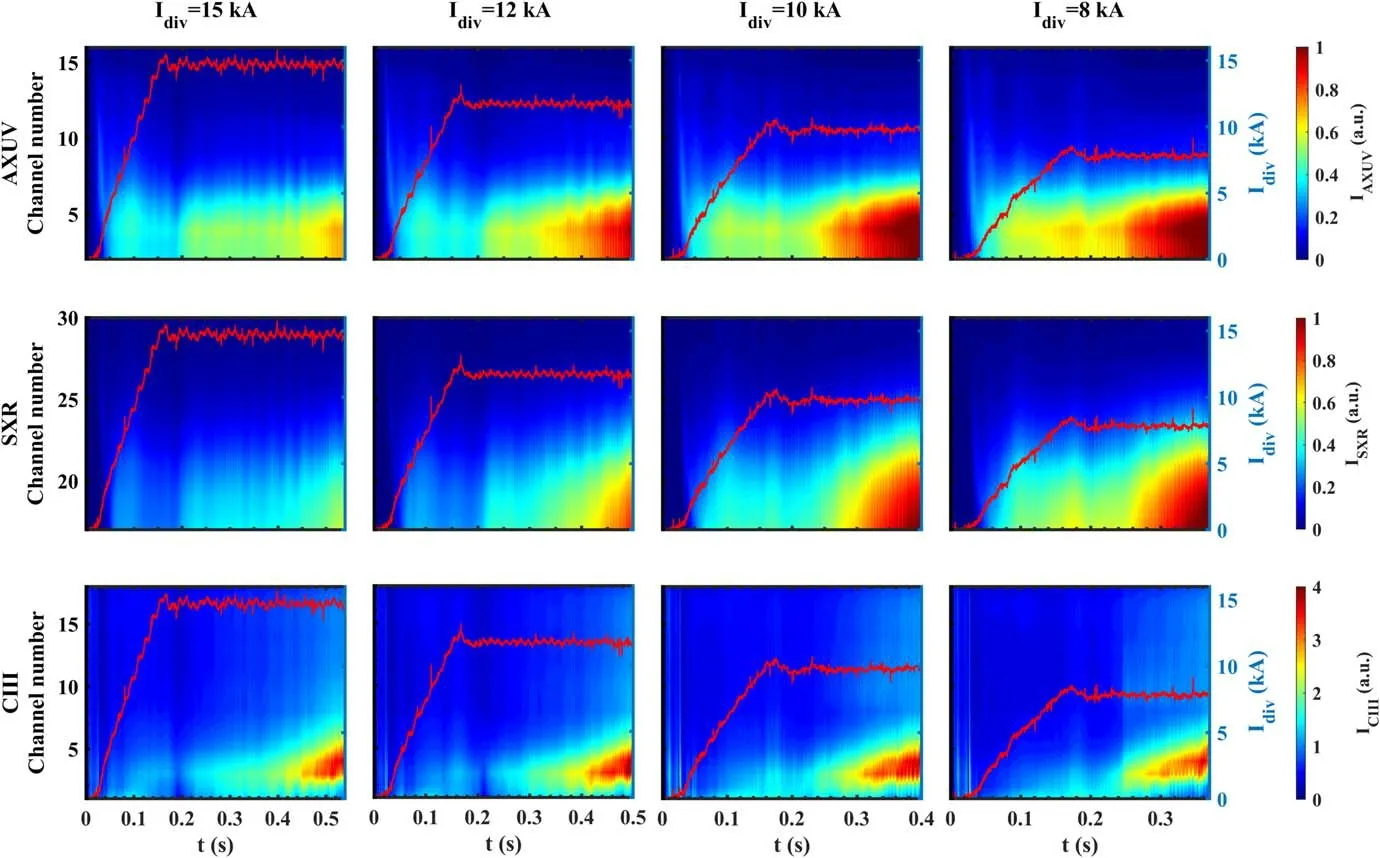
Figure 4.The evolution of the radiation intensity measured by AXUV, SXR and CIII PDA.The line in each contour map represents the divertor coil current.The divertor coil currents corresponding to each column are 15 kA, 12 kA, 10 kA and 8 kA, respectively.
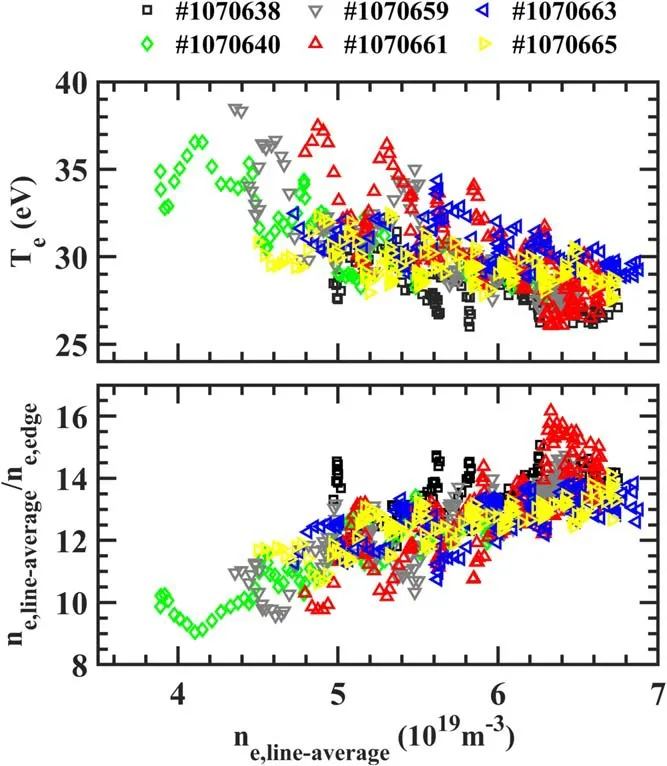
Figure 5.The edge electron temperature Te and the ratio of the central channel line-averaged electron density to the edge electron density ne,line −average/ n e,edge as a function of the central channel lineaveraged electron density n e ,line −average.( I div=15 kA at all the shots.The Z location of the probe is 20 cm, near the separatrix.)

Figure 6.The ratio of target-ion saturation flux to ion saturation flux measured by the RP as a function of central channel line-averaged electron density ne,line −average (Idiv=15 kA).The Z locations of the target probe corresponding to I1, I2, I4 and I5 are 7.6 cm, 3.8 cm,−3.8 cm and −7.6 cm, respectively.

Figure 7.The ratio of downstream electron density to upstream electron density as a function of the central channel line-averaged electron density n e ,line −average ,for Idiv=15 kA,12 kA, 10 kA,8 kA.As shown in figure 1, the line-averaged density is measured by the POLARIS at R=105 cm.The upstream electron density is measured by the POLARIS at R=126 cm, and the downstream electron density is measured by the POLARIS at R=84 cm.

Figure 8.The 2D CIII radiation intensity distribution reconstructed from the Doppler CIS diagnostics.The line in each map represents the position of the separatrix.
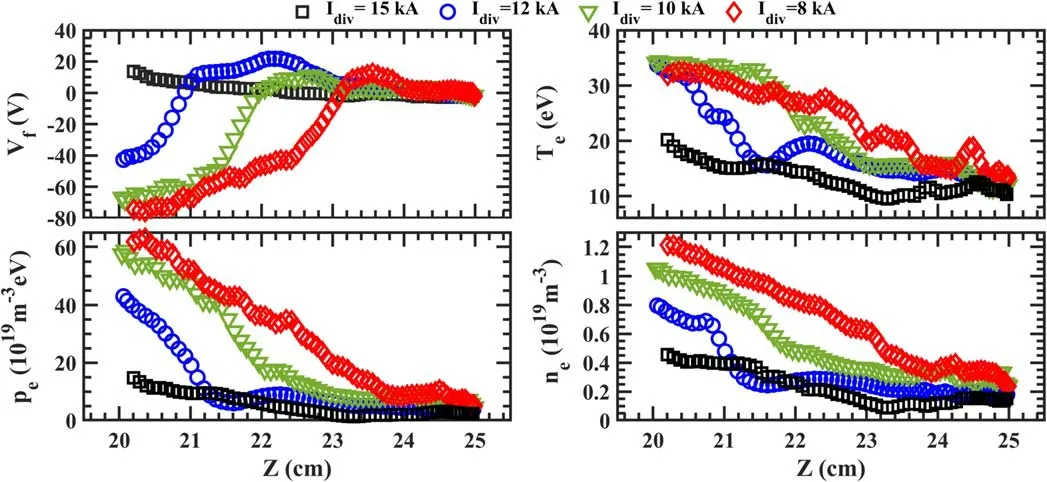
Figure 9.The radial distributions of the floating potentialVf ,the electron temperature Te ,the electron density n e ,and the pressure pe measured by the RP system with different Id iv.
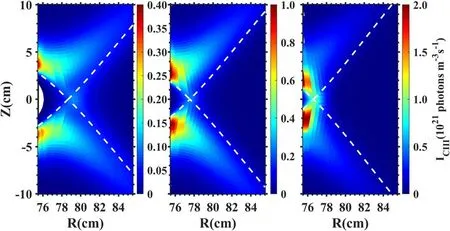
Figure 13.The 2D CIII radiation intensity distributions with Idiv=15 kA, 12 kA, 10 kA,respectively.The dashed lines represent the locations of the separatrix.
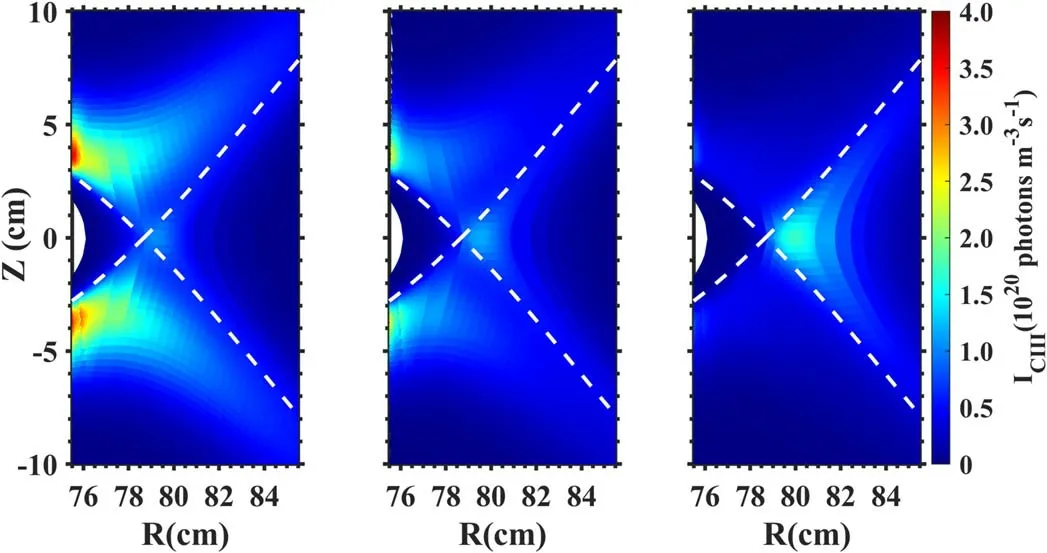
Figure 14.The 2D CIII radiation intensity distributions for PSOL=67.5kW,54 kW,40.5 kW with Idiv=15 kA.The dashed lines represent the locations of the separatrix.
During the density ramp-up, the SOL electron temperature dropped and the core electron density rose faster than the SOL electron density, just as the downstream ion saturation flux increased faster than the ion saturation flux measured by the RP.In the shot withIdiv=15 kA,the RP was fixed atZ=20 cm to measure the time evolution of the SOL upstream electron density and temperature.Diagnosticresults indicate that the probe had not yet reached the separatrix, while the EFIT reconstructions suggest the opposite.The discrepancy between diagnostic results and EFIT reconstructions is caused by a displacement of the central current and the resulting profile deformation.This also explains the presence of large fluctuations in the measurements.Repeated measurements observe a trend in the SOL,with the electron temperature dropping by about 25%and thene,line−average/ne,edgeincreasing by about 40% with increasing line-averaged density (covering a roughly 70% increase).These observations are shown in figure 5.As visible in figure 6,the ratio of the target-ion saturation current to the ion saturation current measured by the RP increases with increasing density, while the ratio of the HFS integration density to the low-field-side integration density shows the same trend in figure 7.For the carbon impurity, figure 8 shows that the CIII radiation is concentrated in the X-point area and,with the X-point moving towards the target,the CIII radiation concentration area moves deeper towards the core during the density ramp-up.

Table 2.The location of the X-point and the corresponding densityrelated parameters (Δ r = RX−point−Rtarget).
The distribution of the edge plasma depends on the distance between the X-point and the target (see also figure 9),implying that it is indeed affected by the different HFS midplane single-null divertor configurations.In the core area, the gradient of the electron density distribution is larger than that in the SOL.Meanwhile,the gradient near the separatrix increases with an increase inIdiv.However, the gradient tends to be the same in the deeper core area.This refelcts the influence of the X-point location on the edge plasma transport.
3.Simulation procedure and results
To better understand the observed effects, edge plasma transport simulations were performed using the EMC3-EIRENE code.EMC3-EIRENE is a powerful code used to simulate the edge plasma transport with low impurity concentrations.EMC3-EIRENE consists of the 3D edge fluid transport code EMC3, which solves the Braginskii’s fluid equations, and the 3D kinetic neutral particle transport code EIRENE,which solves the kinetic Boltzmann equations.The EMC3 code applies an advanced Monte Carlo algorithm to solve the fluid equations.The code has been widely used in multiple devices,including stellarators and tokamaks such as W7-X [27], LHD [28–32], TEXTOR-DED [33], DIII-D[34], ASDEX-U [35], JET [36], TCV [37] and EAST[38–44].In this work, the grid generator of EMC3-EIRENE is adapted to the J-TEXT axisymmetric HFS divertor configurations.The 3D code can reproduce the experimental results and provide more detailed information on SOL plasma, such as the plasma density, the plasma temperature and the impurity density, as well as the divertor particle flux and the divertor heat flux.
3.1.Generation of the simulation grid
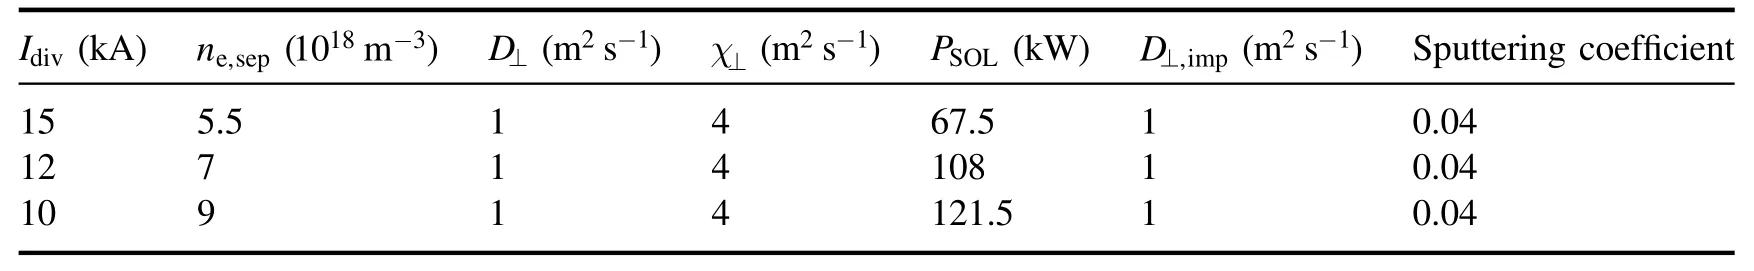
Table 3.Simulation parameters.
The 2D equilibrium is provided by the EFIT code.The 3D grid generation procedure starts with the construction of a 2D grid in an arbitrary toroidal plane due to the axisymmetric divertor configuration.The generation of the 2D grid requires one to first find the X-point and O-point, and then to find the magnetic flux surfaces according to the given poloidal and radial resolution.As shown in figure 10,the 2D grid consists of three distinct regions, namely the core, the SOL and the private flux region (PFR).Adjacent sub-domains have to share common grid points on their interface to ensure that all subdomains can form the whole real space, so the number of poloidal grid points in different regions has to satisfy the constraintnp,SOL=np,core+np,PFR.The 3D mesh is generated by tracing magnetic field lines from the 2D grid points over a finite phi-angle.For the axisymmetric case addressed in this paper,the choice of the toroidal domain length can be arbitrary.In realistic 3D configurations, it usually spans one field period by tracing magnetic field lines.The grids are constructed for ohmic shots 1070665 at 420 ms,1070667 at 400 ms and 1070668 at 350 ms,corresponding toIdiv=15 kA, 12 kA, 10 kA, respectively.
3.2.Reconstruction of J-TEXT divertor plasmas in EMC3-EIRENE
To reconstruct the J-TEXT divertor plasmas withIdiv=15 kA, 12 kA, 10 kA, the main input parameters for EMC3-EIRENE need to be determined experimentally first,including the separatrix electron densityne,sep,the particle cross-field transport coefficients of the main plasma and impurityD⊥,D⊥,imp,the energy cross-field transport coefficients of electrons and ionsχ⊥,e,χ⊥,i,the power entering SOLPSOLand the impurity sputtering coeffciient.The separatrix electron density, the cross-feild diffusivity of the background plasma and the anomalous conductivity of electrons are mainly determined by ftiting the electron density and temperature radial distribution measured by the RP,while also considering the measurements from Doppler CIS and radiation diagnostics.
Then, it is presumed thatD⊥=D⊥,imp,χ⊥,e=χ⊥,i.The inner boundary is set to the normalized magnetic flux surface 0.6.ThePSOLis set equally between electrons and ions in EMC3-EIRENE input parameters.The boundary condition applied at the divertor targets is the Bohm condition.The impurity source flux equals the impurity sputtering coefficient times the recycling flux.The simulation is based on the ADAS [45] database.The current diagnostic capability on J-TEXT does not allow for quantification of the existing impurity species and the associated radiation,especially in the core, which makes the estimation ofPSOLdifficult.For this reason, in the simulation,PSOLwas scanned in a step of 13.5 kW, which is 5% of the total ohmic heating power of 270 kW.Given the lowTevalues measured by the RP in the SOL(see figure 9),both the chemical sputtering and physical sputtering processes on the graphite target are covered by assuming an effective sputtering coefficient of 0.04[38,46,47].The actual location of the separatrix is corrected by assuming that the RP measures a change in floating potential from positive to negative at the SOL–core interface.According to this correction, the measured profiles atIdiv=15 kA, 12 kA, 10 kA have been shifted by 0.534 cm,0.358 cm and 0.623 cm in theZcoordinate direction,respectively.EffectiveZeffects are not considered in either the evaluation of the RP results or in the simulations.Under this assumption, together with the separatrix shifts, the main code input parameters are determined, as listed in table 3,which result in best matches with the RP profiles.
The simulated radial distributions are mostly consistent with the RP results,as shown in figure 11.The discrepancies between the simulations and the RP measurements may result from the displacement of the plasma current center, the density increase when the RP processes or other possibilities.Figure 12 shows the resulting 2D distributions of the electron density,the electron temperature,the ion temperature and the Mach number withIdiv=15 kA, 12 kA, 10 kA.The results are upper and lower symmetry.

Figure 15.The 2D CIII radiation intensity distributions with lower PSOL for Idiv=12 kA, 10 kA correspondingly.The dashed lines represent the locations of the separatrix.
Even though the simulation results are consistent with the RP diagnostic results in the upstream region, there is a discrepancy in CIII location between the simulation results and the Doppler CIS diagnostic results.As shown in figure 13,the CIII impurity concentrates near the strike point,while the Doppler CIS diagnostic results show that the CIII impurity concentrates near the X-point.
This indicates that the temperature at the X-point area in the simulation is higher than that in the experiment,implying that the actualPSOLis lower than assumed in the simulation.To confirm this point,PSOLis gradually reduced in the simulation.Using theIdiv=15 kA case as an example,figure 14 shows how the CIII radiation distribution develops asPSOLis decreased from 67.5 kW to 54 kW and further to 40.5 kW.In the lowestPSOLcase, a second peak of CIII radiation occurs near the X-point, just inside the last closed flux surface (LCFS) as also indicated by CIII radiation from the CIS measurements shown in figure 8.Similar simulations with reducedPSOLwere also performed forIdiv=12 kA and 10 kA.The results are displayed in figure 15, which are qualitatively consistent with the experimental findings in figure 8.Therefore, in general, reducingPSOLincreases the CIII radiation around the X-point.However, the simulated electron temperature radial distribution drops at the same time, resulting in a discrepancy between the modelling and the RP data.The simulations cannot get good agreement with the above two diagnostic data at the same time, possibly due to the underestimate of the impurity cross-field coefficient or the underestimate of the impurity sputtering initial energy.Scans of the impurity cross-field coefficient⊥D,impand the impurity sputtering initial energyE0,imphave been carried out.As shown in figures 16 and 17, the increase in the two parameters results in the increase in CIII radiation at the X-point.However, the CIII radiation is still intense near the strike point.Another possibility is the existence of other impurities such as oxygen and nitrogen, detected by the residual gas analysis in the vacuum conditions of J-TEXT[48].Oxygen radiation should also be located in the edge region of the plasma, and its effects cannot be approached well by reducing thePSOL.
In the J-TEXT divertor configuration, the location of the X-point influences the magnetic field structures,the magnetic field line connection length in the SOL.The distribution of the main plasma changes with the magnetic field.The impurity source flux, the sputtering initial energy and the impurity exhaust are modified by the change in the magnetic field and the main plasma:so that the penetration depth of the impurity changes with the X-point location.With the aim to explore the influences of the X-point position on the SOL plasma transport, anIdivscan is performed, otherwise based on the same input parameters as defined for theIdiv=12 kA case in table 3.Figure 18 shows the simulated particle and power fluxes on the HFS target withIdiv=15 kA,12 kA, 10 kA.The divertor target power flux decay length(obtained by e-exponential fitting of the power flux distribution at the target according to the formulais the power flux at the separatrix.Here,R0is the radial location of the separatrix,q‖is the power flux distribution with respect to the radial locationR, andλq(represents the power flux decay length) is 3.3 cm, 3.8 cm and 4.6 cm (forIdiv=15 kA, 12 kA, 10 kA, respectively).The corresponding power through the target(proportion inPSOL)is about 75 kW (69%), 71 kW (66%) and 58 kW (54%).The corresponding energy losses caused by the carbon radiation are 7.89 kW,8.90 kW and 9.35 kW,as shown in figure 19.As the X-point moves towards the target, the heat and particle fluxes on the divertor target become increasingly wider, and their peaks decrease.Coupled linearly with the recycling flux,the resulting total carbon source fluxes are 27.56 A, 25.79 A and 23.80 A, respectively, which means that the number of sputtered carbon particles decreases when the X-point moves towards the target.However, the corresponding average carbon impurities densities at the separatrix are3.94 ×1016m−3,5.56 ×1016m−3,8.09 ×1016m−3, respectively.With the X-point moving away from the target,more carbon impurities are sputtered,but the average carbon impurities density at the separatrix is lowered, indicating an enhanced SOL impurity screening effect.This result is consistent with the experimental findings in figure 8.
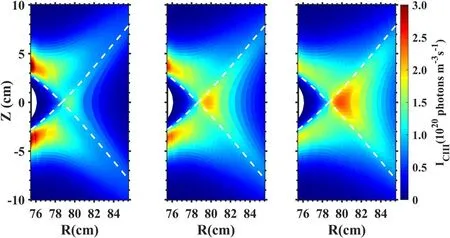
Figure 16.The 2D CIII radiation intensity distributions for D⊥,imp=2 m2s− 1,5 m2s− 1,10 m2s− 1 with Idiv=15 kA.The dashed lines represent the locations of the separatrix.

Figure 17.The 2D CIII radiation intensity distributions for E 0 ,imp=0.5 eV, 1 eV, 1.5 eV with Idiv=15 kA.The dashed lines represent the locations of the separatrix.

Figure 18.Simulated target particle flux and the simulated target heat flux (φ=0) with Idiv=15 kA, 12 kA, 10 kA.

Figure 19.Simulated 2D carbon radiation density with Idiv=15 kA, 12 kA, 10 kA with otherwise identical simulation parameters.
4.Conclusion and discussion
High-density experiments in a HFS single-null mid-plane divertor configuration on J-TEXT have been carried out to explore the influence of the X-point location and the density ramp-up on the SOL plasma transport.The experiment results show that the divertor configuration increases the maximum electron density before disruption and the Greenwald fraction.Moving the X-point away from the target was shown to improve both the plasma and impurity transport.With increasing plasma density,the SOL electron temperature dropped, and the target-ion saturation flux increased faster than the ion saturation flux measured by the RP, which may result from the radial transport changes with the density rampup.Meanwhile,the impurity radiation was enhanced,which is helpful in reducing the target heat load.Under ohmic discharge conditions, the core radiation is dominant, and the ratio of the downstream flux to the upstream flux is still linear as the plasma density rises.Limited by the open divertor without the neutralized gas pumping system and the low heating power,no high recycling regime was observed in this experiment.
EMC3-EIRENE was applied to study the SOL plasma transport in HFS mid-plane single-null configurations on J-TEXT.Good qualitative agreements between simulation results and the RP diagnostic results are obtained.The simulation results provided detailed 2D distributions of the main plasma parameters.When the X-point moves away from the target, simulations show enhanced impurity screening, which is helpful in reducing the carbon impurity concentration in the core region.
Combined with the experiments and simulation results,with the change in the X-point location, the magnetic field structures and the connection lengths of magnetic field lines are modified in the SOL.The distributions of the main plasma and the impurity in the SOL change with the magnetic field.Moreover, with the distance between the X-point and the divertor target increasing, the peak of the divertor heat flux increases and the divertor heat flux decay length decreases.
Even though the simulation results are consistent with the RP diagnostic results, there are still some discrepancies between the simulations and the Doppler CIS diagnostic results.A possible explanation is the underestimate of the impurity cross-field coefficient and the impurity sputtering initial energy.Another explanation might be the presence of other impurities in the plasma, which increase the temperature gradient between the upstream plasma and the downstream plasma in the SOL.The application of EMC3-EIRENE to J-TEXT needs further optimization to introduce more impurity species, which may have a significant influence on the plasma in experiments.Besides, based on the more detailed diagnostics, the optimizations of the parameters, includingE0,impand⊥D,imp, may contribute to offset the discrepancies between the simulations and experiments.The radial distributions of the electron density and temperature were measured by the RP.More stable plasma position and density control would make the measurements more accurate and improve the accuracy of the simulation parameters.Additionally, the application of non-uniform transport coefficients may yield a meaningful approach for further optimization in future studies.Furthermore, in future experiments, the introduction of electron cyclotron resonance heating (ECRH), which has been working well on J-TEXT, could help to further increase the edge plasma density and improve the edge plasma and impurity transport.This might enable the device to explore higher plasma density ranges, which would also be of interest to HFS divertor studies.
Acknowledgments
This work is supported by the National Magnetic Confinement Fusion Energy R&D Program of China (Nos.2018YFE0301104 and 2018YFE0309100), and National Natural Science Foundation of China (No.51821005).
ORCID iDs
猜你喜欢
杂志排行

Plasma Science and Technology的其它文章
- Numerical simulation of nanosecond laser ablation and plasma characteristics considering a real gas equation of state
- The propagation dynamics and stability of an intense laser beam in a radial power-law plasma channel
- Effect of edge magnetic island on carbon screening in the J-TEXT tokamak
- Relativistic effect on synergy of electron cyclotron and lower hybrid waves on EAST
- A simulation study of protons heated by left/right-handed Alfvén waves generated by electromagnetic proton–proton instability
- Investigation of optimum discharge characteristics and chemical activity of AC driven air plasma jet and its anticancer effect