Investigating the factors affecting traffic violations based on electronic enforcement data: A case study in Shangyu, China
2021-07-13FanHaoxuanRenGangLiHaojieMaJingfeng
Fan Haoxuan Ren Gang Li Haojie Ma Jingfeng
(School of Transportation, Southeast University, Nanjing 211189, China)
Abstract:To study the influencing factors of traffic violations, this study investigated the effects of vehicle attribution, day of week, time of day, location of traffic violations, and weather on traffic violations based on the electronic enforcement data and historical weather data obtained in Shangyu, China. Ten categories of traffic violations were determined from the raw data. Then, chi-square tests were used to analyze the relationship between traffic violations and the potential risk factors. Multinomial logistic regression analyses were conducted to further estimate the effects of different risk factors on the likelihood of the occurrence of traffic violations. By analyzing the results of chi-square tests via SPSS, the five factors above were all determined as significant factors associated with traffic violations. The results of the multinomial logistic regression revealed the significant effects of the five factors on the likelihood of the occurrence of corresponding traffic violations. The conclusions are of great significance for the development of effective traffic intervention measures to reduce traffic violations and the improvement of road traffic safety.
Key words:traffic violations; road traffic safety; electronic enforcement data; multinomial logistic regression; influencing factors
The number of annual road traffic deaths has reached 1.35 million worldwide. In fact, road traffic-related injuries are now the leading killer of people aged 5-29 years and are the 8th leading cause of death for people of all ages[1]. In China, a total of 244 937 traffic accidents occurred in 2018, resulting in 63 194 deaths and a direct property loss of 1 384.559 million yuan[2]. The traffic violation of motor vehicle drivers is one of the main causes of traffic accidents, accounting for 83.2%, 83.6%, and 85.2% of all accidents in 1996, 1997, and 1999 in China, respectively. By 2010, the traffic violation of motor vehicle drivers has accounted for 91.08% of all accidents[3]. For this reason, traffic violation, as one of the major risks influencing traffic accidents[4], is worthy of further study. Zhang et al.[5]conducted research using the data of traffic accidents and traffic violations. They found that traffic violation was one of the major risks threatening road safety and that obeying traffic rules can effectively reduce the frequency of traffic accidents, consistent with the results of a Canadian study[6]. Therefore, studying the characteristics and influencing factors of traffic violations is of great necessity, as it can help establish a theoretical foundation for the promotion of effective traffic intervention measures and improvement of road traffic safety.
Many studies have analyzed the factors affecting traffic violations over the years. For example, younger drivers were found to be more likely to be involved in traffic violations[7]. Oppenheim et al.[8]revealed the effect of gender on drivers’ violation tendencies. One study identified male drivers, private vehicles, the lack of street lighting at night, and poor visibility as significant risk factors associated with speeding and drunk driving[9]. Akaateba et al.[10]investigated the relationship between drivers’ educational attainment and driving experience and traffic violations. License plate, season, speeding area, position, and rainfall were also identified as factors affecting speeding violation[11]. Martínez-Ruíz et al.[12]evaluated the impact of camera enforcement for traffic violations, while Zhang et al.[13]considered the factors of weather conditions in their research. Wang et al.[14]concluded that the common traffic violations of bus drivers could be attributed to the date, weather, and presence of traffic cameras at bus stations. Precht et al.[15]found that drivers are more likely to commit traffic violations on rainy days. Fu et al.[16]selected vehicle factors, temporal factors, weather, and road and traffic management conditions as potential risk factors of wrong-way driving, red-light-running, violating traffic markings, and driving in the inaccurate oriented lane at signalized intersections.
Earlier studies on traffic violations mainly relied on data collected from questionnaires[8,10,17-19]. Then, subsequent studies used structural equation modeling[19-20], chi-square tests[18], and regression techniques[17]to analyze the self-reported traffic violations based on the data collected from the questionnaires. However, this method of data collection has a limitation, and the inaccuracy of respondents’ self-reported behaviors may affect the analysis results to some extent[19,21].
There are also some other data sources of traffic violations and methods of data analysis in existing studies. For example, logistic regression was utilized to analyze the significant factors influencing speeding and drunk driving based on data extracted from the traffic management sector-specific incident case data report[9]. Some traffic violations cause incidents, whereas some do not. Therefore, it is not accurate to study the influencing factors of traffic violations based on incident case data alone. Andreuccetti et al.[22]conducted a cross-sectional observational study by collecting data on drunk driving and speeding. Cheng et al.[11]adopted the violations data collected by the electronic enforcement equipment and analyzed them using binary logistic regression. Tavakoli Kashani et al.[23]analyzed crash data in Iran from 2012—2016. They used the classification regression tree and the quasi-induced exposure method to identify the important driver and vehicle features associated with the red-light running frequencies.
Based on the above literature review, the main research contents of this article are as follows:
1) Ten categories of traffic violations are extracted from the raw data instead of analyzing only one or two kinds of typical traffic violations.
2) The risk factors of traffic violations are determined based on the information included in the data and existing studies, including vehicle attribution, day of the week, time of day, location of violations, and weather.
3) Then, the chi-square tests and multinomial logistic regression method were used to analyze the relationships between traffic violations and the identified risk factors as well as the effects of different factors on the likelihood of the occurrence of traffic violations.
4) Finally, corresponding traffic intervention measures are proposed according to the analysis results.
1 Materials and Methods
1.1 Data sources
Studies on the influencing factors of traffic violations suffer from the limitation of inaccurate self-reported violations and incident case data. Furthermore, the observational study of traffic violations is time-consuming and laborious. However, due to restrictions on the acquisition of relevant data, there are still infrequent empirical studies on the factors affecting traffic violations. The current research is conducted from the perspective of traffic violations in practical driving situations rather than self-reported violations and uses electronic enforcement data of traffic violations collected in Shangyu, Zhejiang Province, China. Furthermore, historical weather data of Shangyu were extracted from the website http://lishi.tianqi.com/shangyu.html.
The electronic enforcement data of traffic violations used in this paper were obtained from Shangyu, a city in China with a population of approximately 780 000 and an area of 1 401.68 km2. The data were extracted from the electronic police system for the period of January 1—31, 2019. The data consisted of 57 441 records of traffic violations. After eliminating 1 444 invalid records without traffic violation codes, we obtained 55 997 valid records, including vehicle license plate numbers, times and locations of traffic violations, and traffic violation codes. The specific descriptions of traffic violations can be obtained according to the traffic violation codes.
There were 23 kinds of violations recorded in the data, of which 14 were classified as low-frequency violations whose frequencies were lower than 2 000 times a month. From these, ten types of violations were determined (see Tab.1).
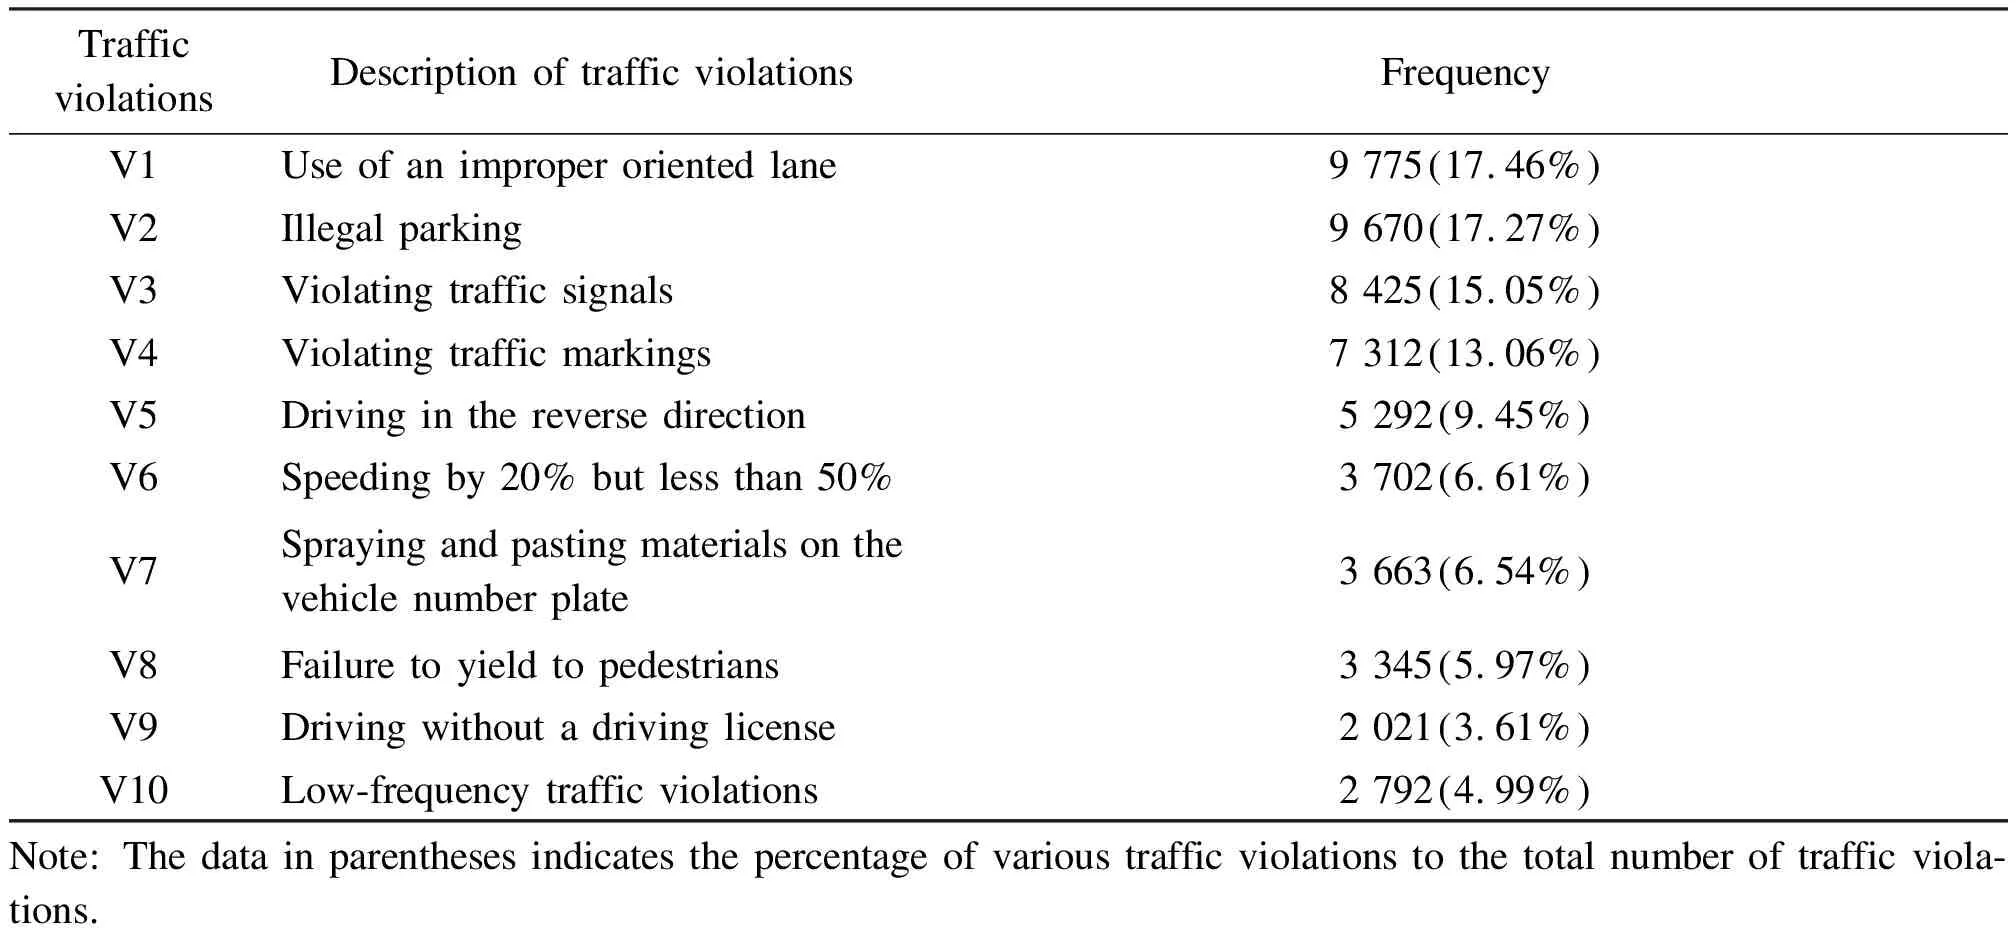
Tab.1 Traffic violation statistics
1.2 Risk factors
Risk factors were determined based on the information included in the electronic enforcement data of traffic violations and the weather data. Vehicle attribution, day of week, time of day, location of violations, and weather were selected as potential influencing factors based on the information included in the data and existing studies[9,13-16,24-25]. Although the driver’s personal characteristics may be closely related to traffic violations, and many researchers have made useful explorations into them, they are not considered as the influencing factors, because they are not recorded in the data source. Many studies have been carried out on the effect of vehicle characteristics on traffic violations. However, they ignored the information included in vehicle license plate numbers. We can actually obtain vehicle attribution from vehicle license plate numbers to identify whether a vehicle is local or non-local. Meanwhile, existing studies on weather-related factors mainly studied their impacts on traffic accidents or focused only on one or two kinds of typical traffic violations. In comparison, the current work studied their impacts on ten categories of traffic violations and conducted a more comprehensive analysis.
As shown in Tab.1, traffic violations were classified into ten categories. Vehicle attribution can be obtained from vehicle license plate numbers. Specifically, vehicles were divided into local and non-local vehicles according to vehicle attribution. The variable of day of week contained two categories: weekday (Monday, Tuesday, Wednesday, Thursday, and Friday) and weekend (Saturday and Sunday). Then, the data were processed according to time, as shown in Fig.1. The values in Fig.1 are average values. The variable of time of day was divided into six categories: 00:00—06:59 (midnight to dawn), 07:00—08:59 (peak hours in the morning), 09:00—11:59 (morning working hours), 12:00—16:59 (afternoon working hours), 17:00—18:59 (peak hours in the evening), and 19:00—23:59 (night time).
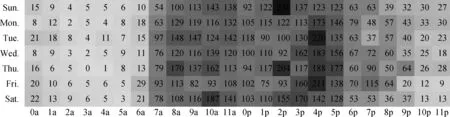
Fig.1 Frequencies of traffic violations by the time
The location of traffic violations was used to identify whether a driver is committing a traffic violation on the road section or at the intersection. The weather variable was divided into five categories according to the weather records of January 2019 in Shangyu: sunny, cloudy, light rain, moderate rain, and snowy. Combined with the information above, the research variables were determined (see Tab.2). Here, the dependent variable was traffic violations, and the remaining ones were the independent variables.
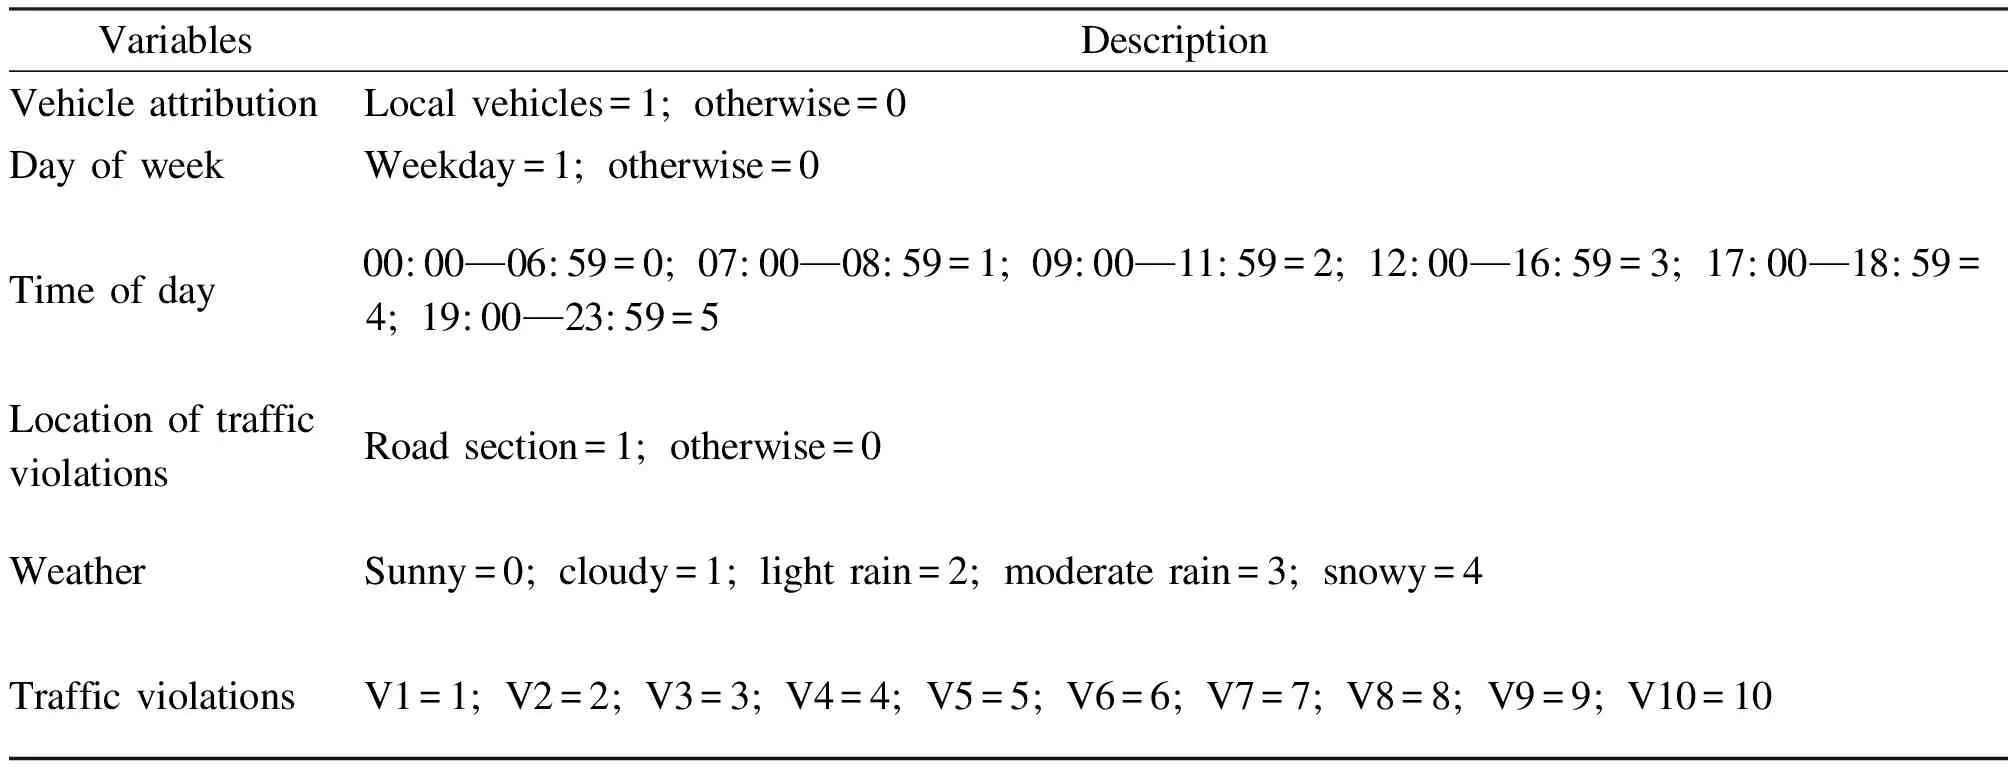
Tab.2 Value descriptions of variables
1.3 Chi-square test and multinomial logistic regression model
A chi-square test was conducted to analyze the relationship between traffic violations and the potential risk factors. The factors that were statistically significant at the 95% confidence levels were included in the final multinomial model fitted.
The categories in the dependent variable were discrete, nominal, and unordered. Multinomial logistic regression is an effective method in dealing with multi-category dependent variables[26]. Although multinomial logistic regression is not the only estimation methodology available for situations with unordered categorical dependent variables, it has two advantages: the estimates can be quickly calculated, and the model results are easily interpreted[27]. Thus, multinomial logistic regression was utilized in the current study to analyze the varying influence of each factor on the identified traffic violations.
When the dependent variable haskcategories, logistic regression analysis is conducted ink-1 categories, and thek-th category is defined as the reference category. Then the multinomial logistic regression model corresponding to thej-th traffic violations can be formulated as
wherepjandpkare the probabilities of the occurrence of thej-th andk-th kind of categories, respectively;βj0is constant;βjidenotes the regression coefficient of thei-th independent variablexjiin the multinomial logistic regression model of thej-th category; andnrepresents the number of independent variables[28].
2 Results
2.1 Descriptive statistics
After determining the research variables, the descriptive statistics of possible risk factors are summarized in Tab.3. The percentages of traffic violations by each category within a factor are shown in Tab.3. The percentages are the proportions of various types of traffic violations in each category within the risk factors. The percentage accumulation distributions of traffic violations under each category are shown in Fig.2.
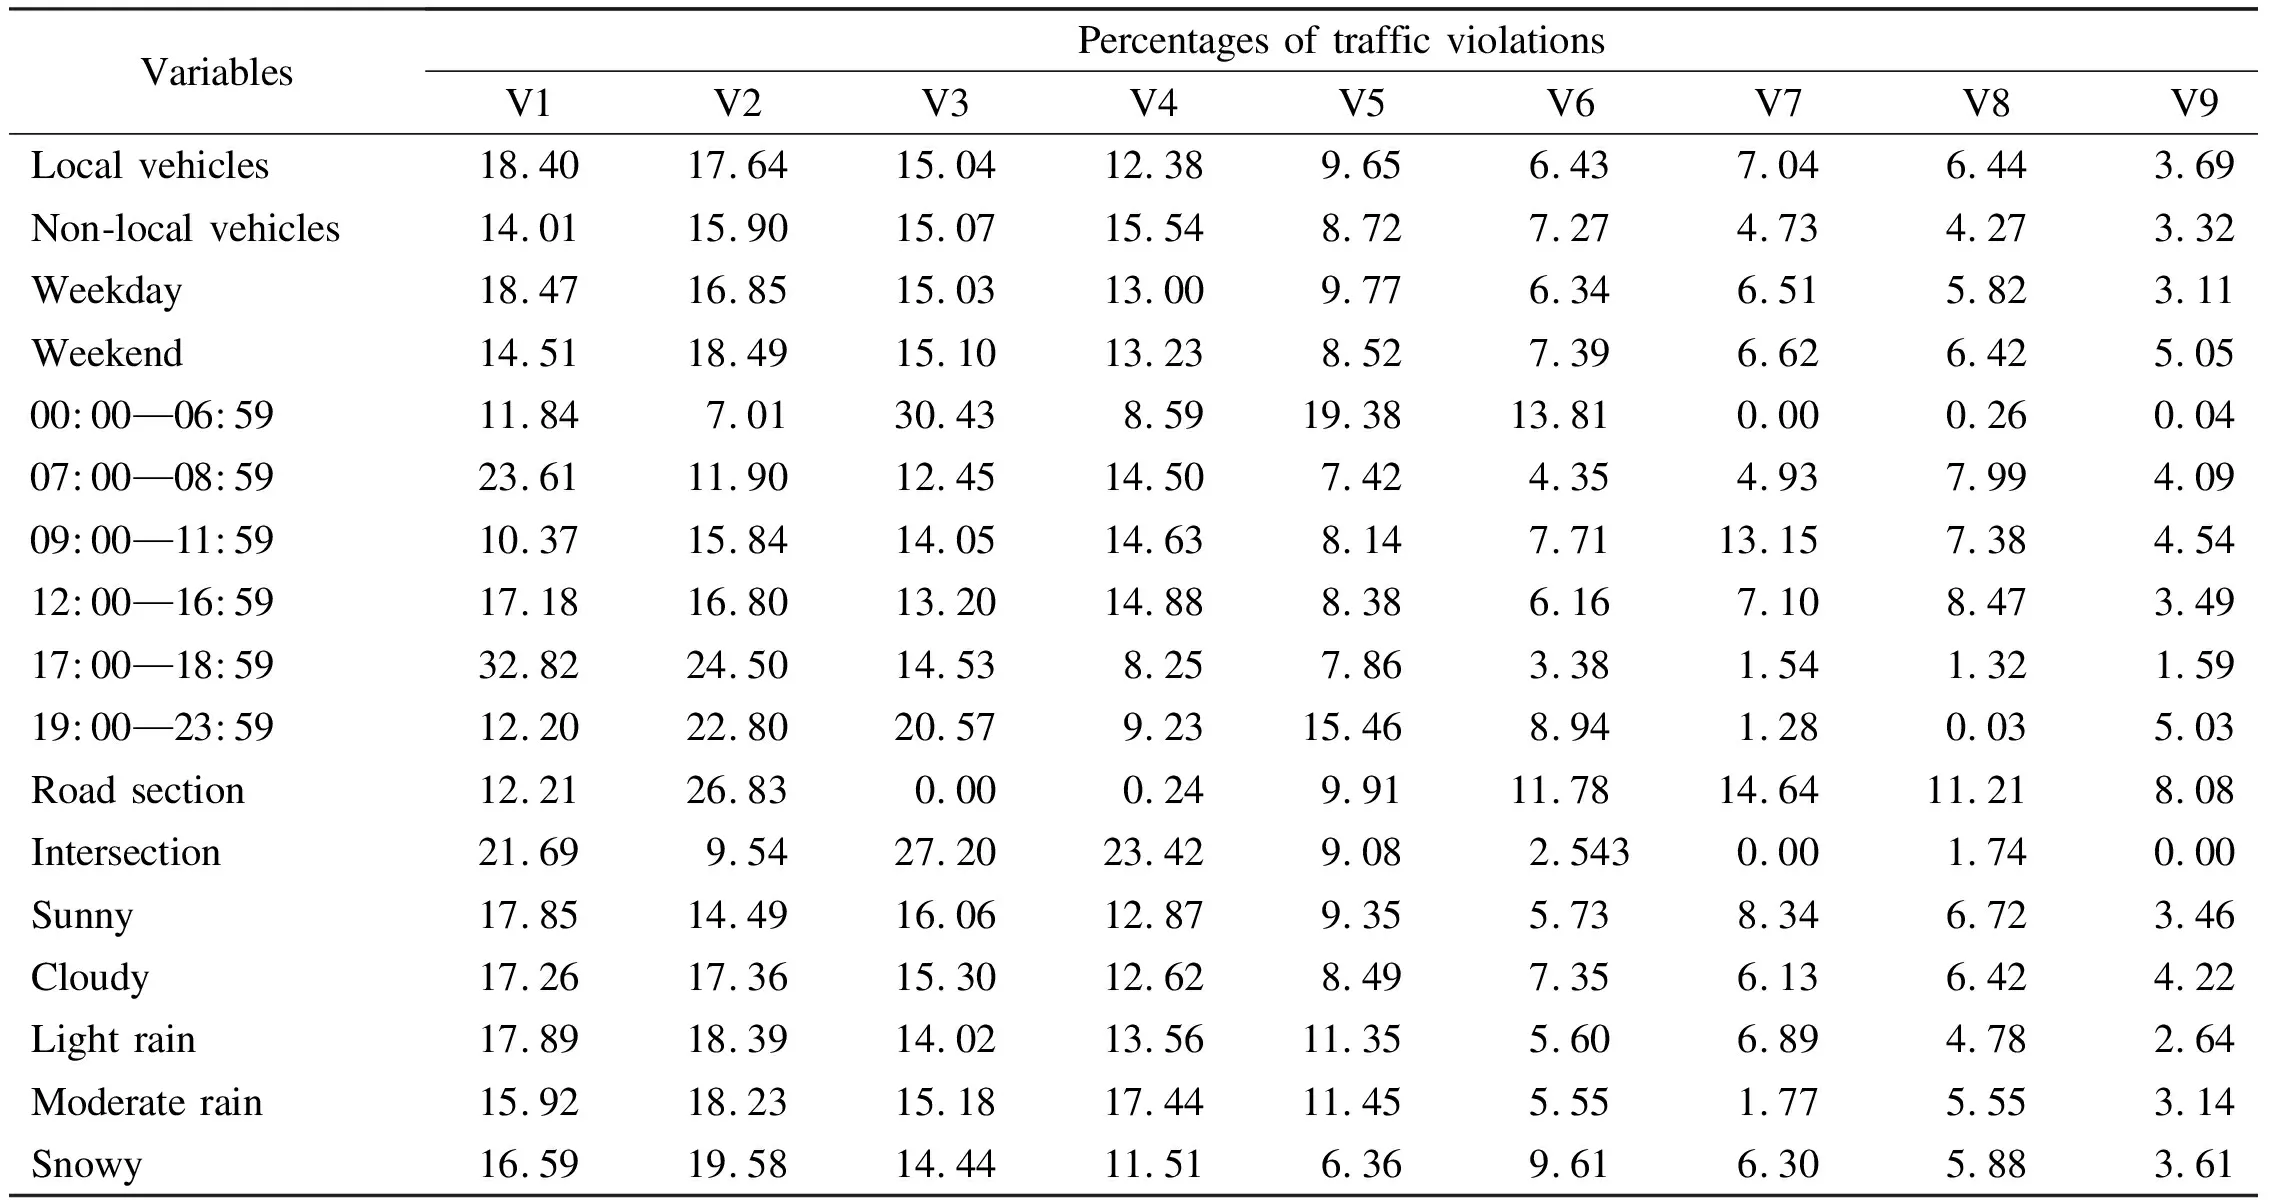
Tab.3 Traffic violation percentages in various influencing factors
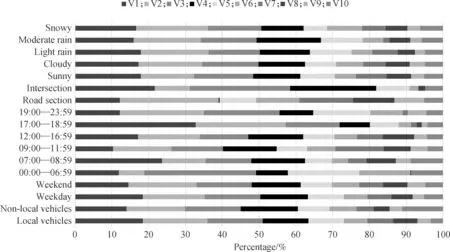
Fig.2 Percentage accumulation distributions of traffic violations
From Tab.3 and Fig.2, driving in the reverse direction and speeding by 20% but less than 50% account for a larger proportion at 00:00—06:59 (V5 19.38%, V6 13.81%) than at 07:00—08:59 (V5 7.42%, V6 4.35%), 09:00—11:59 (V5 8.14%, V6 7.71%), 12:00—16:59 (V5 8.38%, V6 6.16%), 17:00—18:59 (V5 7.86%, V6 3.38%), and 19:00—23:59 (V5 15.46%, V6 8.94%). Furthermore, violating traffic signals (V3), as the main traffic violation at 00:00—06:59, accounts for more than 30%.
Use of an improper oriented lane (V1 21.69%), violating traffic signals (V3 27.20%) and violating traffic markings (V4 23.42%) are the main violations at the intersection, while illegal parking (V2 26.83%) accounts for the largest proportion on the road section.
2.2 Factors affecting traffic violations
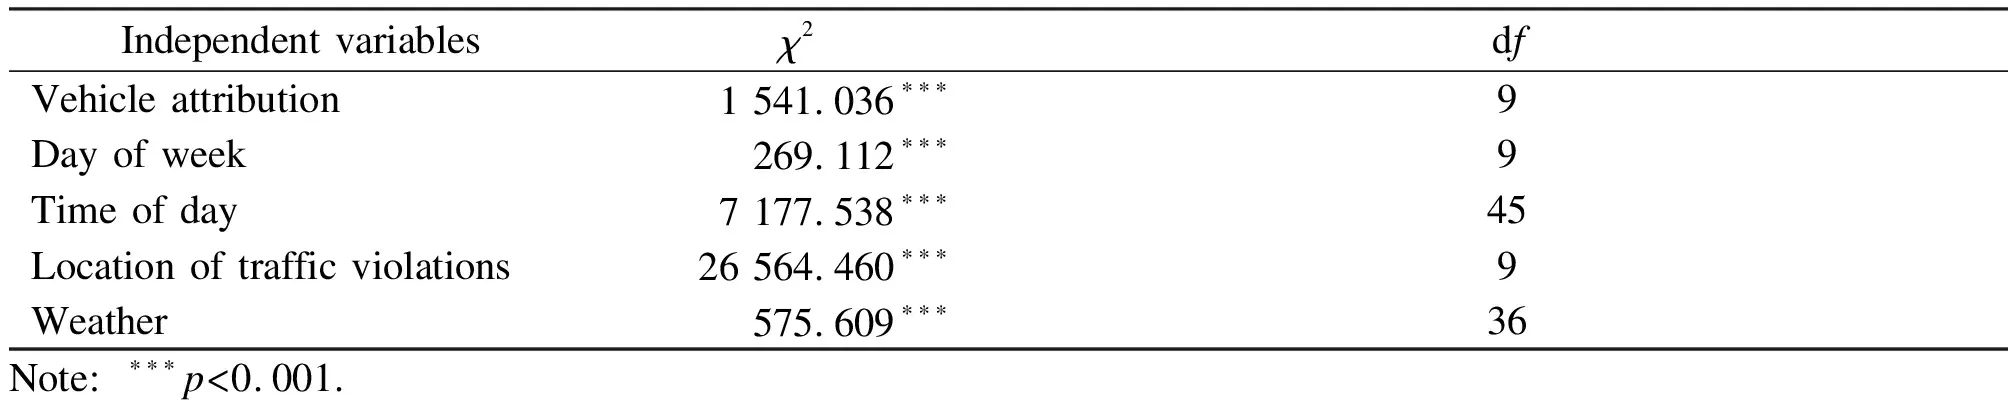
The chi-square test was conducted at the 5% level of significance. Tab.4 shows the results of the chi-square test. The chi-square statistic (χ2) of each variable is large andp<0.001, indicating that vehicle attribution, day of week, time of day, location of traffic violations, and weather are statistically significant factors associated
Tab.4 Chi-square test results
with traffic violations.
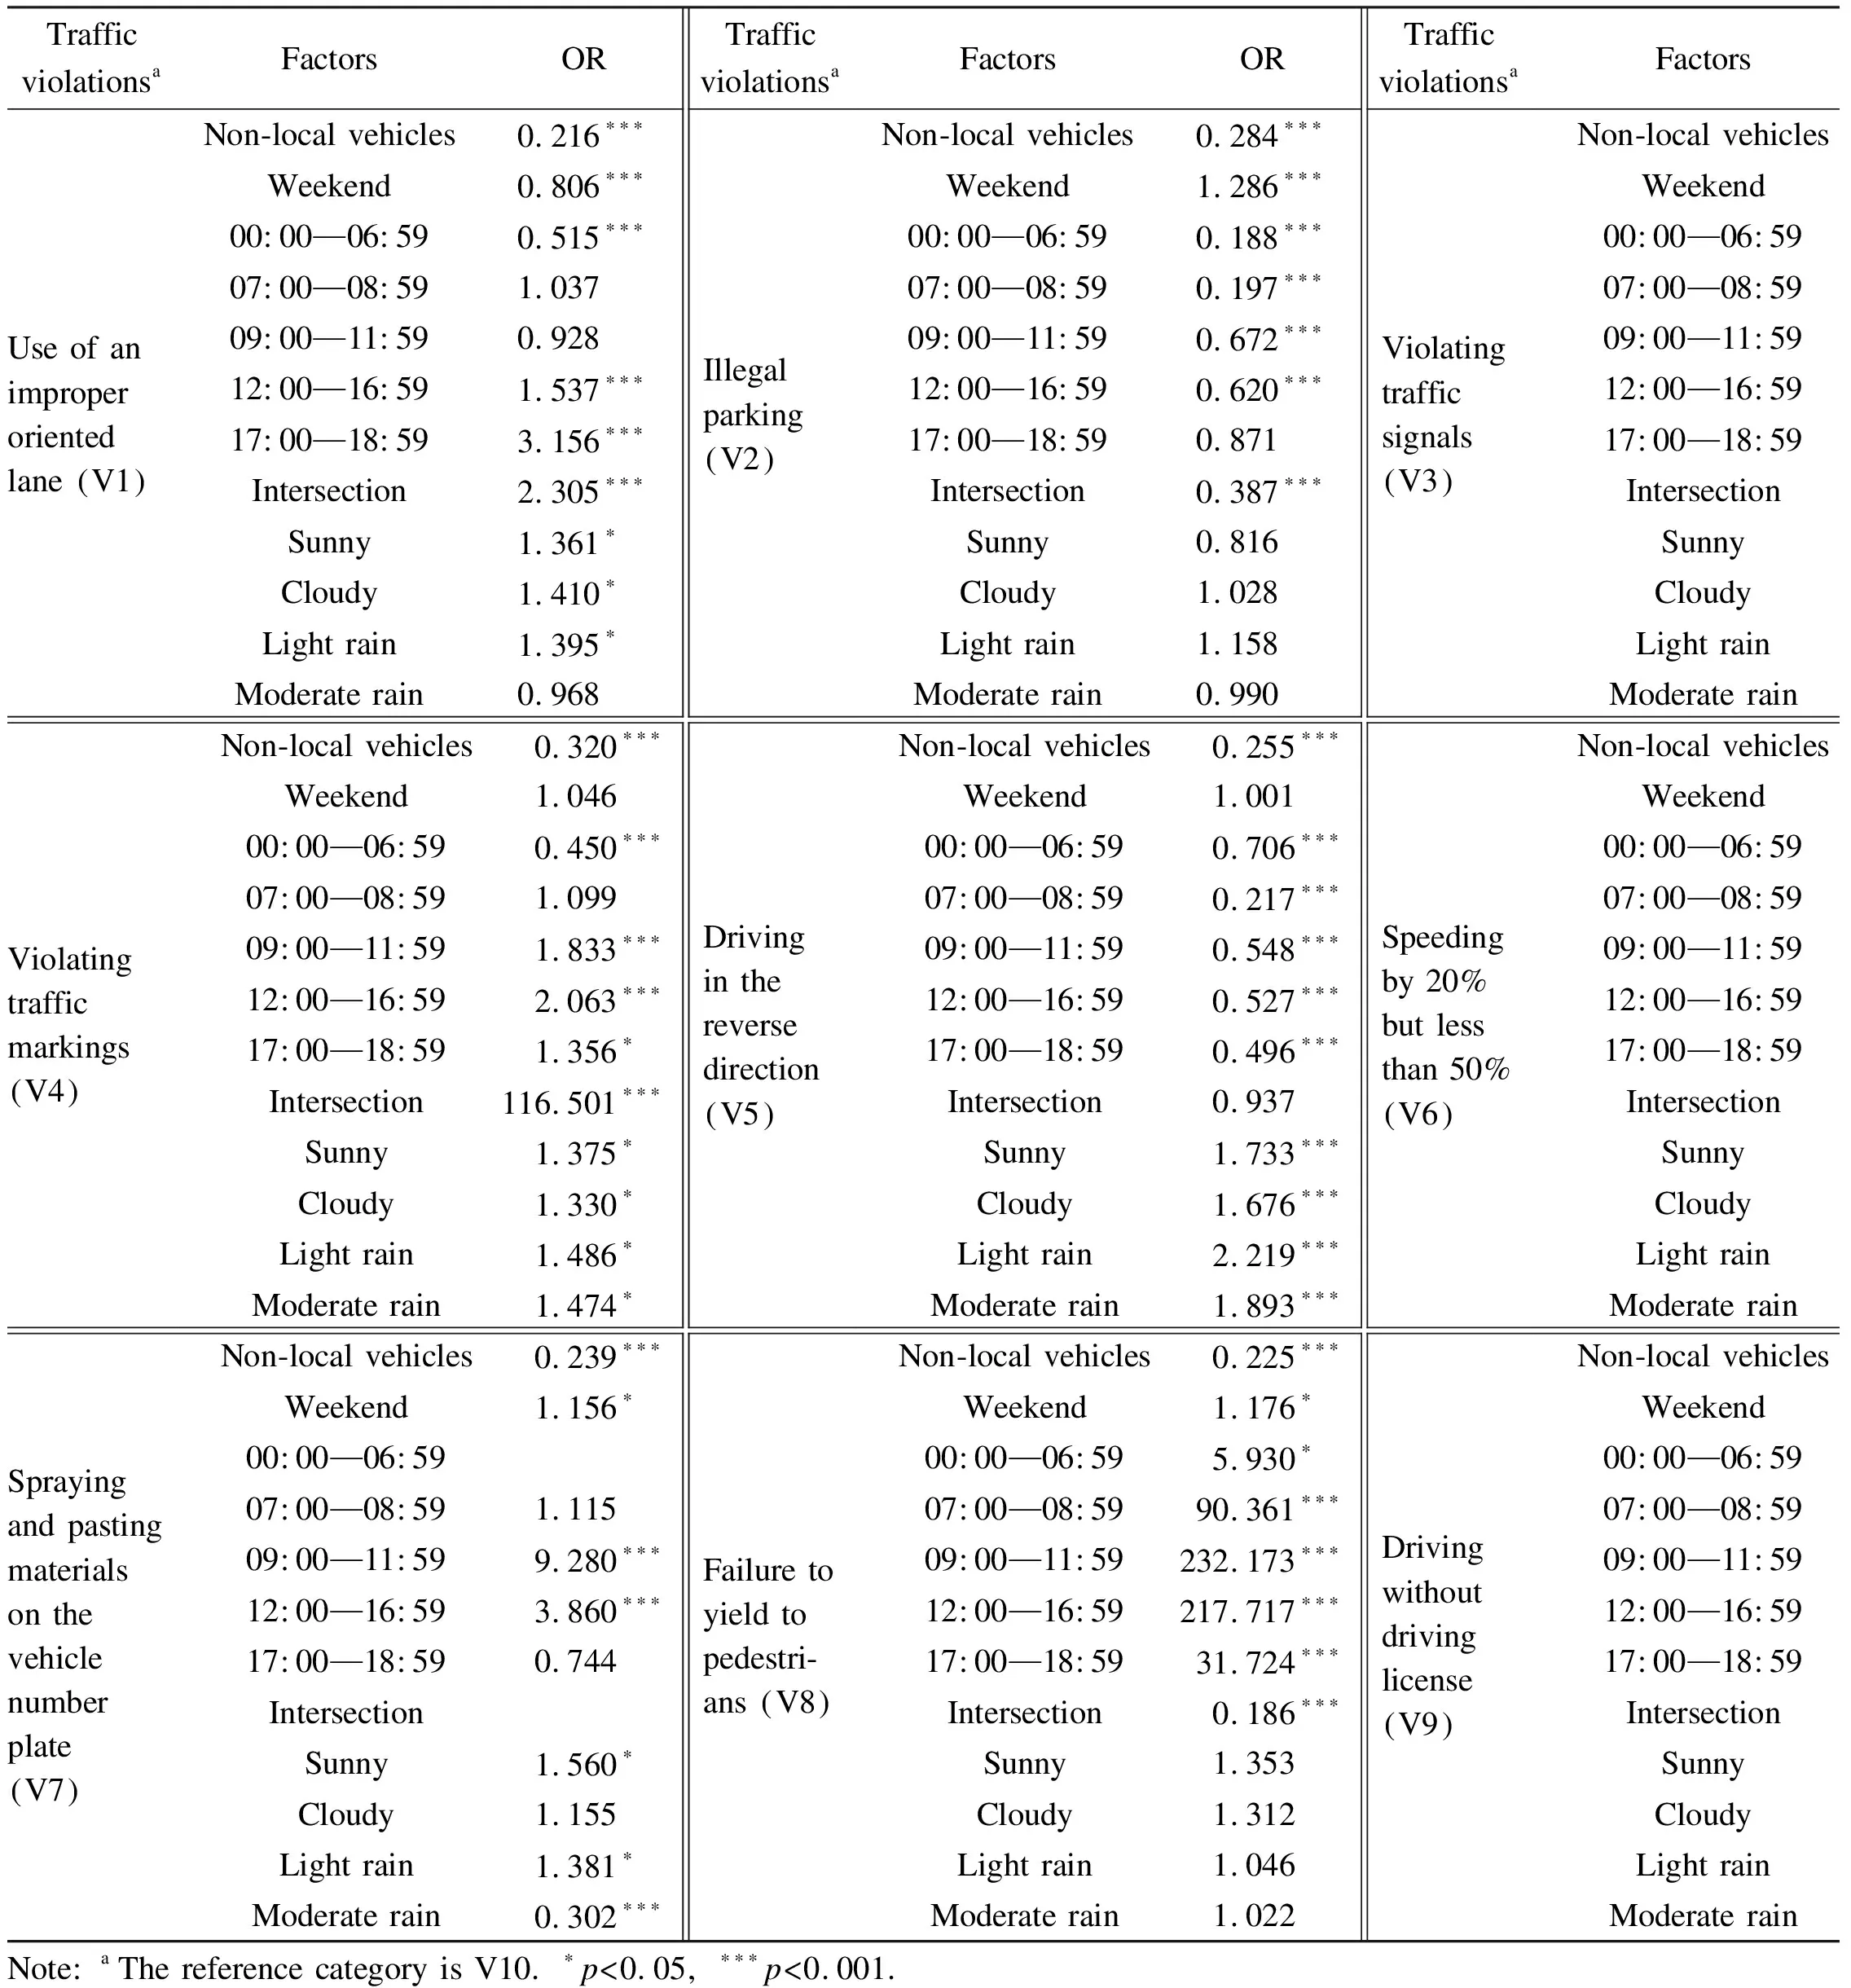
To further estimate the effects of different influencing factors on the likelihood of the occurrence of various traffic violations, logistic regression analyses were conducted. The values of each variable are defined in Tab.2. The data collected are imported into SPSS. Traffic violations was set as the dependent variable, and the other variables were chosen as factors in the model. According to the principle of multinomial logistic regression, a category was first selected as the reference category. Low-frequency traffic violations (V10) was chosen as the reference category in the multinomial logistic regression model of traffic violations. The reference categories of each factor were local vehicles, weekday, 19:00—23:59, road section, and snowy. The main output results are shown in Tab.5.
Tab.5 Parameter estimates of the multinomial logistic regression model
Odds ratio (OR) denotes the adjusted odds ratio for each factor. By analyzing OR, the effects of different influencing factors on the likelihood of the occurrence of various violations can be estimated.
Non-local vehicles (p<0.001, OR<1) exhibit a lower risk of all traffic violations compared to local vehicles, and V1 is less likely to occur on weekends (p<0.001, OR=0.806) than on weekdays. An increased probability of V1 is related to 17:00—18:59 (p<0.001, OR=3.156) and intersection (p<0.001, OR=2.305). V1 behaviour is less likely to occur in snowy compared to sunny (p<0.05, OR=1.361), cloudy (p<0.05, OR=1.410), and light rain (p<0.05, OR=1.395) weather conditions.
The probability of V2 occurring at the weekend (p<0.001, OR=1.286) is 1.286 times that in the weekday, and lower probabilities of V2 are exhibited at 00:00—06:59 (p<0.001, OR=0.188), 07:00—08:59 (p<0.001, OR=0.197), 09:00—11:59 (p<0.001, OR=0.672), and 12:00—16:59 (p<0.001, OR=0.620) than at 19:00—23:59. In addition, V2 is less likely to occur at the intersection (p<0.001, OR=0.387) than at the road section.
Vehicle attribution, time of day, and location of traffic violations are found to be significantly associated with V3 and V4. The effect of vehicle attribution has been discussed above. The intersection exhibits a particularly high risk of the occurrence of V3 and V4 compared to road sections, and lower probabilities of V3 and V5 are exhibited at 00:00—16:59 than at 19:00—23:59. The periods of 09:00—11:59 (p<0.001, OR=1.833), 12:00—16:59 (p<0 .001, OR=2.063), and 17:00—18:59 (p<0.05, OR=1.356) contribute significantly to the occurrence of V4. In addition, V3, V4, and V5 are less likely to occur in snowy weather.
Among the factors of day of week, results show that higher risks of V6 (p<0.001, OR=1.246), V7 (p<0.05, OR=1.156), V8 (p<0.05, OR=1.176), and V9 (p<0.001, OR=1.768) are more likely to be associated with weekends. In addition, an increased risk of V6 is associated with snowy weather. Sunny (p<0.05, OR=1.560) and light rain (p<0.05, OR=1.381) contribute significantly to the occurrence of V7.
V6 is less likely to occur at 07:00—08:59 (p<0.001, OR=0.166), 09:00—11:59 (p<0.05, OR=0.799), 12:00—16:59 (p<0.001, OR=0.530), and 17:00—18:59 (p<0.001, OR=0.275) than at 19:00—23:59. Conversely, V7 is more likely to occur at 09:00—11:59 (p<0.001, OR=9.280 and 12:00—16:59 (p<0.001, OR=3.860). In addition, the higher probabilities of V8 are exhibited at 00:00—06:59 (p<0.05, OR=5.930), 07:00—08:59 (p<0.001, OR=90.361), 09:00—11:59 (p<0.001, OR=232.173), 12:00—16:59 (p<0.001, OR=217.717), and 17:00—18:59 (p<0.001, OR=31.724) than at 19:00—23:59, which is contrary to the probability of V9.
Considering the location of traffic violations, the intersection is found to have lower risks of V6 (p<0.001, OR=0.191) and V8 (p<0.001, OR=0.186).
3 Discussions
3.1 Effects of vehicle attribution
Consistent with the conclusions of previous studies[16,29], local vehicles are more likely to become involved in various traffic violations. In particular, compared to non-local vehicles, local vehicles are more likely to commit red-light-running[16,29]and driving in inaccurately oriented lanes[16]. This may be attributed to the fact that non-local drivers are not familiar with the local traffic environment and are more cautious when driving, resulting in fewer traffic violations, while local drivers may appear more casual while driving in familiar conditions. Therefore, it is necessary to carry out effective safety publicity and training for drivers of local vehicles to improve their attention to traffic safety.
3.2 Effects of the day of week
It is noteworthy that illegal parking is more likely to occur on the weekend. However, Wang et al.[14]concluded that illegal stopping was less common on weekends than on weekdays. This may be attributed to our different research objects. This paper considered all vehicles, while Wang et al.[14]only investigated buses. As of December 2015, the number of motor vehicles in Shangyu had reached 193 000. The contradiction between the situation of the high-speed growth of motorization and resources is becoming increasingly serious. Most of the traveling done on weekdays is commuting, for which some motorists may choose public or shared transportation. In comparison, the travel purpose of travelers on the weekend is more for leisure, so cars are chosen by urban residents because of the advantages of high speed, high comfort, and flexibility. Therefore, the demand for parking is likely to increase on weekends. Furthermore, buildings at worksites are often equipped with complete parking facilities, but on weekends more travelers go to public places, thus highlighting the problem of large gaps in public parking spaces, which lead to more instances of illegal parking. Koohpayma et al.[30]also concluded that the number of vehicle parking violations is directly related to points of interest. Therefore, it is necessary to diversify investments in the construction of public parking lots and standardize the parking space allocation indicators for various types of land.
Unlike the results of a previous study[9], the higher likelihood of the occurrence of speeding by 20% but less than 50% was observed on weekends in the present study. Such inconsistency may be attributed to the fact that the previous literature studied the influencing factors of traffic violations based on incident case data. Some traffic violations cause incidents, whereas others do not. The higher probabilities of speeding by 20% but less than 50% can be explained by the fact that the driving purpose for leisure is associated with a higher speeding risk compared to the driving purpose for commuting[7].
3.3 Effects of time of day
Time of day is also identified as a significant factor associated with traffic violations. Illegal parking is more likely to take place at night (19:00—23:59). Drivers are inclined to park illegally when their dwell time is short[31]. The early morning (00:00—06:59) is still part of bedtime, and 09:00—16:59 is devoted to working hours, which lead to longer parking times during these periods. During the morning rush hour (07:00—08:59), more drivers are on their way to work and fewer parking behaviors occur. The period of 19:00—23:59 is off-work time, so there may be greater demand for temporary parking, which leads to more illegal parking.
The probabilities of violating traffic signals and driving in the reverse direction are observed to be higher in the evening (19:00—23:59). This is consistent with previous studies[16,24], which concluded that red-light-running was more likely to happen in the evening (18:00—23:59) than in the morning (06:00—11:59). When it is in the evening (19:00—23:59), the probabilities of driving in the reverse direction increase, which is in accordance with a previous conclusion[16]. The higher probabilities of the occurrence of violating traffic signals and driving in the reverse direction may be due to bad visibility in the evening. Therefore, on the one hand, it is necessary to improve the lighting conditions; on the other hand, the setting of signal lights and pavement markings should be standardized. Drivers can better see the signal lights and traffic markings, thus reducing the rate of traffic violations. Certainly, the drivers’ intentional behaviors should not be ruled out, and these should be solved by strengthening the traffic safety education for drivers.
Furthermore, a higher probability of speeding by 20% but less than 50% is related to 19:00—23:59. There is no significant difference between the probabilities of traffic violations at 00:00—06:59 and at 19:00—23:59. The traffic volumes in these two periods are lower than those in the other four periods, which may result in higher average vehicle speed at 00:00—06:59 and 19:00—23:59. It is possible that police enforcement intensity at dawn and at night is lower than that during the day due to poor visibility; thus, drivers are likely to rely only on their luck, resulting in more traffic violations mentioned above. Thus, the improvement of lighting conditions and enforcement intensity may be helpful in reducing the above traffic violations[9]. Interval-based speed enforcement systems[32], social media campaigns, advocacy for legislative change, and law enforcement training[33]are also effective in reducing the percentage of speeding.
In addition, 09:00—11:59, 12:00—16:59, and 17:00—18:59 are periods of higher rates of violating traffic markings. The risk of failure to yield to pedestrians is especially high during working hours (09:00—11:59 and 12:00—16:59), with OR=232.173 and OR=217.717, respectively. The probabilities of traffic violations in the morning rush hour (07:00—08:59, OR=90.361) and evening rush hour (17:00—18:59, OR=31.724) are also higher than at night time (19:00—23:59). This may be attributed to the fact that there is a greater volume of pedestrian flow during the daytime. In order to create a good walking environment for pedestrians, it is necessary to impose heavier punishment on drivers who do not yield to pedestrians. Briefly speaking, targeted traffic intervention measures can be proposed for significant traffic violations with a higher probability of occurrence in different periods.
3.4 Effects of the locations of traffic violations
The risks of use of an improper oriented lane, violating traffic signals, and violating traffic markings at the intersection are much higher than at the road section. Previous studies have also shown that these traffic violations are common behaviors at the intersection[16,24,29,34-35]. This may be related to the fact that most of the oriented lanes, traffic signals, and traffic markings are placed at the intersection. In view of these common traffic violations at intersections, it is necessary to standardize the setting of traffic signs and markings, improve lighting conditions, reasonably regulate signal timing at signalized intersections, or take reasonable channelization measures. Strengthening the traffic safety education for drivers is also of great importance.
The road section is more likely to be involved in illegal parking, speeding by 20% but less than 50%, and failure to yield to pedestrians. On account of the high-speed growth of motorization, cities frequently permit parking or temporary parking at road sections without heavy traffic. Curb parking influences road capacity and has adverse influences on the operation safety of dynamic traffic[36]. Moreover, curb parking violations directly cause traffic congestions and interrupt the normal flow of cars on the roads[30]. There is also a large gap in public parking spaces in Shangyu, and the supply and demand for equipped parking spaces are uneven.
In addition, the parking fees in Shangyu are lower compared to cities with the same development scale. In addition to the consideration of the nature of land use, parking requirements should also be modified according to the specific conditions of the area to formulate more accurate and flexible parking space allocation standards. Moreover, we should give full play to the role of economic leverage, increase the charging standards for on-street parking, and raise the penalties for illegal parking. As for the two violations of speeding by 20% but less than 50% and failure to yield to pedestrians, slowing down before entering the intersection and yielding to pedestrians at the intersection may be normal for drivers, while they could be ignored by drivers at the road section. Therefore, the adjustment of the traffic monitoring system and police enforcement plan is necessary to overcome specific violations that require varying interventions at different locations. Strengthening traffic safety education for drivers can also help reduce these traffic violations.
3.5 Effects of weather
The weather has been found to significantly impact the likelihood of the occurrences of the following violations: use of an improper oriented lane, violating traffic signals, violating traffic markings, driving in the reverse direction, and speeding by 20% but less than 50%. Drivers are more likely to violate traffic signals on sunny and cloudy days. Although thepvalue of rainy days is not significant at the significance level of 95%, the probability of violating traffic signals is larger on rainy days than on snowy days. Similarly, the probability of violating traffic markings on snowy days is smaller than those under the four other weather conditions. This may be attributed to the fact that sunlight on sunny and cloudy days reduces the visibility of the traffic signal and traffic markings. The rain can also obstruct the driver’s view of the traffic signal and markings. Relevant departments should thus improve the design of traffic signals and markings based on the drivers’ cognitive characteristics of information.
Meanwhile, compared with other weather conditions, the probability of speeding on snowy days increases, which is in accordance with the conclusions of existing studies[15-16], indicating that bad weather significantly increases traffic violations. Road skidding can be caused by snowy days, which can lead to unfavorable factors for driving and braking. In turn, these can lead to speeding and even traffic accidents. Therefore, in order to reduce related traffic violations under severe weather conditions, the traffic management department should set up relevant slogans or variable signs to remind drivers to be careful of slippery roads. Relevant departments should also clear the roads in a timely manner during snowy weather.
4 Conclusions
1) Local vehicles are more likely to be involved in various traffic violations.Illegal parking and speeding by 20% but less than 50% are more likely to occur on the weekend.
2) Illegal parking,violating traffic markings, driving in the reverse direction, and speeding by 20% but less than 50% frequently occurred at 19:00—23:59.The periods within 09:00—18:59 show higher probabilities of violating traffic markings, whereas the periods within 09:00—16:59 show higher rates of failure to yield to pedestrians.
3) The risks of use of an improper oriented lane, violating traffic signals, and violating traffic markings at the intersection are much higher, and road section is more likely to be involved in illegal parking, speeding by 20% but less than 50%, and failure to yield to pedestrians.
4) The probability of speeding in snowy weather is higher, while the probabilities of violating traffic signals and violating traffic markings are higher in other weather conditions.
5) Some targeted traffic intervention measures have been proposed to resolve significant traffic violations with higher probabilities of occurrence in different situations.
杂志排行

Journal of Southeast University(English Edition)的其它文章
- Effects of crankpin bearing speed and dimension on engine power
- A method for workpiece surface small-defect detection based on CutMix and YOLOv3
- Three-dimensional visualization interactive system for digital twin workshop
- Design and evaluation of cab seat suspension system based on negative stiffness structure
- Transformer-like model with linear attention for speech emotion recognition
- Non-inverting buck-boost DC-DC converter based on constant inductor current control