Differences in the evolution of mitochondrial genome between pollinating and non-pollinating fig wasps
2021-05-25WANGJianXiaZHOUYiXINZhaoZheZHAODanXIAOJinHuaHUANGDaWei
WANG Jian-Xia, ZHOU Yi, XIN Zhao-Zhe, ZHAO Dan,XIAO Jin-Hua, HUANG Da-Wei
(Institute of Entomology, College of Life Sciences, Nankai University, Tianjin 300071, China)
Abstract: 【Aim】 At present, there are few reports on the mitochondrial genomes of fig wasps. The purpose of this study is to explore whether there are some differences in the evolution of mitochondrial genome (mitogenome) between pollinating fig wasps (PFWs) and non-pollinating fig wasps (NPFWs). 【Methods】 Based on the mitogenomes from 15 fig wasp species, of which the mitogenomes of 11 species were newly determined, we used the comparative mitochondrial genomic method to analyze the sequence and evolutionary characteristics of the mitogenomes of fig wasps. 【Results】 The length of the mitogenomes of 11 fig wasps newly determined ranges from 12 768 to 17 060 bp, and the AT content in the 11 mitogenomes is more than 80%. The AT-skew is negative and the GC-skew is positive in most species except for the non-pollinating fig wasp Philotrypesis tridentata. Frequent mitochondrial gene rearrangement occurs in fig wasps, which may be valuable for phylogenetic analysis of the species. Further analysis of selection pressure indicates that the ω ratios of protein-coding genes (PCGs) in mitogenomes of fig wasps are far less than 1, suggesting that these genes have experienced purifying selection. However, most of the genes in PFWs may have accumulated more non-synonymous mutations than those in NPFWs. Furthermore, compared with the NPFWs, the mitogenomes of PFWs have more gene rearrangements, and higher nucleotide diversity and amino acid substitution rate. 【Conclusion】 The mitogenome evolution of PFWs is faster than that of NPFWs, which may be related to the significantly different lifestyles or evolutionary histories of the two groups.
Key words: Fig wasps; mitochondrial genome; gene rearrangement; nucleotide diversity; purifying selection; amino acid substitution
1 INTRODUCTION
Generally, the mitochondrial genome (mitogenome) of insects is a circular DNA molecule, consisting of 37 genes (13 protein-coding genes, 22 tRNA genes and 2 rRNA genes) and a control region (CR). Based on the sufficient genetic information, the mitogenomes are widely used in the study of insect identification, biogeography and phylogeny (Nelsonetal., 2012). Up to now, only a few mitogenomes have been reported in Chalcidoidea (Oliveiraetal., 2008; Xiaoetal., 2011, 2012; Nedoluzhkoetal., 2016; Suetal., 2016; Chenetal., 2018; Zhuetal., 2018; Yanetal., 2019; Yangetal., 2019), and the data in fig wasps, a group of chalcid wasps that live in the compact fig syconia of fig trees (Ficus: Moraceae) (Weiblen, 2002), are even rarer. However, these studies have shown rapid evolution of mitogenomes in fig wasps, mainly due to the dramatic gene rearrangement and high gene substitution rate (Xiaoetal., 2011, 2012; Yanetal., 2019). Compared to the mitogenome of ancestral insects, gene rearrangements have occurred in mitogenomes of all the reported fig wasps, including not only tRNA genes but also PCGs, and even closely related species may share different mitochondrial gene orders (Xiaoetal., 2011). In fact, some gene rearrangements can provide useful phylogenetic information (Yoshizawaetal., 2018), and Xiaoetal. (2011) found that when the gene order was mapped to the phylogenetic tree of the Hymenoptera, it could clearly depict the relationships among the species of Chalcidoidea. Xiaoetal. (2011) have also detected elevated non-synonymous substitution in the PCGs of two fig wasp species ofPhilotrypsis, compared to those ofNasoniaandDrosophila.
Some studies have indicated that rapid evolution of the mitogenome of Hymenoptera may be related to parasitic lifestyles (Castroetal., 2002). As a lineage of Hymenoptera, fig wasps can be grouped into pollinating fig wasps (PFWs) and non-pollinating fig wasps (NPFWs), based on whether they can pollinate figs. The lifestyles of PFWs and NPFWs are quite different. PFWs and fig trees are a textbook example of obligate mutualism, since fig trees rely on PFWs to produce seeds, which in turn provide nutrition and shelter for PFWs to reproduce (Zhang Xetal., 2020). However, the NPFWs ensure their survival by ingesting the resources in banyan fruits, but they do not pollinate. Therefore, the relationship between NPFWs and fig trees is more parasitic. By comparing the characteristics and evolution of the mitogenomes of these two groups, we can further explore whether the evolution of mitogenomes of Hymenoptera is related to their lifestyles.
In this study, we selected the mitogenomes of six PFWs and nine NPFWs, of which the mitogenomes of 11 species were newly sequenced in this study. We analyzed the characteristics and evolution of the 15 mitogenomes, and focused on comparing the evolution of mitogenome between PFWs and NPFWs. Our study can not only enrich the mitogenome database of Chalcidoidea, but also provide more information on the relationship between the evolution of mitogenomes and their lifestyles in Hymenoptera.
2 MATERIALS AND METHODS
2.1 Mitogenome assembly
Based on the Illumina TruSeq libraries of mitogenomes of 11 fig wasp species (Table 1) including PFWs and NPFWs constructed by our previous genome sequencing projects, the putative mitogenome reads were filtered out against the mitogenomes of related species using BLAST (BLASTn with E-value: 1-10-5). Then, the obtained reads were used to produce adenovoassembly using CAP3 (Huang and Madan, 1999). The mitogenomes of the other four fig wasps were downloaded from GenBank:Odontofroggatiagalili(MW167113),Sycophagamayri(MW167114),Micranisaralianga(MW167115) andWalkerellamicrocarpae(MW167116) (Zhaoetal., 2021).

Table 1 Taxonomic information and GenBank accession numbers of the mitogenomesof the 15 fig wasp species used in this study
2.2 Mitogenome annotation and sequence analysis
The MITOS web server (Berntetal., 2013) was used to annotate the genes in the newly sequenced mitogenomes of the 11 fig wasps in section 2.1. By aligning with the mitogenome data of the other Chalcidoidea species downloaded from GenBank, the start and stop positions of PCGs were manually adjusted. The base composition of whole mitogenome and codon usage of PCGs were analyzed with MEGA 7.0 (Kumaretal., 2016). The AT-skew and GC-skew for whole mitogenome were calculated using the following formulas: AT-skew=(A-T)/(A+T) and GC-skew=(G-C)/(G+C). We used Crex web server (Berntetal., 2007) to analyze the common intervals. The number of common intervals is a similarity measure between genomes,i.e., larger number of common intervals means more similar gene orders between genomes.
2.3 Phylogenetic analysis
The phylogenetic relationships of the 15 fig wasp species (Table 1) were determined using Bayesian inference (BI) based on the amino acid sequences of 13 PCGs and those of the white fly parasite speciesEncarsiaformosa(sequence accession ID: MG813797) chosen as the outgroup (Zhaoetal., 2021). Amino acid sequences encoded by 13 PCGs were aligned by using the software MAFFT v7.450 (Katoh and Standley, 2013), and conservative regions were extracted from sequence alignment results using the program Gblocks (Talavera and Castresana, 2007) with default settings. Alignment sequences of 13 PCGs were concatenated using PhyloSuite v1.1.16 (Zhang Detal., 2020). The evolutionary model was estimated to be the best with the software ProtTest (Darribaetal., 2011). The BI tree was built by using the MrBayes software (Huelsenbeck and Ronquist, 2001) with the Markov chain Monte Carlo (MCMC) analysis using one million generations. The final tree data with the value of average standard reduction of split frequencies lower than 0.01 and the effective sample size (ESS) value greater than 200 were obtained. The tree was visualized using iTOL (Letunic and Bork, 2016).
2.4 Nucleotide diversity estimation
DnaSP 6 (Rozasetal., 2017) was used to calculate the nucleotide diversity (π, the average diversity of every site in DNA sequence between species, presents the hereditary variation degree of a gene) (Nei and Li, 1979) of PFWs and NPFWs based on the nucleotide sequences of 13 PCGs and concatenated PCGs. The difference in the meanπbetween PFWs and NPFWs was compared with Wilcoxon signed rank tests.
2.5 Natural selection test
Based on the nucleotide sequences of 13 PCGs and concatenated PCGs, we used PAML v.4.9f (Yang, 2007) to estimate the dN/dS (ω). In our analysis, one-ratio model and free-ratio model of branch models were used to detect the selection pressure on different lineages. Wilcoxon signed rank tests were used to test for significance of difference in the mean ω ratios between PFWs and NPFWs. In addition, two sets of site models were used to detect positive selection sites: M1a (nearly neutral)-M2a (positive selection) and M7 (beta)-M8 (beta and ω) comparisons (Yang, 2000, 2007). For each of the above-mentioned analyses, we used pairwise likelihood ratio tests (LRTs) to determine which model has a significant fitter for our datasets. The LRT value can be approximatedChi-square (χ2) distribution and calculated by chi2 in PAML.
2.6 Comparison of mitochondrial amino acid substitution rate
The amino acid substitution rate (number of substitutions per amino acid site) was extracted using Newick utilities v1.6 (Junier and Zdobnov, 2010) from the BI tree constructed by MrBayes (Huelsenbeck and Ronquist, 2001) based on the amino acid sequences of 13 PCGs and concatenated PCGs. The difference in the mean amino acid substitution rate between PFWs and NPFWs was compared with Wilcoxon signed rank tests. Statistical analysis and Wilcoxon signed rank test were performed in R v3.6.2.
3 RESULTS
3.1 General features of the newly sequenced mitogenomes of 11 fig wasps
Nearly complete mitogenomes of 11 fig wasp species were newly sequenced and characterized (Table 2). The sequences were deposited in GenBank under the following accession numbers: MT947596 (Dolichorisvasculosae), MT947601 (Wiebesiapumilae), MT947597 (Eupristinakoningsbergeri), MT947604 (Platyscapacorneri), MT916179 (Ceratosolenfusciceps), MT947598 (Kradibiagibbosae), MT947600 (Sycobiasp.2), MT906648 (Apocryptabakeri), MT947602 (Philotrypesistridentata), MT947599 (Sycophagaagraensis) and MT947603 (Sycophilasp.2). The whole mitogenome sizes range from 12 768 bp (P.corneri) to 17 060 bp (E.koningsbergeri). Further annotation results showed that the mitogenomes of the 11 fig wasps are incomplete, mainly due to sequencing and assembly issues, since all species lack CRs. The mitogenomes of all species contain 37 genes, including 13 PCGs, two rRNA genes (rrnLandrrnS), and 22 tRNA genes, except forP.corneri,C.fuscicepsandS.agraensis, which have some tRNA genes undiscovered probably because they are located around the CRs.
The AT contents in mitogenomes of all the 11 fig wasp species are higher than 80.00%, with the highest AT content inPhilotrypesistridentata(84.66%) and the lowest inP.corneri(80.83%). The AT-skew in the 11 species except forP.tridentata(0.004), is negative, ranging from -0.017 (D.vasculosae) to -0.159 (Sycophilasp.2). The GC-skew in the 11 species except forP.tridentata(-0.001) is positive, ranging from 0.011 (S.agraensis) to 0.052 (W.pumilae). The contents of T and G in the mitogenomes of most fig wasps are higher than those of A and C.

All the PCGs start with the standard start codon of ATN and stop with TAG, TAA or T, as in many other insects (Otrantoetal., 2005). The results of relative synonymous codon usage (RSCU) values of all the 11 fig wasp species showed that all possible synonymous codons exist in 22 amino acids, with Leu, Phe, Ile, and Met to be the most commonly encoded amino acids, and TTA, TTT, ATT and ATA the most frequently used codons.
3.2 Gene rearrangement in mitogenomes
Among the 15 fig wasp species,D.vasculosaeandW.pumilaeof Agaoninae have the same gene orders.S.agraensisandS.mayriof Sycophaginae, andO.galiliandSycobiasp.2 of Epichrysomallinae also have the same gene orders (Fig. 1). Among the remaining species, no two species share the same mitochondrial gene orders, even those closely related species belonging to the same subfamily. The difference in gene orders is mainly due to tRNA gene rearrangement. For example, between the species ofC.fuscicepsandK.gibbosaebelonging to Kradibiinae, the differences in the gene orders are attributed to the transpositions oftrnT-trnPandtrnK-trnD. Moreover, some lineage-specific gene orders of tRNA genes are also found. For example, duplication of thetrnMgene is found in the PFWsD.vasculosae,E.koningsbergeri,K.gibbosaeandW.pumilae. In all the PFW species, the tRNA genes betweennad1 andcobaretrnS2-trnR, and the tRNA genes betweenrrnSandrrnLaretrnA-trnQ. In the NPFW species, the tRNA genes betweenrrnSandrrnLaretrnAin Sycoryctinae and Otitesellinae andtrnA-trnQin Epichrysomallinae, respectively.
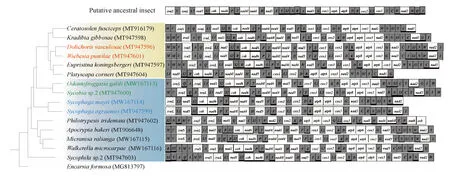
Fig. 1 Bayesian estimation of phylogenetic relationships with mapped mitochondrialgene rearrangements for 15 fig wasp speciesThe BI tree was built by using the MrBayes software with the Markov chain Monte Carlo (MCMC) analysis using one million generations based on the concatenated amino acid sequences of 13 PCGs. White box indicates mitochondrial protein-coding genes. Diagonal box indicates mitochondrial rRNA genes. Grey box indicates mitochondrial tRNA genes, which are indicated by the single-letter abbreviations for their corresponding amino acid. Genes encoded by the minor strand are labeled with black bold lines under the boxes. The yellow background represents PFWs, and the blue background represents NPFWs. The same font color means that species has the same mitochondrial gene order.
Further, in comparison to the mitochondrial gene order of the putative ancestral insect, we found that except for the NPFW speciesP.tridentata, all the fig wasp species have conserved gene order in the cluster ofnad4l-nad4-trnH-nad5-trnF-trnEas the ancestral species, and a gene rearrangement consisting of a reversal of a large block ofcox1-trnL2-cox2-trnK-trnD-atp8-atp6-cox3.Nad2 andnad3 are also hot spots of gene rearrangement in PCGs. AlthoughtrnSandtrnVare not obtained in some species, the reversion of the gene clustertrnV-rrnSis also observed in most fig wasp species. However, when compared with that of ancestor or other fig wasp species, dramatic gene order rearrangement is observed inP.tridentata. Novel gene rearrangements ofP.tridentatahave taken place compared with ancestral insect: reversion of the gene clusters ofcox2-trnK-trnD-atp8-atp6-cox3-trnGandtrnE-trnF-nad5-trnH-nad4-nad4l-trnT-trnP-nad6-cob. All the results indicate that mitochondrial gene rearrangements of fig wasps are rich and variable, and genome organization ranges from single tRNA gene or PCG rearrangement to the big block containing tRNA genes and PCGs.
In addition, the number of common intervals between the mitogenomes of 15 fig wasp species and the putative ancestral insect (Fig. 2) decreases in the order as follows:S.agraensis>Sycophilasp.2>S.mayri>Sycobiasp.2>O.galili>M.ralianga>A.bakeri>D.vasculosae>W.pumilae>W.microcarpae>K.gibbosae>P.tridentata>P.corneri>C.fusciceps>E.koningsbergeri. Compared with that of PFWs (171), the mean number of common intervals of NPFWs (268) is significantly higher (Wilcoxon signed rank test,P<0.01), implying that the mitochondrial gene orders of NPFWs are more similar to the ancestral insect mitogenome, and there are more rearrangements of mitochondrial genes in PFWs than in NPFWs.
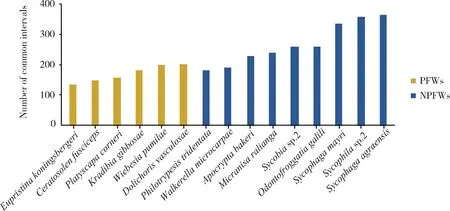
Fig. 2 The number of common intervals between the mitogenomes of 15 fig wasp species and the putative ancestral insectThe number of common intervals is a similarity measure, i.e., high number of common intervals means similar gene order.
3.3 Nucleotide diversity (π) in mitogenomes
The order of the nucleotide diversity of 13 PCGs in mitogenomes of 15 fig wasp species from high to low is:nad6>nad2>atp8>nad4l>nad4>cox3>nad3>cox2>atp6>nad1>nad5>cob>cox1 for all the species,nad6>nad2>nad4l>nad3>cox3>atp8>nad1>nad4>nad5>cox2>atp6>cox1>cobfor the six PFWs, andatp8>nad2>nad6>nad4l>nad4>cox2>nad5>cox3>nad3>atp6>nad1>cob>cox1 for the nine NPFWs.Cox1 andcobare the most conserved genes in both PFWs and NPFWs, whilenad6 andnad2 are the two fastest evolved genes in PFWs, andatp8 andnad6 are the two fastest evolved genes in NPFWs. The nucleotide diversity of nine PCGs (except foratp8,cob,cox2 andnad4) or the concatenated PCGs are slightly higher in PFWs than in NPFWs, but the differences are not significant (Wilcoxon signed rank test,P>0.05).
3.4 Natural selection
Natural selection analysis results based on the nucleotide sequences of the 13 PCGs and concatenated PCGs in mitogenomes of 15 fig wasp species showed that the ω ratios for all 13 PCGs are far less than 1, suggesting the existence of strong evolutionary constraints and purifying selection. The results of free-ratio model indicated that different lineages may be exposed to different selection pressures during the evolutionary process. The mean ω values of nine PCGs (except foratp8,cox3,nad3 andnad5) and concatenated PCGs in PFWs are higher than those in NPFWs, even though the differences are significant only in the genes ofatp6,cox1,nad1 and concatenated PCGs (Wilcoxon signed rank test,P<0.05) (Fig. 3), suggesting that PFWs have accumulated more non-synonymous mutations than NPFWs. However, by using site models, we detected no positive selection site in the 13 PCGs, further indicating that these genes are relatively conservative and may have very important functions.
3.5 Estimation of amino acid substitution rate in mitogenomes
We estimated the amino acid substitution rate based on the amino acid sequences of 13 PCGs and concatenated PCGs of mitogenomes of the 15 fig wasp species. The results (Fig. 4) showed that the average amino acid substitution rate between PFWs and their common ancestor is higher than that between NPFWs and their common ancestor. Furthermore, the difference is significant in most PCGs, except foratp8,cobandcox3 (Wilcoxon signed rank test,P<0.05). These results indicated that the mitochondrial amino acid substitution rates in PFWs are higher than those in NPFWs.
4 DISCUSSION AND CONCLUSION
4.1 Evolutionary characteristics of mitogenomes of fig wasps
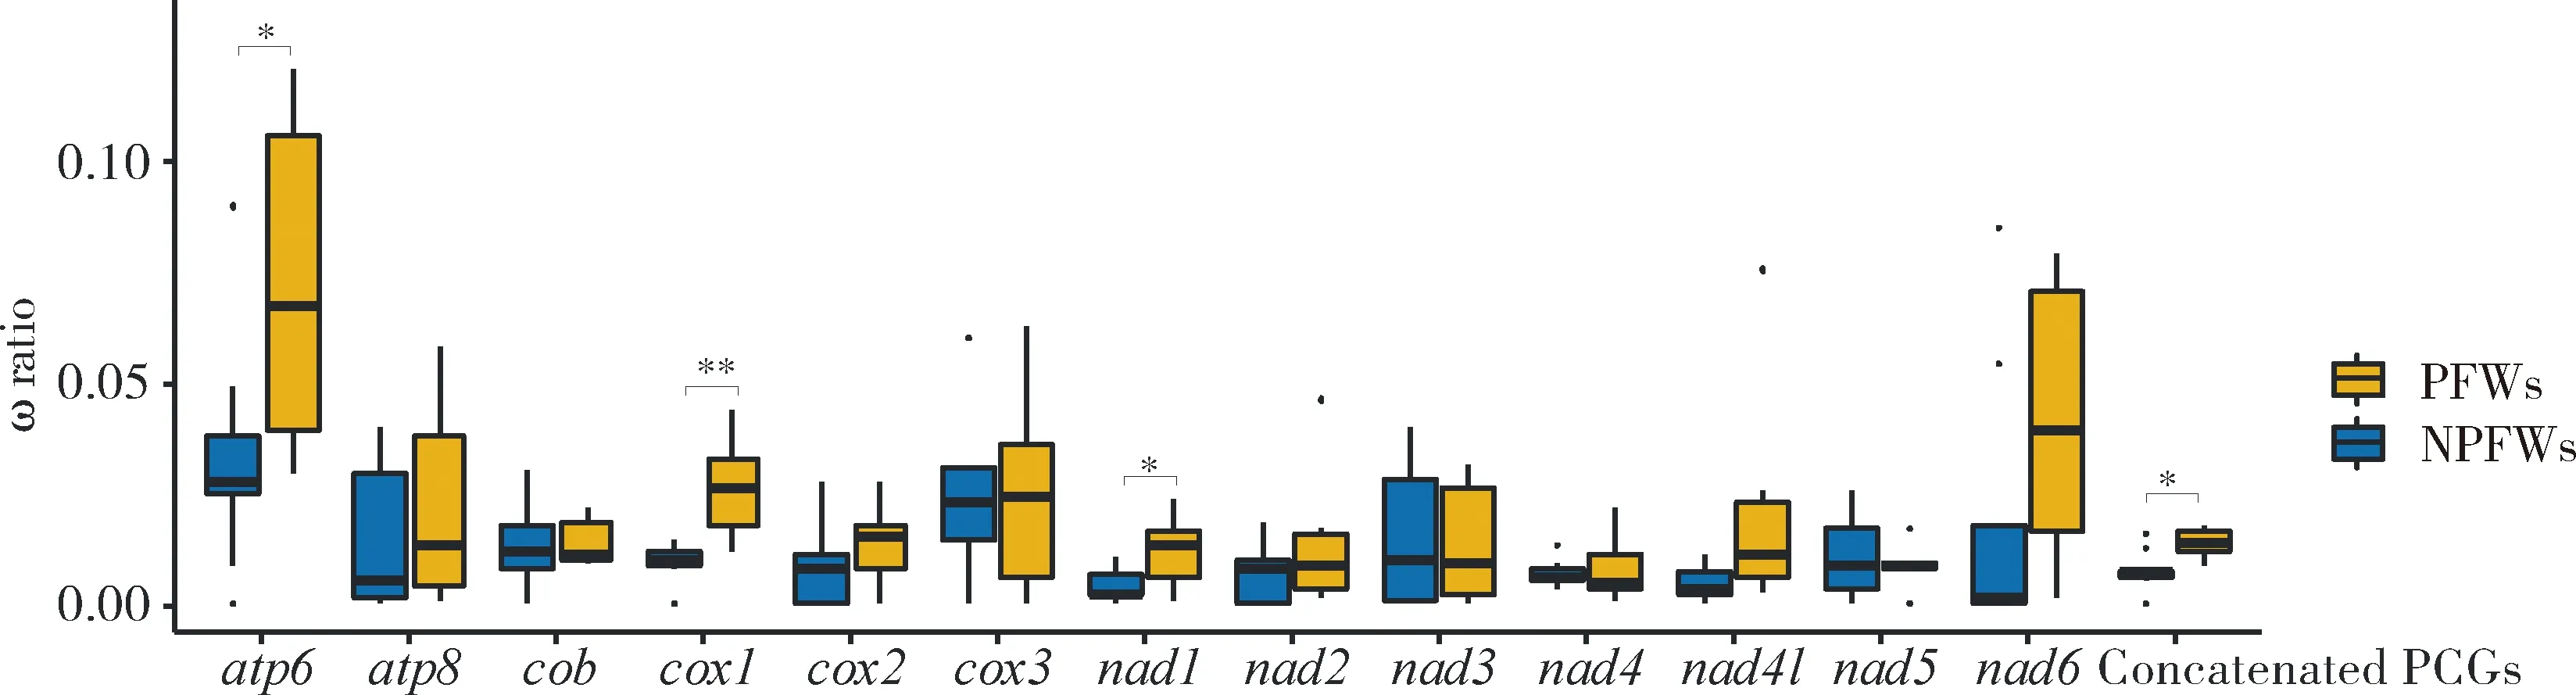
Fig. 3 Comparison of the ω ratios between pollinating fig wasps (PFWs) andnon-pollinating fig wasps (NPFWs) based on PCG sequencesConcatenated PCGs: Concatenated sequences of 13 mitochondrial PCGs. ·: Outliers. *P<0.05;**P<0.01 (Wilcoxon signed rank test). The same below.
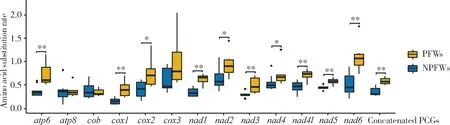
Fig. 4 Comparison of amino acid substitution rate between pollinating fig wasps (PFWs)and non-pollinating fig wasps (NPFWs) based on PCG sequencesAmino acid substitution rate is the number of substitutions for each amino acid site.
In this study, we compared the mitogenomes of 15 fig wasp species by newly sequencing the mitogenomes of 11 species. We detected several typical characteristics of the mitogenomes in fig wasps. There are two representatives to show the compositional bias of mitogenomes, non-strand specific (AT content and GC content) and strand specific, namely strand asymmetry (AT-skew and GC-skew). The mitogenomes of 11 fig wasps show strong base composition bias, with the AT content higher than 80% (Table 2), which is common in all fig wasp species (Xiaoetal., 2011, 2012). Actually, the high AT content is common in the mitogenomes of hymenopteran insects when compared with other orders (Oliveiraetal., 2008). The normal AT content for insects excluding Hymenoptera is in the range of 70%-78% (Chandraetal., 2006). Because the control region is missing for 11 fig wasps, the AT content for the complete mitogenomes might be higher. High AT content is also one of the main obstacles for the amplification, sequencing and alignment of mitogenomes (Burgeretal., 2007). For the most fig wasp species, the AT-skew is negative, while the GC-skew is positive (Table 2). Although there are many reasons that can cause the strand composition skew, most of the hypotheses suggest that the strand asymmetry is the result of selection pressures and mutations (Konoetal., 2018). The GC-skew value of insect mitogenomes seems to be related with replication orientation (Chenetal., 2016).
Although mitochondrial gene rearrangement was considered to be a type of rare-genomic change events (RGC) (Booreetal., 1998), there are dramatically frequent mitochondrial gene rearrangements in the fig wasp species. The mitochondrial gene rearrangements of Hymenoptera have previously been considered to occur mainly in the rearrangement of tRNA genes (Korkmazetal., 2017), and tRNA genes located in the junction region betweencox2 andatp8 were especially often considered as hotspots for rearrangement (Dowton and Austin, 1999). However, more special rearrangements involving more mitochondrial genes can be found in fig wasps. In addition tocox2 andatp8, a segment including at least five PCGs,cox1-trnL2-cox2-trnK-trnD-atp8-atp6-cox3, is detected to be reversed in most of the fig wasp mitogenomes, when compared with the ancestral gene order, and this inversion pattern also appears in other species of Chalcidoidea (Yanetal., 2019), indicating a common homologous synapomorphy of Chalcidoidea. In addition, in speciesP.tridentata, compared to the ancestral arrangement pattern, novel reversion events are also revealed in the segments including thecox2-trnK-trnD-atp8-atp6-cox3-trnGandtrnE-trnF-cox1-nad5-trnH-nad4-nad4l-trnT-trnP-nad6-cobgene clusters, which are reported for the first time in fig wasps. Besides, tRNA gene duplication is found in several fig wasp species. Although mitochondrial gene duplication is rare, it also exists in a few other insects (Kimetal., 2006; Kocheretal., 2014). At present, the most commonly accepted mechanism of mitochondrial gene rearrangement is the tandem duplication-random loss (TDRL) (Moritzetal., 1987). By comparing the mitochondrial gene orders of all Hymenopterans in NCBI, Zhuetal. (2018) found that in general, most species of the same genus usually tend to have the same gene arrangements. However, we found that closely related species in some subfamilies might share the same gene orders (Fig. 1), indicating that mitochondrial gene rearrangement might reflect phylogenetic relationship at a higher taxonomic level (at least at the subfamily level). But this rearrangement information is not very dependable. For example, the gene order ofA.bakeriandP.tridentataof Sycoryctinae is very different. In addition, the number of species used in our study is limited, so gene rearrangement as a molecular marker of phylogeny still has some limitations.
Among the 13 PCGs,nad6,nad2 andatp8 have the highest nucleotide diversity, showing that these three genes are more prone to accumulate mutations than other PCGs. That is to say, slightly deleterious mutations in these genes might be easier to be fixed; thus, these genes would be more likely to lose functions than the other PCGs. On the contrary,cox1 andcobare the most conservative among the 13 PCGs, indicating thatcox1 andcobhave more selection constraints, which might be a suitable barcoding marker for species identification (Haoetal., 2017). The above results also suggest that the cytochrome oxidase genes are more conservative than the NADH dehydrogenase subunit genes. But overall, natural selection analyses detected that the ω ratios for all the PCGs in 15 fig wasps are far less than 1 (Fig. 3), indicating that the mitochondrial PCGs of fig wasps have been subject to purifying selection and strong evolutionary constraints, as found in many insect studies (Zhangetal., 2019).
4.2 Comparison of mitogenomes between PFWs and NPFWs
To investigate whether the evolutionary patterns of mitogenomes are associated to the lifestyles of the fig wasps, we compared the evolution of mitogenome between PFWs (with six species included) and NPFWs (with nine species included). The results declared significant differences in mitochondrial evolution between PFWs and NPFWs, in the characteristics of gene arrangement and molecular evolution of the PCGs. First, the gene orders of mitogenomes of NPFWs are more similar to the ancestral order (Fig. 2), while there are more abundant events of gene rearrangements in PFWs. Second, in the evolution of the PCGs, genes of PFWs have higher nucleotide diversity than those of NPFWs, and the genes of PFWs have accumulated more non-synonymous mutations than those of NPFWs, consistent with previous studies (Strohmetal., 2015) and suggesting that PFWs have experienced more relaxed evolutionary constraints. In addition, considering from the protein sequences of the PCGs, PFWs also have higher amino acid substitution rates than NPFWs (Fig. 4). All of the above features illustrated that the evolution of mitogenomes of PFWs is faster than that of NPFWs, which might be related to their significantly different lifestyles and evolutionary histories of this two groups.
Considering from the lifestyles, the relationship between NPFWs and fig trees is parasitic, and the relationship between PFWs and fig trees is a typical mutualism. The PFWs present stronger host specificity than the NPFWs (Jousselinetal., 2008). According to the adaptive theory of genetic evolution (Orr, 2005), obligate symbionts inclined to have stronger adaptability to their specific hosts, compared with other parasitic species. Besides, the close relationship between fig trees and its specific symbiotic fig wasps might lead to more frequent adaptive selection and eventually lead to the increase of molecular evolution (Dowton and Austin, 1995). It has been found that in Hymenoptera primitively nonparasitic species still retain the ancestral mitochondrial gene order, while many parasitic species have changed mitochondrial gene arrangement, suggesting that the accelerated rate of gene rearrangement is related to the parasitic lifestyle (Dowton, 1999; Leetal., 2000). In addition, the parasitic lifestyle might increase the mutation rates of mitogenomes when comparing parasitic and nonparasitic species in Hymenoptera (Castroetal., 2002). Our study also shows that the difference of lifestyles in fig wasps may be associated with the evolution of mitogenomes. Furthermore, we suggest that in Hymenoptera different lifestyles lead to significant differences in the evolution of mitogenomes. Considering from the changes of lifestyles from nonparasitic to parasitic, and parasitic to symbiotic, we can see that host specificity is becoming stronger, and the evolution of mitogenomes is becoming faster.
Furthermore, the different evolutionary patterns of mitogenomes between PFWs and NPFWs may also be attributed to the different evolutionary histories between both lineages. It has been reported that the association of NPFWs with banyan trees is more recent than that of PFWs, and PFWs have a longer co-evolutionary history with fig trees (Petersetal., 2018). We thus suggest that in the longer co-evolutionary process with fig trees, the evolution of mitogenomes of PFWs have accumulated more events of gene arrangement and non-synonymous mutations, and higher nucleotide diversity and amino acid substitution rate in the PCGs.
At present, our data support the conclusion that the mitogenome evolution of PFWs is faster than that of NPFWs. However, there are still some limitations in our study, such as the PFWs and NPFWs in this study come from different host banyan trees. Therefore, in the future work, we will fully consider the close relationship between fig trees and fig wasps, and further study the differences of mitogenome evolution between PFWs and NPFWs from the same banyan species. Then we will expand the scope of research species to further verify the conclusions from our study.