Improved process monitoring using the CUSUM and EWMA-based multiscale PCA fault detection framework
2021-04-13MuhammadNawazAbdulhalimShahMauludHaslindaZabiriSyedAliAmmarTaqviAlaminIdris
Muhammad Nawaz,Abdulhalim Shah Maulud,2,*,Haslinda Zabiri,Syed Ali Ammar Taqvi,Alamin Idris
1 Department of Chemical Engineering,Universiti Teknologi PETRONAS,32610 Bandar Seri Iskandar,Perak,Malaysia
2 Centre of Contaminant Control &Utilization (CenCoU),Universiti Teknologi PETRONAS,32610 Bandar Seri Iskandar,Perak,Malaysia
3 Department of Chemical Engineering,NED University of Engineering &Technology,Karachi 75270,Pakistan
4 Department of Chemical and Engineering Sciences,Karlstad University,Karlstad,Sweden
Keywords: Chemical process system CSTR Fault detection Multiscale Principal component analysis Process monitoring
ABSTRACT Process monitoring techniques are of paramount importance in the chemical industry to improve both the product quality and plant safety.Small or incipient irregularities may lead to severe degradation in complex chemical processes,and the conventional process monitoring techniques cannot detect these irregularities.In this study to improve the performance of monitoring,an online multiscale fault detection approach is proposed by integrating multiscale principal component analysis (MSPCA) with cumulative sum (CUSUM) and exponentially weighted moving average (EWMA) control charts.The new Hotelling’s T2 and square prediction error (SPE) based fault detection indices are proposed to detect the incipient irregularities in the process data.The performance of the proposed fault detection methods was tested for simulated data obtained from the CSTR system and compared to that of conventional PCA and MSPCA based methods.The results demonstrate that the proposed EWMA based MSPCA fault detection method was successful in detecting the faults.Moreover,a comparative study shows that the SPEEWMA monitoring index exhibits a better performance with lower values of missed detections ranging from 0% to 0.80% and false alarms ranging from 0% to 21.20%.
1.Introduction
Process safety,sustainability,and product quality are essential concerns in modern chemical processes [1].Early fault detection is favorable for monitoring process continuity,reducing operating and maintenance costs,which in turn improves productivity[2,3].The complexities in modern process industries may increase an enormous number of process variables for optimization aspects.In complex processes,irregularities occur,which can lead to severe degradations,and thus the early detection of these irregularities is desirable [4–6].The detection of faults in modern industrial processes is of the utmost importance in ensuring reliability and safety and,maintain the quality of the product [7,8].An efficient and early fault detection system is needed to keep a safe and reliable process [9].
Fault detection and diagnostic approaches generally divided into two categories,including model-based and data-driven methods [3,10–13].In model-based methods,the process-measured variables obtained from the mathematical model based on the first principle approach under normal operating conditions(NOCs)[14–16].The quality of model-based monitoring methods depends on model accuracy [17].However,developing an accurate model for modern complex processes can be difficult and challenging.Furthermore,it is difficult to detect these faults which were not taken into account during the modeling stage.In data-driven monitoring methods,an empirical model has been developed by using the process data collected under NOCs.This model is then used to detect and diagnose irregularities present in the new process data[11].In these approaches,the explicit model is not necessary,and the information is directly extracted from input data which reduces the time and computation.The performance of these methods depends primarily on the availability of a sufficient amount of input/output data.Such approaches have been widely and successfully implemented in chemical processes and can be segmented into univariate and multivariate statistical process monitoring(SPM) methods [14].Cumulative sum (CUSUM) and exponentially weighted moving average(EWMA)charts are two basic univariate SPM methods for monitoring a single variable.Although these methods continue to dominate the process industry,their efficiency declines due to the use of highly correlated variables [14].
Multivariate SPM approaches are the most prominent datadriven techniques that have shown their potential and are being progressively used to monitor chemical processes [18–20].The key idea of the multivariate SPM methods consists of process features that may have been extracted via a certain multivariate analysis process.Thus,the highly dimensioned information is projected to a less dimensional space,followed by the evaluation of the statistics.Principal component analysis (PCA) [21–25]and partial least squares (PLS) [26,27]are the leading multivariate SPM techniques and commonly applied for the monitoring of chemical processes.Both methods succeed in implementing the monitoring but are limited by the assumption of a linear relationship among variables.The use of advanced distributed controllers and measurement systems increases the complexity of the chemical processes,and the variables involved in these processes are nonlinear in nature.As a result,the fault detection of these processes would lead to many missed diagnostics and non-reliable results[28,29].Consequently,to address these limitations,conventional multivariate SPM approaches have been substantially improved in recent years [30–35].
Multivariate SPM approaches and their extensions have been successfully used,their application is limited to examine only single-scale events[36].However,chemical processes are operated at different scales [37].The process data obtained from complex chemical processes contains a high level of noise,autocorrelation,and sometimes it might deviate from normality.Therefore,the performance of conventional monitoring techniques could be affected.Multiscale process monitoring methods are capable of addressing these issues,Bakshi [38],developed a multiscale PCA (MSPCA)framework by integrating wavelet transforms (WT) with PCA.In this framework,the selected wavelet family decomposed each variable individually,and the PCA model was applied at each scale to the coefficients to identify important events.The generalized likelihood ratio test (GLRT) is one of the most effective univariate SPM techniques,and it has been applied with PCA/PLS based multiscale process monitoring techniques [39,40].Furthermore,in recent years,various multivariate SPM extensions have been used to develop multiscale fault detection and diagnosis frameworks such as dynamic [41],multi-resolution [42],recursive [43],nonlinear [44]and orthogonal non-linear [45].
One of the most challenging tasks of monitoring processes is the detection of small or incipient irregularities in highly correlated multivariate process data.Indeed,early detection of these incipient irregularities can help in preventing significant damages and financial losses.Unfortunately,it is very difficult to detect incipient irregularities as they are too weak to be detected by the conventional multivariate SPM methods.Conventional monitoring indices such as T2and SPE charts sometimes insensitive to small process upsets.However,the univariate process monitoring methods such as CUSUM and EWMA charts can detect minor faults in the process mean.In previous studies,the conventional PCA was combined with univariate process monitoring charts to detect small and moderate faults[17,46,47].The key limitation of these studies is that the use of conventional PCA methodology which assumes that the chemical processes are operated on data collected at a single scale even though they are operated at different scales [37],In the current study,four fault scenarios are studied in which two are the sensor bias.The other two are the novel faults such as the change in heat transfer coefficient and the change in activation energy.
A fault detection framework is proposed by combing wavelet based MSPCA with univariate process monitoring control charts.Multiscale representations are an efficient tool for feature extraction at different scales.In this study,an online multiscale process monitoring framework is proposed by combining multiscale PCA with CUSUM and EWMA.New monitoring indices based on T2and squared prediction error (SPE) have been developed for fault detection that may improve the monitoring by reducing the rates of missed detections and false alarms associated with comparative monitoring methods.Section 2 introduces a detailed account of the theory,techniques and methods such as PCA,wavelet transform and univariate monitoring charts including CUSUM and EWMA.Section 3 provides the proposed CUSUM and EWMA based multiscale PCA fault detection framework.Section 4 illustrates a case study with four different fault scenarios.The outcomes of implementing the proposed fault detection methods to the CSTR system will be discussed in Section 5,followed by a conclusion,and it paves the way for future research Section 6.
2.Theoretical Background
2.1.Principal component analysis
PCA is a common multivariate SPM technique that reduces dimension to a minimum by holding most details,which converts the original set of variables into smaller variables.
Consider a data matrix X,with n number of variables and m number of observations.The data matrix is normalized to have zero mean and unit variance and is transferred into a new matrix by singular value decomposition (SVD):

where T and P are the principal components(PCs)and loading vectors and are formed by the eigenvectors associated with the covariance matrix of X.The covariance matrix can be determined as:

where Λ is the diagonal matrix representing the eigenvalues of the n PCs and Inis representing the identity matrix.
The robustness of the PCA model is based on the selection of the optimum number of PCs for its development.The appropriate number of PCs for the development of model can be determined by different techniques including cumulative percent variance(CPV)[48,49],cross-validation[50,51],scree plot and profile likelihood [52].The CPV based technique is employed in this study to choose the dominant PCs and can be computed as follows [48]:

where l represents the smallest set of PCs based on a certain percentage of the total variance.After the determination of the retained number of PCs,the input data matrix can be represented as [48]:


After developing the PCA model,the two monitoring indices T2and SPE are applied to find out the model and residual space variation,respectively.
The T2statistic can be computed as follows:

The T2threshold can be calculated as:

where Fl,m-l,αis the Fisher distribution,with l and(m-l)as the defined degrees of freedom,while the significance level is given by α.
The SPE is computed as follows:

where r represents the residual vector.The threshold for SPE is determined as:

2.2.Wavelet transforms
Wavelet transform (WT) is usually used in multiscale process monitoring for the decomposition of original process data into multiscale components.WT provides many advantages over conventional single-scale techniques characteristically,and it distinguishes the deterministic and stochastic features from the initial measurements of the process [53,54].This paves the way for a meaningful interpretation of the process phenomena in terms of their time and frequency bands [55].All basis functions ψa,b(λ)within WT are obtained from a mother wavelet ψ(λ)via dilation and translation processes:

where a and b are discretized scale and position parameters,respectively.The multiscale representation involves transmitting the signal at different scales through a low pass and high pass filter.The scaled version of the original signal is achieved by projecting it on an orthonormal basis function family represented as:

Approximation coefficient and detail coefficients of each level are obtained by using the signal projection on the various wavelet functions represented as:

The original signal is obtained by adding the final scaled signal and all detail signals and represented as:

where J and n are the level of decomposition and original signal length,respectively.
2.3.Univariate control charts
The brief introduction of univariate statistical process monitoring methods,such as CUSUM and EWMA,is here.
2.3.1.CUSUM control chart
CUSUM is the most effective univariate statistical process monitoring control chart and was proposed by Page in 1954,which can be used to detect small faults in the process data [14].CUSUM chart aggregates all the details from the past and the latest samples and the statistics can be computed as [14]:

2.3.2.EWMA control chart
EWMA is also a useful univariate statistical process monitoring chart,and it was developed by Roberts in 1959 [14].Like the CUSUM chart,This chart can also detect smaller faults shifts in the mean [56],and the statistic can be computed by [14]:

where λ is the smoothing parameter and its values is in between 0 and 1(0<λ ≤1)and this parameter regulates process memory.The upper and lower control limits for the EWMA chart can be determined as [14].

where L is the control width of the EWMA chart.While at the steady state,the factor [1-(1-λ)2i]simplifies to unity,then the UCL and LCL can be obtained as [14].

In the next section,both the CUSUM and EWMA charts are integrated with MSPCA to extend the advantages for the detection of an incipient fault in the process mean.
3.Combination of MSPCA Model with Univariate Control Charts
The primary objective of the proposed multiscale process monitoring framework is to develop an online process monitoring model for detecting incipient faults in highly correlated multivariate data.First,an online MSPCA framework has been developed that incorporates the advantages of WT and PCA model.In WT,a moving-window technique is used to dynamically extract the process signals by adding the step of sample time.It is followed by monitoring and predicting the next situation of the process.These steps are repeated for all the added steps of sample time,which would ease out the decisions of the management.In the end,new fault detection indices have developed based on conventional monitoring indices such as T2and SPE.The summary of proposed MSPCA-based fault detection framework is shown in Table 1,which is represented in Fig.1 and summarized as follows:
There are two steps involved in the proposed framework,first to develop the MSPCA model and then apply CUSUM and EWMA control charts for the detection of faults.In the MSPCA model,the PCA model is applied at the approximation and detail functions after wavelet decomposition and reconstruction step.In the MSPCA model,pre-filter the data using wavelet transforms and the development of T2and SPE monitoring indices are two independent tasks in this step.The second step of the framework involves CUSUM and EWMA control for the development of new monitoring indices based on T2and SPE.Multiscale process monitoring methods can provide significantly lower missed detection rates,along with comparable false alarm rates.Both CUSUM and EWMA are univariate SPM charts and used to detect incipient irregularities in the process mean.The combination of MSPCA and univariate control charts encourage the implementation for the detection of small or incipient faults in highly correlated process data.
Rates of fault detection,missed detection,and false alarm defined as probabilities are the detection performance criteria are used for the evaluation of the monitoring charts.Missed detection is an indication of undetected faulty samples,whereas false alarms denote the wrong fault observed in the fault-free region.The missed detection rate (MDR) is the number of faulty samples which are wrongly classified as normal and do not cross the control limits over the total number of faulty data samples.

The fault detection rate(FAR)is the number of normal samples that crosses the control limit over the total number of faultless data samples.

The performance of monitoring charts can be judged by the smaller values of rates of missed detection and false alarm.Multiscale fault detection frameworks are based only on the approximation coefficients of the last level.
4.Case Study– Continuous Stirred Tank Reactor System
Several researchers often use CSTR to evaluate the effectiveness of multiscale process monitoring techniques [39,45,57,58].Fig.2 illustrates the CSTR schematics with the cascade control system.Assuming a first-order irreversible exothermic reaction occurs in this system,in which reactant A enters the reactor,and product B flows out of the reactor:

The cooling liquid in the jacket removes the heat from the exothermic reaction.The liquid level and temperature in the reactor are controlled by the manipulation of the outlet flow and cooling fluid flow,respectively.The following equations represent the dynamic model of the CSTR system.


Table 1 Summary of MSPCA-based CUSUM and EWMA fault detection framework

Process variables involve in the CSTR system are listed in Table 2.Process data are generated by simulating CSTR with a period of one minute for normal and faulty operating conditions.Two thousand samples of fault-free process data were recorded with NOCs.Four fault scenarios were simulated and listed in Table 3.Among four fault scenarios,fault 1 and 2 are associated with the sensor bias in the initial concentration of the reactant(Ci)and temperature of feed stream (Ti) respectively.It was estimated that these faults would not affect other variables because they are introduced into individual variables.Fault 3 and 4 are associated with the process faults and are introduced into the heat transfer coefficient(E0/R)and catalyst activation energy(UAC),respectively.These two faults may affect more than one variable present in the system.The proposed multiscale fault detection frameworks are divided into two steps.In the first step,moving window-based wavelet decomposition and reconstruction of the individual variable with a window size of 50 samples are used to produce approximations and details coefficients.In the second step,fault detection frameworks are developed based on CUSUM and EWMA control charts.
5.Results and Discussion
The MSPCA-based CUSUM and EWMA frameworks are discussed in this section.Fault detection criteria based on MDR and FAR are used to assess the efficiency of the proposed frameworks.Only the highest approximation function is used for fault detection purpose in all four scenarios,while the detail functions are ignored as they contain noise.The light green-shaded area indicates the faulty region in the test data in all monitoring charts,while the horizontal red line shows the control limits.

Fig.1.MSPCA based on CUSUM and EWMA fault detection framework.
5.1.Scenario A– Step change fault

Fig.2.CSTR system with cascade control.
In this scenario,a bias fault introduced into the initial concentration of the reactant in feed stream (Ci) between sample 300–600.Figs.3–6 shows the monitoring results of PCA,MSPCA,MSPCA-CUSUM and MSPCA-EWMA.Fig.3(a) and (b) shows that,in case PCA based fault detection method,both monitoring charts have not detected this moderate fault.In the case of MSPCA based fault detection method as shown in Fig.4(a) and (b),there was no evidence of any fault presence on T2chart,whereas there was a distinct change that appears on the SPE chart around sample number 314.Furthermore,even after a fault has been detected on the SPE chart,the monitoring statistic values are still below the control limit in certain samples,while the fault persists.In the case ofMSPCA-CUSUM based fault detection method is shown in Fig.5(a)and(b).It can be seen that the monitoring statistics for T2-CUSUM and SPE-CUSUM exceed the control limits,which indicates the presence of some abnormal conditions.Both the monitoring charts gave several false alarms.Indeed,both charts tend to display anomalies for some time after conditions return to normal,leading to large numbers of false alarms.Monitoring results based on the MSPCA-EWMA fault detection method at λ=0.30 is shown in Fig.6(a) and (b),which indicates that there is no evidence of any fault presence on T2-EWMA chart.At the same time,the SPEEWMA chart identifies the fault correctly.The comparison of different monitoring charts clearly shows the superiority of the SPE-EWMA chart.
Table 2 CSTR system variables for process monitoring

Table 3 Simulated faults in CSTR system

Fig.3.Monitoring charts of PCA based fault detection with a 99% confidence limit.(a) T2 monitoring chart and (b) SPE monitoring chart.
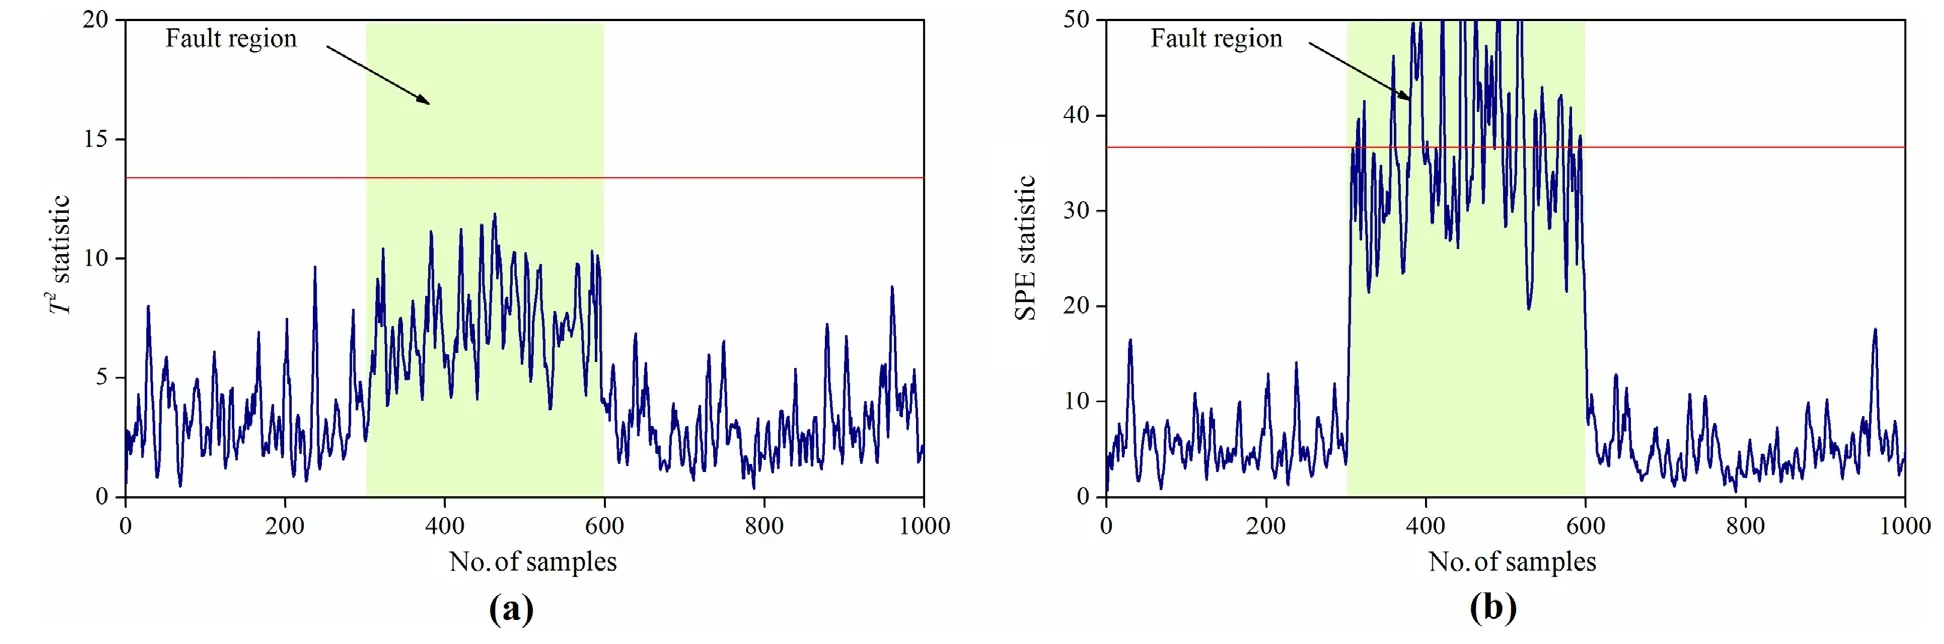
Fig.4.Monitoring charts of multiscale PCA based fault detection with a 99% confidence limit.(a) T2 monitoring chart and (b) SPE monitoring chart.
5.2.Scenario B– Ramp change fault
In this scenario,a slow drift fault is simulated by introducing a change to the feed stream temperature (Ti),from sample 700 to the end of the testing data.Figs.7–10 show the monitoring results of PCA,MSPCA,MSPCA-CUSUM and MSPCA-EWMA.Fig.7(a) and (b) shows that,in case of PCA based fault detection method,there is a distinct change that appears on T2and SPE charts around sample number 985 and 775 respectively.It is clear from the T2monitoring charts that most of the statistic values are below the control limit.In case of MSPCA based fault detection methods as shown in Fig.8(a) and (b),the monitoring statistic value crosses the control limits on T2and SPE monitoring charts around the sample numbers 975 and 725,respectively.In this case again like PCA based fault detection method,most of the statistic value did not cross the control limit on T2chart,whereas in case of SPE chart fault is detected earlier compared to a conventional PCA based method for about 70 samples.In case MSPCA-CUSUM based fault detection method as shown in Fig.9(a) and (b),an apparent change is observed on both monitoring charts,where on T2-CUSUM and SPE-CUSUM monitoring charts,the statistic values cross the control limits around sample numbers 750 and 720,respectively.The monitoring results of MSPCA-EWMA based fault detection method is shown in Fig.10(a) and (b).In T2-EWMA monitoring chart,a fault is observed around the 800th sample,and after the indication of fault,most of the samples fall below the control limit even though fault is present.Whereas on SPE-EWMA chart,100% fault detection is achieved where the 701st sample crosses the control limit.Consequently,the monitoring chart comparison reveals that the SPE-EWMA chart can provide an earlier and more apparent fault indication for this case.Although,other comparative fault detection methods indicate the presence of an abnormality,they are less reliable than the proposed method.

Fig.5.Monitoring charts of multiscale PCA-CUSUM based fault detection.(a) T2-CUSUM monitoring chart and (b) SPE-CUSUM monitoring chart.

Fig.6.Monitoring charts of multiscale PCA-EWMA based fault detection.(a) T2-EWMA monitoring chart and (b) SPE-EWMA monitoring chart.

Fig.7.Monitoring charts of PCA based fault detection with a 99% confidence limit.(a) T2 monitoring chart and (b) SPE monitoring chart.
5.3.Scenario C– Change in heat transfer coefficient

Fig.8.Monitoring charts of multiscale PCA based fault detection with a 99% confidence limit.(a) T2 monitoring chart and (b) SPE monitoring chart.
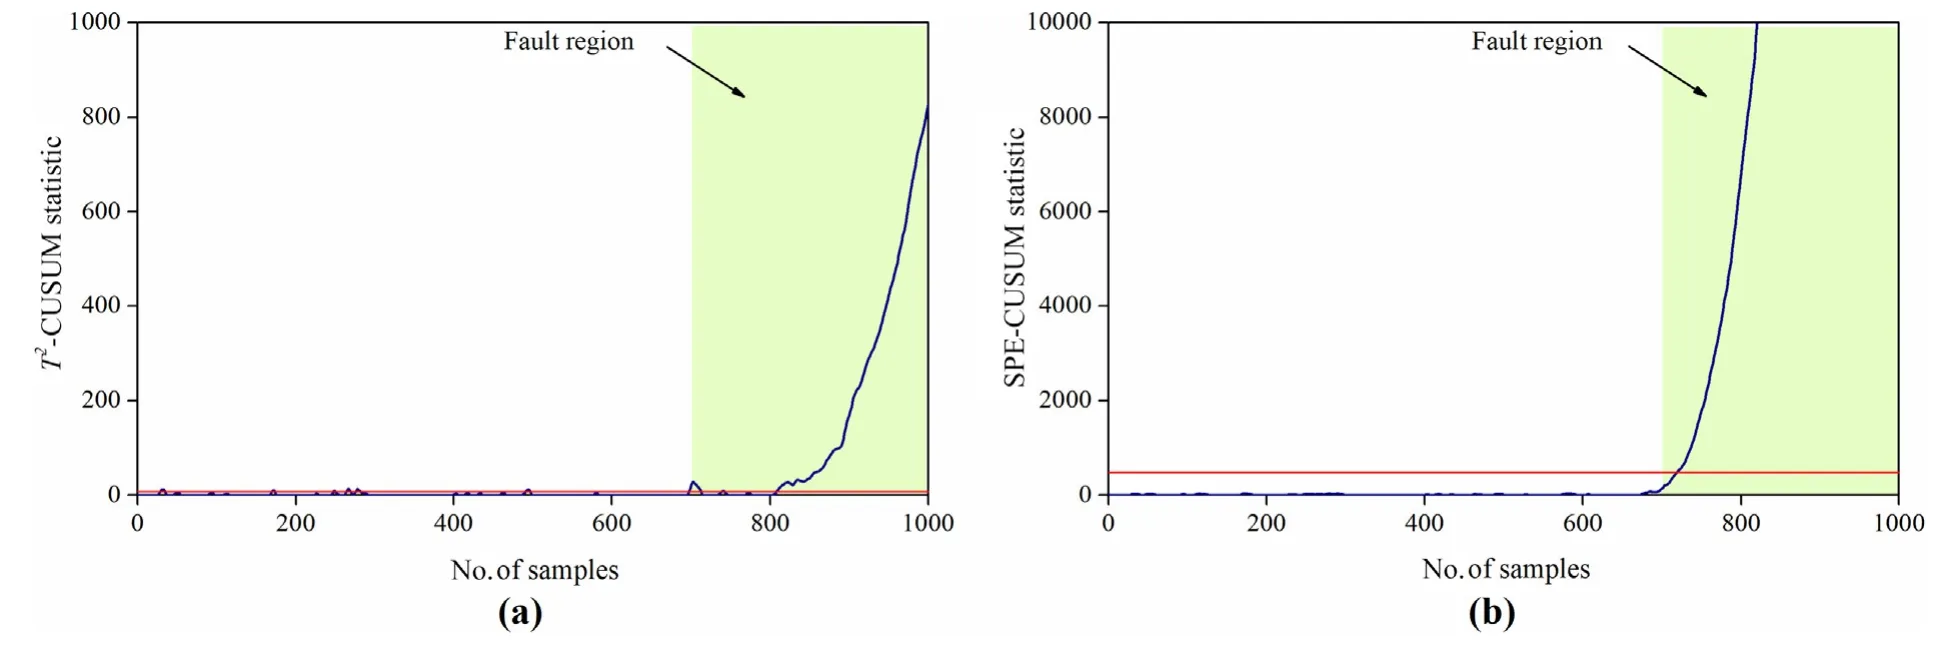
Fig.9.Monitoring charts of multiscale PCA-CUSUM based fault detection.(a) T2-CUSUM monitoring chart and (b) SPE-CUSUM monitoring chart.

Fig.10.Monitoring charts of multiscale PCA-EWMA based fault detection.(a) T2-EWMA monitoring chart and (b) SPE-EWMA monitoring chart.
In this scenario,a fault is simulated by introducing a step change to the heat transfer coefficient (E0/R),from sample 250 to 500.The reactor temperature and outlet concentration can be the major responding variables due to this fault.The monitoring results of the proposed fault detection frameworks and other comparative methods are shown in Figs.11–14.It can be seen from Fig.11(a)and(b),both monitoring chats of PCA based method have not shown any indication of fault presence.Whereas T2control chart of the MSPCA based method detected the fault around sample number 275,but almost all monitoring statistic values remain under the control limit even though the fault is present as shown in Fig.12(a).The SPE chart did not show any indication of fault present in the same case,as shown in Fig.12(b).In case of the MSPCACUSUM fault detection method as shown in Fig.13(a)and(b),both monitoring charts shows 100%FDR but,in this case,a huge number of missed detections reduced the efficiency of this method.In the case of MSPCA-EWMA based fault detection method,the monitoring results are shown in Fig.14(a) and (b).In T2-EWMA chart,a fault is observed around sample number 271,but most of the sample remains under the control limit even though the fault s present.Whereas on SPE-EWMA chart,100% fault detection is achieved where the 251st sample crosses the control limit.Consequently,the monitoring chart comparison reveals that the SPE-EWMA chart can provide an earlier and more apparent fault indication for this case.Although,in comparison with MSPCA-CUSUM fault detection method,both monitoring charts detected the fault,there were a lot of missed detections in this case which reduced its efficiency and the readability of this method.
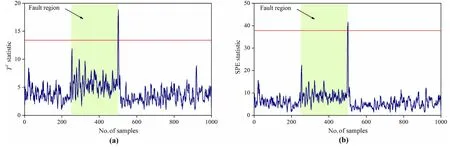
Fig.11.Monitoring charts of PCA based fault detection with a 99% confidence limit.(a) T2 monitoring chart and (b) SPE monitoring chart.

Fig.12.Monitoring charts of multiscale PCA based fault detection with a 99% confidence limit.(a) T2 monitoring chart and (b) SPE monitoring chart.

Fig.13.Monitoring charts of multiscale PCA-CUSUM based fault detection.(a) T2-CUSUM monitoring chart and (b) SPE-CUSUM monitoring chart.
5.4.Scenario D– Change in activation energy
A fault is simulated by adding a step change to the activation energy,from sample 250 to 500.There is more than one variable which is affected due to the change in the activation of energy.The fault detection results of the proposed framework and other comparative methods are shown in Figs.15–18.It can be seen from Fig.15(a),and (b),similar to other cases,both monitoring chats of PCA based method,have not shown any indication of fault presence.Whereas T2control chart of the MSPCA based method did not detect the fault as shown in Fig.16(a)and(b).In the same case,the SPE chart indicates fault presence around sample number 265,and after the detection fault,most of the monitoring statistics remain under the control limit.The T2-CUSUM and SPE-CUSUM charts of the MSPCA-CUSUM fault detection method shows 100%fault detection rates,as shown in Fig.17(a) and (b).But,in this case,the presence of a huge number of false alarms reduced the efficiency of this method.Fig.18(a) and (b) shows the monitoring results of MSPCA-EWMA based fault detection method.In T2-EWMA chart of this monitoring method,a fault is observed around sample number 311,and beyond this,only a few samples crossed the control limit despite the presence of the fault.Whereas on SPEEWMA chart,100% fault detection is achieved where the 251st sample crossed the control limit.Consequently,the monitoring chart comparison reveals that similar to other cases,the SPEEWMA chart can provide an earlier and more apparent fault indication.Although,both indices show 100% FDR as compared with MSPCA-CUSUM fault detection method,where,but there were a lot of false alarms in this case to reduce its efficiency,which decreases the readability of this method.

Fig.14.Monitoring charts of multiscale PCA-EWMA based fault detection.(a) T2-EWMA monitoring chart and (b) SPE-EWMA monitoring chart.

Fig.15.Monitoring charts of PCA based fault detection with a 99% confidence limit.(a) T2 monitoring chart and (b) SPE monitoring chart.
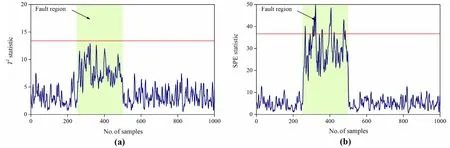
Fig.16.Monitoring charts of multiscale PCA based fault detection with a 99% confidence limit.(a) T2 monitoring chart and (b) SPE monitoring chart.

Fig.17.Monitoring charts of multiscale PCA-CUSUM based fault detection.(a) T2-CUSUM monitoring chart and (b) SPE-CUSUM monitoring chart.
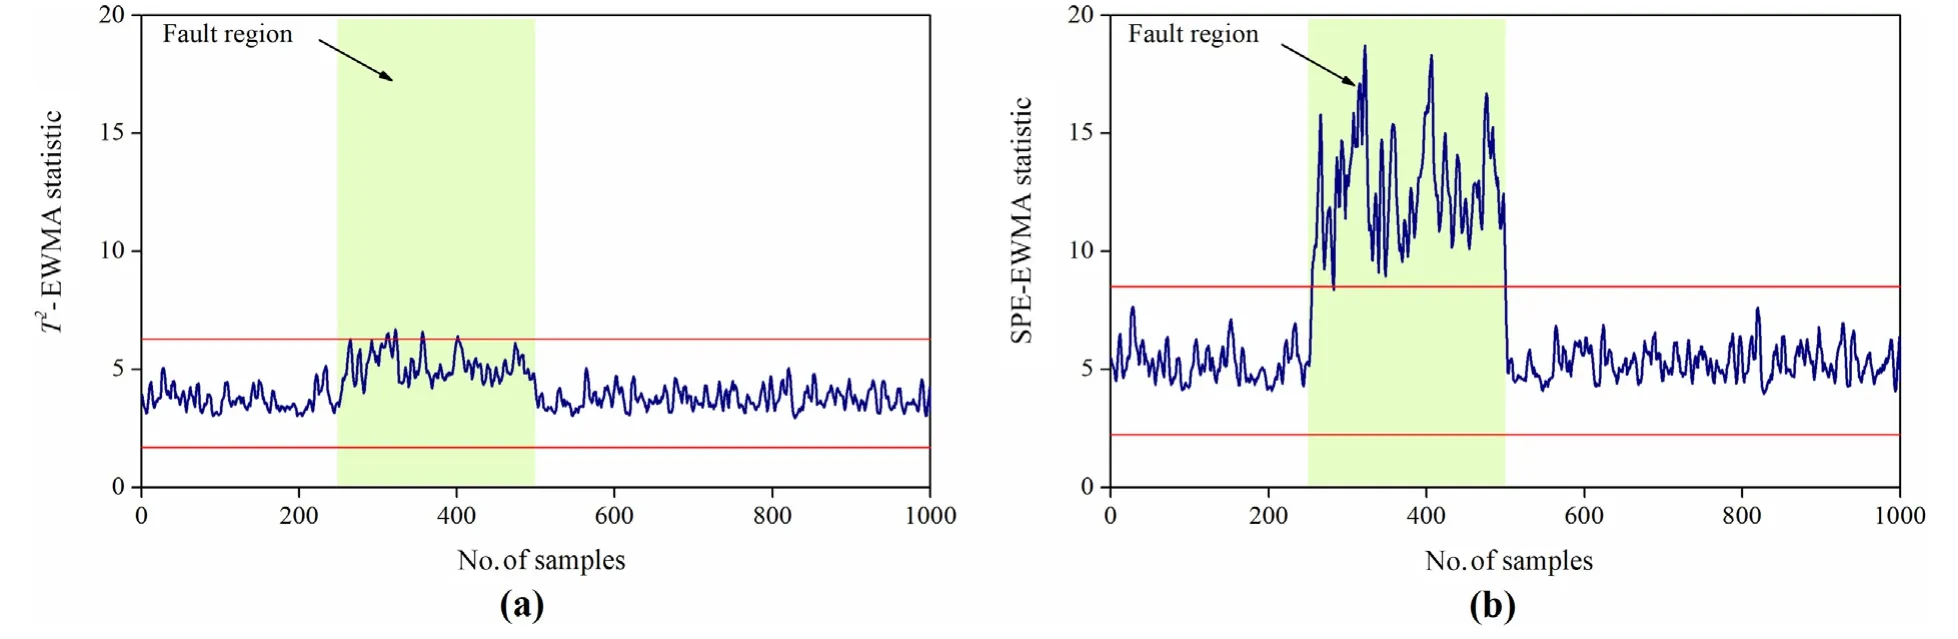
Fig.18.Monitoring charts of multiscale PCA-EWMA based fault detection.(a) T2-EWMA monitoring chart and (b) SPE-EWMA monitoring chart.

Table 4 Rates of missed detection and false alarm for all monitoring charts obtained from proposed frameworks and other comparative methods
The performances of the proposed fault detection frameworks and other comparative methods are summarized in Table 4.From the table,it is clear that both monitoring charts for PCA based fault detection method show 100% MDR for scenarios A,C and D.However,in scenario B,where ramp change fault is introduced,the MDR for T2and SPE monitoring charts was 96%and 32.67%respectively.In the case of MSPCA based fault detection method,the MDR values were found to be more than 90%on T2monitoring charts for all cases,whereas MDR value on the SPE monitoring chart was 9.33% for scenario B which was better than other scenarios.On the other hand,both the monitoring charts for MSPCA-CUSUM based fault detection methods show a better performance in term of MDR but higher values of FAR decrease the efficiency of this method.Table 4 shows that the CUSUM chart detects small process data faults effectively.Nevertheless,large memories of the CUSUM chart raise the potential for false alarms as additional measures are taken by the CUSUM statistics to return to the fault-free steadystate values.In the case of MSPCA-EWMA fault detection method,the MDR values for T2-EWMA monitoring chart were more than 80%for all cases.In contrast,SPE-EWMA monitoring chart provides better detection performances as compared to other methods.From Table 4,it can be observed that the MDR and FAR values for this monitoring chart are less than the other comparative methods.
The fault detection of the above simulated fault patterns shows that the proposed techniques,such as MSPCA-CUSUM and MSPCA-EWMA,can effectively detect incipient faults.Performance of both techniques on the basis of two fault detection criteria,including missed detection rates and false alarms.Both proposed techniques show a better performance in terms of MDR.However,higher values FAR in the MSPCA-CUSUM technique reduce its efficiency.Therefore,the comparison of the two techniques concluded that the MSPCA-EWMA demonstrated better results in the detection of incipient faults.Therefore,it could appear that the MAPCA-CUSUM is not suitable for monitoring the CSTR.
6.Conclusions
Fault detection in complex chemical processes is essential which has severe impacts on process safety,sustainability,and product quality.In this study,univariate monitoring charts such as CUSUM and EWMA are integrated with MSPCA based monitoring statistics.The effectiveness of the proposed monitoring statistics T2-CUSUM,SPE-CUSUM,T2-EWMA,and SPE-EWMA demonstrated by using the simulated process data obtained from the CSTR system.Results show that SPE-EWMA monitoring statistics effectively detected all types of faults.The values of MDR ranging from 0%to 21.20% and FAR ranging from 0%to 0.53% for this monitoring statistic is less than the other comparative detection methods,which indicate the efficiency of this monitoring statistic.In this paper,the proposed framework is established with linear PCA during the modeling process to detect faults in the chemical process system.However,most chemical processes are non-linear and may have certain dynamic characteristics.Therefore,in future research,we intend to build a non-linear multiscale method for detecting faults and expand the benefits of the proposed monitoring statistics to tackle the non-linearities present in process data.
Acknowledgements
The authors would like to acknowledge the Universiti Teknologi PETRONAS (UTP),Chemical Engineering Department for the technical and administrative support and the financial support from the Yayasan UTP grant (Cost centre:015LC0-132).
Nomenclature
A cross-section area of the reactor,m2
C concentration of reactant A in the reactor,mol·L-1
Ciinitial concentration of reactant A in feed stream,mol·L-1
Cpheat capacity of reactant A,J·K-1·kg-1
Cpcheat capacity of cooling liquid,J·K-1·kg-1
EA/R activation energy,K
F flowrate of outlet stream,L·min-1
Fcflowrate of cooling liquid,L·min-1
Fiflowrate of feed stream,L·min-1
H liquid level in the reactor,m
kopre-exponential factor,min-1
T temperature in the reactor,K
Tccooling liquid temperature in cooling jacket,K
Tcicooling liquid temperature,K
Titemperature of feed stream,K
UAcheat transfer coefficient,J·min-1·K-1
Vcvolume of the cooling jacket,L
ΔH heat of reaction,J·mol-1
ρ density of the reactant A,kg·L-1
ρcdensity of the cooling liquid,kg·L-1
杂志排行

Chinese Journal of Chemical Engineering的其它文章
- Highly interconnected macroporous MBG/PLGA scaffolds with enhanced mechanical and biological properties via green foaming strategy
- Perspectives and challenges of hydrogen storage in solid-state hydrides
- Wet flue gas desulfurization performance of 330 MW coal-fired power unit based on computational fluid dynamics region identification of flow pattern and transfer process
- EMMS-based modeling of gas–solid generalized fluidization:Towards a unified phase diagram
- Using expansion units to improve CO2 absorption for natural gas purification-A study on the hydrodynamics and mass transfer
- Simulation and experimental study on the surface morphology and energy lost of the target material under non-overlapping impact of angular particles