Detailed structural,mechanical,and electronic study of five structures for CaF2 under high pressure∗
2021-03-19YingGuo郭颖YumengFang方钰萌andJunLi李俊
Ying Guo(郭颖), Yumeng Fang(方钰萌), and Jun Li(李俊)
1Jiangsu Collaborative Innovation Center of Atmospheric Environment and Equipment Technology,Jiangsu Key Laboratory of Big Data Analysis Technology,Nanjing University of Information Science and Technology,Nanjing 210044,China
2Mingde New Material Technology Co.,LTD,Anji 313300,China
Keywords: density functional theory(DFT),high-pressure,phase transition,coexistence
1. Introduction
With the development of ultraviolet lithography technology, the calcium fluoride (CaF2) generally becomes the focus in the semiconductor industry with its high transmittance and low absorption coefficient.[1,2]For the high laserinduced damage threshold and high transparency up to the vacuum ultra-violet (UV) area, CaF2can replace fused silica and has many valuable optical properties for industrial applications.[3-6]For example, it has been designated as the lens material for photolithography at wavelengths in the deep ultraviolet region.[6,7]These optical properties are due to its well-known face-centered cubic(FCC)ionic crystal structural and electronic properties,such as a very large band gap.[8-12]Besides, CaF2has shown an excellent internal pressure calibration in moderate high-pressure and high-temperature x-ray diffraction experiments.[13-16]Recently, the electrical transport properties of CaF2nanocrystals have been investigated by in situ impedance measurement up to 30 GPa.[17]Thus,the behaviors of its elastic properties under the influence of high pressure have attracted much attentions.[18-30]
At the pressure of 0 GPa, CaF2shows the cubic fluorite structure with the space group of Fm-3m. In 1966,Seifert found that CaF2can transform into a PbCl2-type structure with the space group of Pnma under pressure 8 GPa-10 GPa.[18]Then this result was confirmed experimentally by powder diffraction in 1969.[19]Afterward, in the year of 1992,Gerward obtained the exact transition pressure of about 9.5 GPa by synchrotron radiation,[20]and the high-pressure phase is stable up to 45 GPa at 300 K. In 2002, Speziale found that transition pressure is at 8.6 GPa and 1100 K and the high-pressure phase of CaF2is stable up to 49 GPa at room temperature.[21,22]Then,in 2005,the phase transition in ideal hydrostatic pressure and room temperature is 8.01 GPa.[23]More importantly, Dorfman reported that CaF2transforms from PbCl2-type structure to Ni2In-type structure with the space group of P63/mmc by angled-dispersive x-ray diffraction experiments at the pressure range of 63 GPa-79 GPa in 2010.[24]Other report[25]showed some different results that the pressure-induced Fm3m-Pnma phase transition starts at 14.0 GPa and the orthorhombic phase is stable up to 46.5 GPa.In theories,most of the transition pressures in the first Fm3m-Pnma phase transition are consistent with others,[26-29]but the ones in the second Pnma-P63/mmc phase transition are quite different. For example, Wu reported firstly the second phase transition of CaF2from PbCl2-type structure to Ni2Intype structure occurs at 68 GPa-72 GPa by full-potential linearized augmented plane wave(FP-LAPW)method.[26]However, other reports predicted that the Pnma-P63/mmc phase transition pressures of CaF2are 278 GPa,[28]105 GPa,[29]and 80 GPa,[30]respectively. Up to date, there is no unified conclusion on the changes that occurs near the second-order phase transition of CaF2.
In this work, in order to study the performance of CaF2under high pressure as accurately as possible, five potential phase transition structures are researched by periodic DFT calculations with two different exchange correlations, and the structural,mechanical,thermodynamic,and electronic properties in crystal CaF2under hydrostatic pressure 0 GPa-150 GPa are all studied.
2. Computational details
According to the literature mentioned above, five different candidate phases of CaF2, fluorite structure (Fm-3m,No. 225), tetragonal structure (P4/mmm, No. 123), Ni2Intype structure (P63/mmc, No. 193), orthorhombic structure(Pmc21, No. 26), and PbCl2-type structure (Pnma, No. 62),are taken into consideration. We use experimental data as the initial models of these phases.The Cambridge Serial Total Energy Package(CASTEP)[31,32]is used in all of our calculations and the plane-wave OTFG ultrasoft pseudopotentials[33,34]within the density functional theory are employed to describe the interaction between electrons and ions. In recent years,much theoretical works focused on phase transition under high pressure were done by CASTEP.[35-38]Moreover,the thermodynamic properties of CaF2were calculated with an approximation method on the quasi-harmonic Debye model.[39]In order to get more accurate theoretical results, two different forms of exchange-correlation (XC) energy are treated: one is generalized gradient approximation(GGA)in the Perdew-Burke-Ernzerhof(PBE)[40]functional form,and the other one is local spin density approximation(LDA)proposed by Ceperley and Alder[41]and parametrized by Perdew and Zunder[42](CA-PZ). Besides, in the self-consistent field calculation, the density-mixing minimization method[43]and the Broyden,Fletcher,Goldfarb,and Shannon(BFGS)[44]method are used to obtain the electronic wave functions and to get the relaxed structures. After a series of convergence tests, for Fm-3m,P4/mmm, P63/mmc, Pmc21, and Pnma structures of CaF2,we utilized the 21 × 21 × 21, 14 × 10 × 14, 21 × 21× 15,19 × 16 × 11, and 11 × 18 × 9 k-points grids for the irreducible Brillouin zone, respectively, and the cutoff energy for five structures is set as 650 eV. The k-points and cutoff settings above ensured the band gap changed by less than 0.01 eV,so the adequate accuracy can be guaranteed. The geometry relaxation is performed by self-consistent calculations to allow the space group, cell shape, and volume to change.The total energy of the system, residual force, residual bulk stress, and displacements of atoms are converged less than 5.0×10⁻⁶eV/atom, 0.01 eV/˚A, 0.02 GPa, and 5.0×10⁻⁴˚A,respectively.
3. Result and discussion
3.1. Structural phase stability and pressure influences
It is well known that CaF2undergoes a second-order phase transition procedure,as fluorite structure →PbCl2-type structure →Ni2In-type structure with increasing equivalent hydrostatic pressure. In this part, to investigate phase stability and phase transitions in detail, all five possible structures(Fm-3m, P4/mmm, P63/mmc, Pmc21, and Pnma structures)of CaF2reported in other literature[45]were selected,and fully optimized by both GGA-PBE and LDA-CAPZ at 0 GPa as the first step. In this step, the experiments data at ambient pressure and temperature were used as input structure, and all of the ionic configurations,cell shape,and volume were allowed to change in the calculations of structural optimization. The optimized lattice parameters of five structures are listed in Table 1.

Table 1. Experimental and calculated lattice constants of CaF2 at ambient conditions.
Overall,our results are very close to the experimental data and other calculated results,which shows the reliability of our calculation parameters. It can be seen that the results calculated with XC of GGA-PBE are slightly larger than that of LDA-CAPZ,which is caused by the effect that GGA tends to underestimate the binding energies while LDA tends to overestimate that one.
Then, to investigate the stability of CaF2under 0 GPa,we calculated and compared the relationship between volume and total energy of the five structures. Figure 1 shows the results calculated with GGA. The curves from the bottom represent the relationships of volume and total energy in fluorite structure, PbCl2-type structure, Pmc21structure, Ni2In-type structure, and P4/mmm structure, respectively. It means that the stable order of five structures of CaF2at 0 GPa is fluorite>PbCl2-type >Pmc21>Ni2In-type >P4/mmm, and the fluorite structure of CaF2is the most stable one. This result is consistent with the experimental data and other theoretical results.[18-30]

Fig.1. Calculated energy versus volume per formula unit for five structures of CaF2 at 0 GPa.
Next, to investigate the phase transitions among our selected five structures,we used the optimized structures as the input structures and calculated the Gibbs free energy G of their primitive cell. Generally,the Gibbs free energy G is[47]

where E,P,V,T,and S are the internal energy,pressure,volume,temperature,and vibrational entropy,respectively. Since the theoretical calculations were set at T =0 K,the Gibbs free energy G becomes equal to the enthalpy H
Therefore,we can get the most stable structure under one pressure by comparing the enthalpy value of different structures under that pressure. Here, we calculated the enthalpy of five different structures from 0 GPa to 150 GPa and obtained the variations curves of the enthalpy difference between fluorite structure and other four structures versus the pressure of CaF2by both GGA and LDA, which is shown in Fig.2. Under one certain pressure, the enthalpy difference of a structure is greater than 0 indicating that the enthalpy value of this structure is greater than that of fluorite structure. So it can be seen that at lower pressure,the one with the lowest enthalpy is fluorite structure,and then PbCl2-type and Ni2In-type structures are more stable at higher pressure. As a result,the curves imply that the fluorite phase →PbCl2-type phase →Ni2In-type phase transition in CaF2occurs at PGGA1=8.0 GPa,PGGA2=111.4 GPa by using the XC of GGA, and PLDA1=4.5 GPa,PLDA2=101.7 GPa by LDA,respectively. These results show that the fluorite phase is the most stable structure when the pressure is below 8.0 GPa (GGA) and 4.5 GPa (LDA). Similarly, the enthalpy of Ni2In-type structure becomes the lowest with the pressure larger than 111.4 GPa and 101.7 GPa calculated by GGA and LDA, respectively, which indicates that Ni2In-type structure is the most stable one in the corresponding pressure ranges. Besides, the value of enthalpy in P4/mmm and Pmc21structures are always larger than the most stable structures from 0 GPa to 150 GPa,showing the instability of these two phases. Moreover,it can be seen that the enthalpy differences between PbCl2-type and Ni2In-type phases in one molecular formula become very small at the pressure of about 100 GPa, which indicate the possibility of coexistence of two-phase at high pressures.
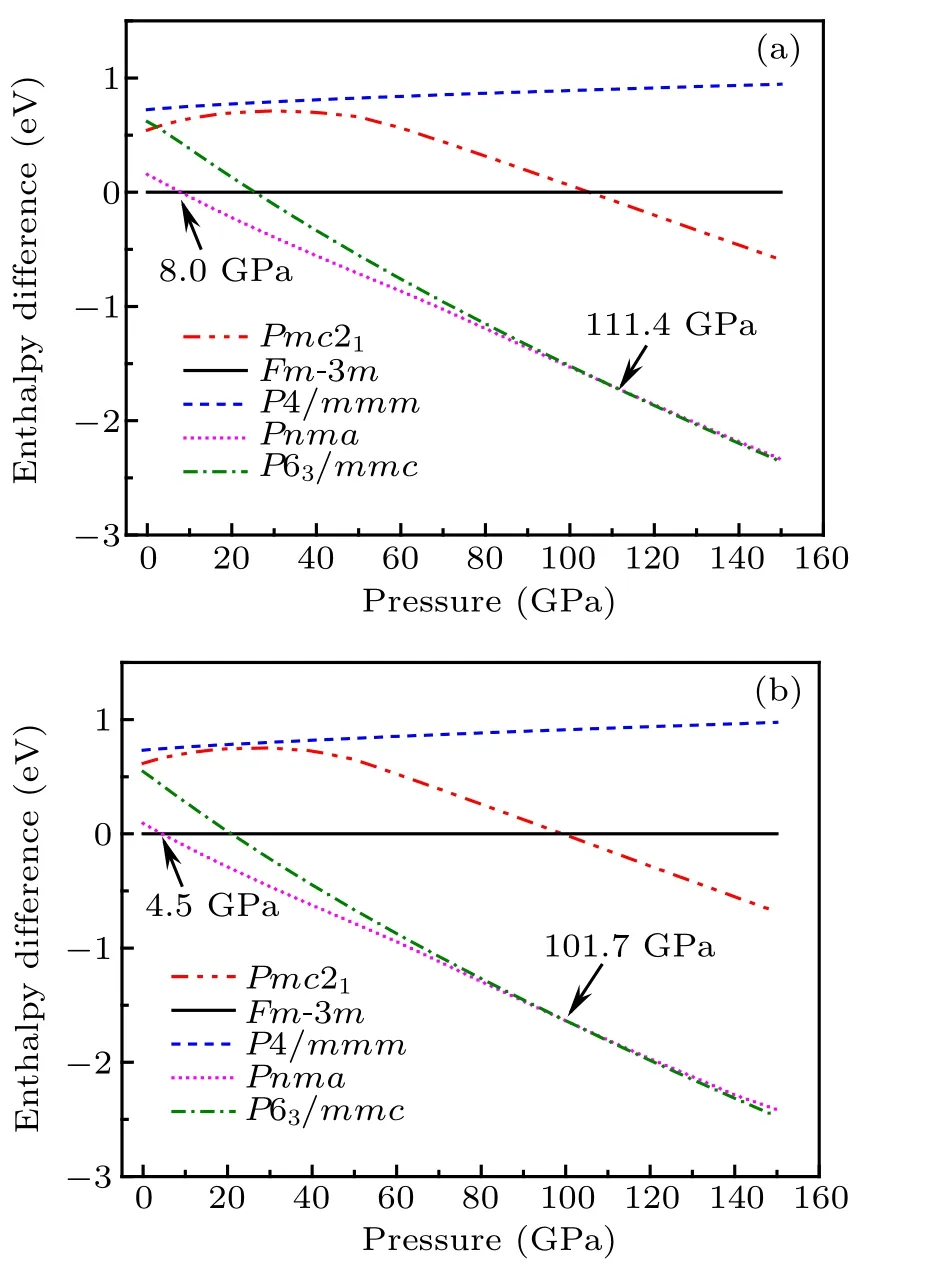
Fig.2. Enthalpy difference between fluorite structure and other four structures as a function of pressure by(a)GGA-PBE and(b)LDA-CAPZ.
The comparisons of the transition pressures between our theoretical values and previous results are shown in Table 2.As we can see that the present result calculated with GGA(8.0 GPa) for fluorite →PbCl2-type phase transition agrees well with the experimental and other theoretical transition pressure (4.7 GPa-14 GPa). As for PbCl2-type →Ni2Intype phase transition,our results with both GGA and LDA are within other theoretical and experimental data range(68 GPa-278 GPa). We argue that the coexistence of PbCl2-type and Ni2In-type phases may be the reason why the transition pressure of the second phase transition in other reports is so huge.It is worth mentioning that the transition pressure calculated with LDA is smaller than that with GGA,which may be caused by the overestimate of the binding energy of LDA. We know that the distances between Ca2+and F−ions will close to each other with increasing pressure,and higher binding energy can accelerate the process and promote the structural transition at lower pressure.
In both PbCl2-type and Ni2In-type phase,every Ca atom has three F atoms in its nearest neighbor,and the three F atoms form a triangle with Ca atom in the middle.For example,at the pressure of phase transition(111.4 GPa),the nearest distance of Ca-F in PbCl2-type phase is about 2.03 ˚A-2.04 ˚A,and the distance in Ni2In-type phase is about 2.01 ˚A.Besides,the volumes of PbCl2-type and Ni2In-type phase are quite the same when the pressure is larger than about 100 GPa. These similarities in structure may cause the two phases to have similar energies under high pressure.

Table 2. The structural transition pressures from our results and other experimental and calculated data.
In order to clarify the pressure influences on the volume of CaF2,the changes of relative volume as a function of pressure are calculated by both GGA and LDA, and the curves are shown in Fig.3. Generally, the volume is compressed by increasing pressure smoothly. However,at the transition pressure of fluorite to phase, the ratio of volume V/V0in CaF2changes suddenly and decreases 7.37%-8.46%,while that ratio decrease only 0.34%-0.39% at transition pressure of the PbCl2-type to Ni2In-type structure.In other words,the volume has hardly changed while the structural transition occurs between PbCl2-type and Ni2In-type phases, which is consistent with the approximately equal enthalpy of them at transition pressure, suggesting the possibility of coexistence in PbCl2-type and Ni2In-type structures.

Fig.3. Relative volume (V/V0) as a function of pressure calculated by (a)GGA-PBE and(b)LDA-CAPZ,the inserted picture emphasizing that value from 90 GPa to 130 GPa.
In order to further investigate the pressure influences on CaF2and the phase transition, figure 4 shows the variations in the compression ratio of a,b,and c axes in the PbCl2-type structure with increasing pressure calculated by GGA-PBE.Generally, the compression ratios for three lattice constants a/a0,b/b0,and c/c0are quite different(the“0”subscript denotes the value under the pressure of 0 GPa), indicating the compressible crystal of CaF2has anisotropy. Before 40 GPa,the total compressions along the a and b directions are almost the same, and smaller than that along the c direction, which means that the c axis is much stiffer than the a and b axas in the pressure range of 0 GPa-40 GPa. However,from 40 GPa to 60 GPa, the ratios of a/a0and c/c0continue to decrease,while the ratio of b/b0has only slight changes.Then,the compression ratio along the a direction drops quickly from 0.85 at 60 GPa to 0.77 at 80 GPa, but the ratio along the b direction at this pressure range increases from 0.90 to 0.92. Then,when the pressure is larger than 80 GPa, the ratios a/a0and c/c0decrease smoothly while b/b0has almost no changes. It can be understood as: at the pressure range of 60 GPa-150 GPa,the interactions between atoms is mainly concentrated in y-z plane(namely,the(1 0 0)plane),therefore,direction x(lattice parameter a)is comparatively easier to be compressed than y and z(lattice parameters b and c).

Fig.4. Calculated crystal constants versus pressures for PbCl2-type CaF2 by GGA.
3.2. Mechanical and thermodynamic properties
As is known,mechanical properties can be used to certify the phase stability of the crystal at different pressures,and the elastic parameters are important indicators for analyzing mechanical properties.[50]However, researches focused on mechanical properties with increasing pressure of CaF2are rare in other literatures. In this part,elastic properties and mechanical moduli of five structures in CaF2under pressures from 0 GPa to 150 GPa are calculated with both GGA-PBE and LDA-CAPZ.Generally,the elastic constants Cijklwith respect to the finite strain variables are defined as[51-53]

where σijand eklare the applied stress and Eulerian strain tensors, and χ and X are the coordinates. Although there are 21 independent components of the fourth-rank tensor C, the number will be greatly reduced with the introduction of symmetry. Taking CaF2for example, there are nine independent elastic constants in Pmc21and PbCl2-type phases: C11, C22,C33,C12,C13,C23,C44,C55,C66, and the number of independent elastic constants in P4/mmm and Ni2In-type phases is reduced to six: C11=C22, C33, C12, C13=C23, C44=C55,C66. However,for fluorite phase,there are only three independent elastic constants:C11=C22=C33,C12=C13=C23,C44=C55=C66. In order to study the mechanical properties of CaF2,we firstly calculate the elastic constants of five different phases at 0 GPa,and the results with GGA are listed in Table 3.However,the comparisons of our results with other literatures are unavailable,because the previous data are rarely reported.In addition, we can see that C66in Ni2In structure is smaller than zero,suggesting the instability of this phase at 0 GPa.

Table 1. Experimental and calculated elastic constants of five structures at 0 GPa.

Table 4. Elastic constants Cij of CaF2 under various pressures 0 GPa-150 GPa.
Furthermore, the elastic constants under different pressures calculated by GGA-PBE are listed in Table 4. The results as a function of pressure are also shown in Fig.5 and Fig.6. In Table 4,it is found that in the PbCl2-type phase,C33is larger than C11and C22when the pressure of 8 GPa-80 GPa,while C22becomes the largest one when the pressure increase to 90 GPa. This result indicates that from 8 GPa to 80 GPa,the PbCl2-type structure is more elastic along c axis than a and b axes,but the crystal is more difficult to compress along c axis when pressure larger than 90 GPa, which is consistent with the crystal constants shown in Fig.4. From Fig.5, we can see that C11,C12,and C44in three phases increase linearly with pressure,except the C11at 60 GPa-70 GPa. Because that C11represents the compressibility along x direction,the CaF2crystal is easier to compress along the x axis in the pressure range of 60 GPa-70 GPa,which is consistent with the behavior of a/a0in Fig.4.

Fig.5. Pressure dependence of elastic constants C11,C12,and C44 for three different phases calculated by GGA, the inserted picture emphasizing that value at 4 GPa-10 GPa.

Fig.6.Pressure dependence of elastic constants C13,C33,and C66 for PbCl2-type and Ni2In-type structures calculated by GGA.
Elastic constants are important tools for judging mechanical stability of crystal. It is necessary to analyze the mechanical stability of CaF2during the second-order phase transition because the independent elastic constants of three phases in CaF2crystal are related to the second-order change in the internal energy of a crystal under deformation. Generally, the mechanical stability can be evaluated by Born description, in which the elastic stability criteria are given below.[54]
For fluorite structure(cubic crystal),

For PbCl2-type structure(orthorhombic crystal),

And for Ni2In-type structure(hexagonal crystal),

From Table 4,it is easy to see that in fluorite phase,Cijare all larger than zero, and C11are always larger than C12from 0 GPa to 8 GPa, so the formula(4)is true. Similarly, we use formulas (5) and (6) to calculate the PbCl2-type and Ni2Intype structures, respectively and find that two phases satisfy the Born elastic stability criteria,which confirms the reliability of the second-order phase transition. However,Born stability conditions are not suggested to use at high pressures,and the stability criteria need to be reformulated at none-zero stress case. So far, there are different ways for how to use elastic constants to judge mechanical stability of crystal under high pressure. One of them is given by Sin’ko and Smirnov, they discussed this problem and told these conditions.[55,56]
For fluorite structure(cubic crystal),

For PbCl2-type structure(orthorhombic crystal),

For Ni2In-type structure(hexagonal crystal),

The stability criteria of“C11+2C12+P”of fluorite structure, and that of “(C11+C22+C33+2C12+2C13+2C23+3P)” of PbCl2-type structure, always increase with the pressure. In addition, it is obvious that the stability criteria of“(C11+C12)(C33−P) >2(C13+P)2” of Ni2In-type structure are true from Table 4. Thus, we presented the other stability criteria with applied pressure in Figs. 7 and 8. From Fig.7, we can see that most of the mechanical stability criteria are satisfied, except that C44-P in Ni2In-type structure is slightly smaller than 0. In Fig.8, the other four criteria are shown, in which M1 to M4 are C11+C22−2C12−4P,C11+C33−2C13−4P, C22+C33−2C23−4P of the PbCl2-type structure and C11+C12−2P of fluorite and Ni2In-type structures,respectively. M4 is always larger than 0,while M1 and M2 decrease quickly with pressure and become negative at about 41 GPa and 66 GPa, respectively, and then increase from 80 GPa. On the other hand, M3 is slow down with increasing pressure before 70 GPa,but it drops sharply after that pressure. These sudden changes of M1 to M3 in PbCl2-type structure at 70 GPa-80 GPa suggest the deformation of the structure,which is consistent with the changes of crystal constants b and c in Fig.4.The stability criteria are also calculated by LDA,and the results are quite similar to the ones by GGA(not shown here).Fig.7. Stability conditions Cii-P as a function of pressure for three structures of CaF2.

Fig.8. Parts of stability conditions as a function of pressure for three structures of CaF2.
To further study the mechanical properties of CaF2under pressures, we calculated the bulk modulus B, shear modulus G,and Young’s modulus E with pressure with two kinds of exchange correlation-potential GGA-PBE and LDA-CAPZ,and the ratios B/B0, G/G0, and E/E0are shown in Fig.9. The changes of these three ratios are also marked out at the critical pressure. Form the curves we can see that with pressure increase,all three modulus increase almost linearly,except for the pressure range of 60 GPa-80 GPa. Besides,the ratio B/B0grows faster than G/G0and E/E0obviously. It is known that Young’s modulus E is the ratio of the pressure along an axis over the strain along that axis in the range of pressure,so the increasing of Young’s modulus E with pressure gradually in Fig.9 shows that the high-pressure phase of Ni2In-type structure has better stiffness in CaF2crystal.

Fig.9. Calculated ratios of bulk modulus B/B0,shear modulus G/G0,and Young’s modulus E/E0 as a function of pressure by both(a)GGA and(b)LDA.
It is well known that the Poisson’s ratio v is always related to the mechanics of the crystal under pressure. A larger value of v usually means good ductility, and a smaller v is the opposite.[57]For central force solids, which have the best ductility,the value is between 0.25 and 0.5. Bur for ionic materials, the property of ductility is worse and the ratio of v is about 0.25. For the covalent materials, the ratio of v is most small (about 0.1).[58]The calculated Poisson’s ratio v with exchange-correlation potentials GGA and LDA as a function of pressure is shown in Fig.10(black curves on the left). At the ground state,the ratio v is about 0.28-0.3,and it increases quickly with pressures. At the middle-pressure phase,this ratio continues to increase with pressure and reaches the maximum of about 0.38 at 60 GPa, but then decreases. At the high-pressure phase of Ni2In-type structure,the Poisson’s ratio v maintains 0.36-0.37 and has hardly changes,indicating a high-pressure phase shows more ionic features than the ground state in its interatomic interactions.
Besides, the ratio of bulk modulus and shear modulus B/G is related to the nature of the compound: hardness or brittle. The key criterion was defined by Pugh:[59]when B/G is greater than 1.75,the compound is generally ductile;while when the ratio is less than 1.75, the compound is brittle. In this part, we calculate the ratio B/G of CaF2from 0 GPa to 150 GPa by both GGA and LDA,and also plot this ratio with the pressure increase in Fig.10 (blue curves on the right). It can be found that the curves of B/G with increasing pressure are quite like the ones of ratio v,indicating that both two ratios relate to materials’mechanical properties. More importantly,the ratio B/G is always smaller than 1.75 in all of three phases and is larger in high-pressure phase than ground state, which indicates that better ductility can be anticipated for CaF2under high pressures. Moreover, the curves have obvious raises in the critical pressure between fluorite and PbCl2-type structures, while the raises in the critical pressure between PbCl2-type and Ni2In-type structures are much smaller, suggesting the hardness of the material does not change too much in the second phase transition.

Fig.10. Poisson ratio v and ratio B/G of CaF2 with increasing pressures.
Debye temperature,correlating with specific heat,elastic constants,and melting temperature,is a fundamental parameter for material’thermodynamic properties. When the temperature is much higher than the Debye temperature,the heat capacity of the solid follows the classic law,i.e.,Dulong-Petit’s law. Conversely,when the temperature is much lower than the Debye temperature,the heat capacity will follow the quantum law. Generally,we can theoretically obtain the Debye temperature using the following equation:[60]

where h,k,and N are the Planck’s constant,Boltzmann’s constant,and Avogadro constant,respectively. n is the atom number per molecule and M is the molecular weight. vmis the average sound velocity,which can be calculated as

where vpand vsare the sound velocities for longitudinal and shear wave and can be described as

where ρ denotes the density. B and G are bulk modulus and shear modulus, respectively. In this part, Debye temperature ΘDand the average sound velocity vmare both calculated by two exchange-correlation potentials with increasing pressures, and the results are shown in Fig.11. We can see that with increasing pressure,Debye temperature ΘDand average sound velocity vmincrease almost linearly except for the pressure range of 50 GPa-70 GPa,and these two values in high-pressure phases are much larger than that in low-pressure phases. In Debye theory, the Debye temperature ΘDis the highest temperature of a crystal formed by a single normal vibration. In addition,the abnormal behavior in 50 GPa-70 GPa is related to the changes of the atom position in CaF2, which is consistent with the behavior of crystal constants(Fig.4)and mechanical properties(Figs.9 and 10).

Fig.11. Debye temperature ΘD and average sound velocity vm as a function of pressures calculated by GGA and LDA.
3.3. Electronic structure
In this part, we begin to investigate the pressure effects on the electronic structure of CaF2by analyzing the variation trend of the density of states(DOS)and band structure under pressures. Firstly, the band gaps of CaF2calculated by both GGA and LDA as a function of pressures are shown in Fig.12.Generally, the band gap is always an important parameter to characterize the electronic structure of crystal. From Fig.12,we can see that at the ground-state phase, the band gap increases quickly from about 7 eV to 7.6 eV with pressures. At the critical pressure of the first-order phase transition,the band gap increases to about 8 eV suddenly. Then, with the pressure increase at the PbCl2-type phase,the band gap increases slowly and starts to decrease at 70 GPa, indicating the structure has changed around 60 GPa-80 GPa,which is consistent with the changes of crystal constants of b and c in Fig.4. With the pressure increase, the band gap has hardly changes at the Ni2In-type phase and keeps around 5.5 eV-6 eV.Throughout the calculated pressure range of 0 GPa-150 GPa,CaF2maintains good insulation property. Our results in this part are consistent with those in other literatures.[26]

Fig.12. The band gap of CaF2 under different pressures.
Generally,with the increase of pressure in crystalline materials, the distances among atoms decrease, which leads to more overlap of the electron cloud and the tendency of ionic bonds transforming to covalent bonds. As a result, the band gap increases. On the other hand, when the pressure is large enough, some electrons no longer belong to one atom or one certain bond,those electrons become the so-called delocalized electrons. Such a phenomenon results in a reduction in the band gap. As far as we know, the research on the changes of band gap with pressure is basically a theoretical analysis,and it is only given in the experiment that the three phases of CaF2are insulators no matter under zero pressure or high pressure.[26]Figure 13 shows the charge density difference for fluorite structure along(111)plane at 0 GPa,which serves as a complementary tool for achieving a proper understanding of the electronic structure of the system CaF2. From Fig.13,we can conclude that there exists an ionic character along the Ca-F bond.
To further study the effect of pressure on the electronic structure of CaF2, we investigated its total DOS and partial density of states(PDOS)by GGA.Figure 14 displays the DOS and PDOS of CaF2for fluorite structure at 0 GPa(Fig.14(a)),PbCl2-type structure at 8 GPa and 111.4 GPa(Figs.14(b)and 14(c)),and Ni2In-type structure at 111.4 GPa(Fig.14(d)).
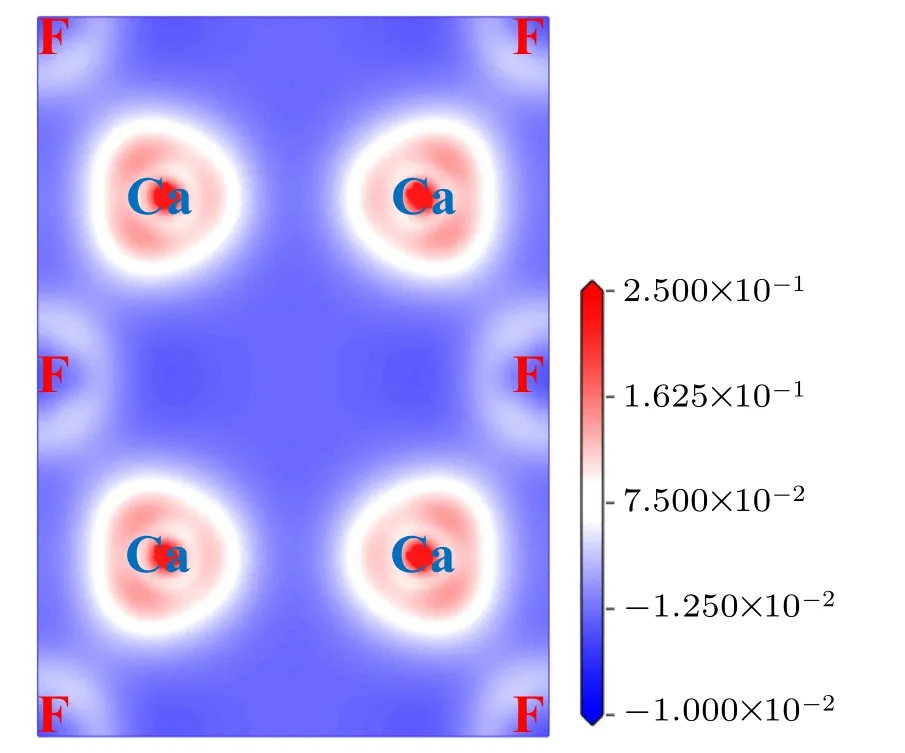
Fig.13.Valence charge density difference(in units of e/˚A3)of fluorite structure along(111)plane at 0 GPa.
First, from Fig.14(a), we can see that the peaks are independent near Fermi energy level and a gap more than 6 eV exists, indicating the CaF2crystal at zero GPa pressure is a type of insulator, which is corresponding with the band gap in Fig.12. It is worth noting that some states crossing the Fermi energy is causing by the broadening of DOS. Besides,two strong peaks(about −1.2 eV and −2.4 eV)in the valence band occur below Fermi level, which are mainly contributed by 2p electronics in F atoms,indicating the F atoms obtaining most of the 3p electrons from Ca, and the characteristics of ionic crystal in CaF2.
Then, from Figs.14(b)-14(d), we can see that in PbCl2-type and Ni2In-type phases, the positions of two F atoms are not equivalent, which is different from the fluorite structure.In Fig.14(b), the band gap is larger than that in Fig.14(a),and the two nearly equal peaks in the valence band changed into one bigger than the others,which shows the locality of the PbCl2-type phase of CaF2.It also can be found that the DOS at 111.4 GPa(Fig.14(c))is wider than that at 8 GPa(Fig.14(b)),which is due to the electrons’ delocalization caused by pressures. The energy range covered under DOS curves is about−3.75 eV to 16.2 eV at 8 GPa, while the energy range is widened as about −6.5 eV to 18.3 eV at 111.4 GPa.For the valence band in PDOS,the highest two peaks shift from −1.2 eV and −2.4 eV towards negative energy levels of −2.3 eV and−4.3 eV, respectively. This phenomenon demonstrates that the covalent bonds form in deeper energy level under pressures, and bring strong bond strengths. It is obvious that at 111.4 GPa,the DOS of PbCl2-type structure(Fig.14(c))is little different from that of Ni2In-type structure(Fig.14(d)): On the one hand,the valence band of CaF2in Ni2In-type structure is slightly wider,and the two peaks are more independent. On the other hand, the band gap in Ni2In-type structure reduces significantly.

Fig.14. DOS and PDOS of CaF2 for fluorite structure at(a)0 GPa,PbCl2-type structure at(b)8 GPa and(c)111.4 GPa,and(d)Ni2In-type structure at 111.4 GPa.
4. Conclusions
In conclusion,detailed DFT calculations of the structural,mechanical,thermodynamic,and electronic properties of crystalline CaF2with five different structures in the pressure range of 0 GPa-150 GPa are performed by both GGA-PBE and LDA-CAPZ,and the following results are obtained.
(i)The enthalpy difference implies that the fluorite phase→PbCl2-type phase →Ni2In-type phase transition in CaF2occurs at PGGA1=8.0 GPa,PGGA2=111.4 GPa by using the XC of GGA, and PLDA1=4.5 GPa, PLDA2=101.7 GPa by LDA,respectively. This result is consistent with previous experiments and theoretical conclusions.
(ii) The enthalpy differences between PbCl2-type and Ni2In-type phases in one molecular formula become very small at the pressure of about 100 GPa, indicating the possibility of coexistence of two phases at high pressures. This may be the reason why the transition pressure of the second phase transition in other reports is so huge(68 GPa-278 GPa).
(iii)The volume has hardly changed in the second phase transition, which is consistent with the approximately equal enthalpy of PbCl2-type and Ni2In-type phases at transition pressure.
(iv)The pressure dependence of mechanical and thermodynamic properties of CaF2are studied, and it is found that the high-pressure phase of Ni2In-type structure has better stiffness than that in CaF2crystal. Moreover, the ratio of B/G and Poisson’s ratio v of CaF2has hardly changs in the second phase transition,suggesting the hardness of the material does not change too much in the second phase transition.
(v) The electronic structure of CaF2was also analyzed with the change of pressures. By analyzing the band gap and density of states,it is found that the CaF2crystal is always an insulator at 0 GPa-150 GPa.
猜你喜欢
杂志排行
Chinese Physics B的其它文章
- Transport property of inhomogeneous strained graphene∗
- Beam steering characteristics in high-power quantum-cascade lasers emitting at ~4.6µm∗
- Multi-scale molecular dynamics simulations and applications on mechanosensitive proteins of integrins∗
- Enhanced spin-orbit torque efficiency in Pt100−xNix alloy based magnetic bilayer∗
- Soliton interactions and asymptotic state analysis in a discrete nonlocal nonlinear self-dual network equation of reverse-space type∗
- Discontinuous event-trigger scheme for global stabilization of state-dependent switching neural networks with communication delay∗