LiBa0.95-yBO3∶0.05Tb3+,yBi3+荧光粉的制备及荧光性质
2021-03-12张敏芝梁刚锋李春霞赵国良
鲁 雅 张敏芝 梁刚锋 李春霞 赵国良*,,
(1浙江师范大学行知学院,金华 321004)
(2浙江师范大学化学与生命科学学院,金华 321004)
0 Introduction
As well known,the generation off-fandf-dtransitions of rare earth ions can absorb or emit electromagnetic radiation of various wavelengths from ultraviolet to near-infrared region,so that rare earth luminescent materials exhibit extremely rich luminescent properties.In fact,the 4ftransition of rare earth ions is forbidden,and it is relatively inefficient to directly excite rare earth ions.By introducing a low concentration of rare earth ions into the host lattice of the matrix,an inorganic material with ideal luminescence properties can finally be obtained.Among rare earth-doped inorganic materials,the matrix can provide a relatively stable structural environment for the luminescence center(rare earth ion),and compared with the luminescence center(rare earth ion),other co-doped or some matrix materials even have a higher absorption coefficient,so that energy can be effectively transferred to rare earth ions.Compared with lanthanide complexes,quantum dots and organic dyes,inorganic materials doped with rare earth ions have many advantages such as large Stokes shift,high chemical/photochemical stability,sharp emission spectra,long life and low toxicity.Therefore,there are very rich applications and broad research prospects in the fields of displays,sensors,solid-state lasers,biomedicine and so on[1-11].
LEDs have been widely used as indicators,decorative lights,backlights,traffic lights,etc.In recent years,the color rendering and brightness of LEDs have been continuously improved.Its significant advantages and broad application prospects make it a research focus at home and abroad.In terms of core technology,phosphor,as an important part of LED,is considered to be a prerequisite for display and lighting functions and success[12].In combination with the current reality,in the research of phosphors,it is urgent to develop new types of luminescent materials that have long lifespan,high luminous efficiency and can be excited by blue or near ultraviolet LED chips.
In recent decades,researchers have widely developed various types of matrix LED phosphors,mainly including silicate,aluminate,borate,tungsten/molybdate,sulfide,and nitrogen(oxygen)compounds.However,the emission peaks of silicate-based phosphors are relatively narrow,and the color rendering effect of white light after packaging the LED is not good;while the aluminate-based phosphors have high calcination temperature,poor moisture resistance,poor oxidation resistance and single comparable substrates are difficult to prepare and have many other shortcomings;the synthesis cost of nitrogen(oxygen)compounds is high,and the preparation process is complicated,which makes it difficult to realize industrialization.
Borate-based phosphors can be used as a good kind of luminescent matrix materials of rare earth element doped due to their high optical damage threshold and fluorescence efficiency,wide light transmission area,simple preparation process,low synthesis temperature and good thermal stability[13-21].Scholars at home and abroad have studied many single-doped or multidoped borate-based phosphors,such as LiBaBO3∶Tb3+[22],Sr2B2O5∶Tb3+,Li+[23],NaSrB5O9∶Eu3+[24],Li6Gd(BO3)3∶ Tb3+/Bi3+,Eu3+[25],KBaY(BO3)2∶ Ce3+,Tb3+,Eu3+[26],NaSrBO3∶Ce3+,Sm3+,Tb3+[27],KSr4(BO3)3∶Dy3+,Tb3+[28],Sr3Y2(BO3)4∶Dy3+[29],Li6M(BO3)3(M=Y,Gd)∶Eu3+[30],Li4Ca(BO3)2∶Sm3+[31],LiBaBO3∶Eu3+,Bi3+[32],LiBaBO3∶Ce3+/Tb3+[33].
Nevertheless,there is still a large space for the research of borate phosphors.In this paper,we report the synthesis of two series of borate-based phosphors LiBa1-xBO3∶xTb3+and LiBa0.95-yBO3∶0.05Bi3+,yTb3+.The crystalline phase structure and microscopic morphology of the phosphor were characterized by powder X-ray diffraction(PXRD)and scanning electron microscopy(SEM),and the luminescence properties of the samples were tested.The mechanism of concentration quenching and energy transfer during the luminescence process of the samples were analyzed and discussed.The product with the bestluminescentintensity was screened out by measuring the fluorescent spectrum of the first series of phosphors,thus the optimum doping amount of Tb3+was determined.On this basis,Bi3+was further doped to investigate the effect of Bi3+on Tb3+sensitization,so as to find luminescent materials with better luminescence performance.
What needs to be explained is although the first series of synthesis and the determination of luminescence performance have been reported in the literature[22],in order to know and master the synthesis process and parameters of the first series,the first series of phosphors were synthesized repeatedly and the corresponding characterization and luminescence performance were performed in this paper.The measurement results show that the sample structure is consistent with the literature,and the doping amount of the activated ion at the maximum luminous intensity is different from the literature.All this is to determine the preparation conditions of the second series.
1 Experimental
1.1 Materials and measurements
All of the reagents employed were analytical grade and used without further purification.The phase composition and structure were determined by PXRD(D8 Advance XRD tester,CuKα,λ=0.154 2 nm,40 kV,100 mA,2θ=10°~80°,the slit width was 6.6 nm).The emission and excitation spectra were measured by a FLS980 fluorescence spectrometer of Edinburgh,UK.All the photoluminescence properties of the phosphors were measured at room temperature.The morphology test was carried out with the S-4800(5 kV)SEM of Hitachi,Japan.In addition.The elemental composition of the sample was analyzed by energy dispersive spectrometer(EDS,Hitachi S-4800,15 kV).The processing and fitting of the data were completed through Origin9 software.
1.2 Preparation of the samples
1.2.1 Preparation of LiBa1-xBO3∶xTb3+
The starting reactants Li2CO3,BaCO3,H3BO3,Tb2(CO3)3·H2O(all materials were analytically pure)were weighed accurately according to the stoichiometric ratio and mixed in an agate mortar.The mixture was grinded continuously at least 0.5 h,then it was transferred into a corundum crucible and pre-calcined at 500℃in a high-temperature box-type resistance furnace at a heating rate of 5℃·min-1for 2 h.After slowly cooled to room temperature,it was put in an agate mortar again and grinded continuously for at least 0.5 h.The powders were calcined at 700℃for 2 h,and the LiBa1-xBO3∶xTb3+(molar fractionx=0.02,0.03,0.04,0.05,0.06,0.07)phosphors were obtained.
1.2.2 Preparation of LiBa0.95-yBO3∶0.05Bi3+,yTb3+
The preparation method and process were the same as above,except that the reactant(BiO)2CO3(analytical purity)was added,and finally the products LiBa0.95-yBO3∶0.05Bi3+,yTb3+(molar fractiony=0.02,0.03,0.04,0.05,0.06,0.07)were obtained.
2 Results and discussion
2.1 Series of LiBa1-xBO3∶xTb3+
2.1.1 Structure of LiBa1-xBO3∶xTb3+
Fig.1 shows the XRD patterns of the series of LiBa1-xBO3∶xTb3+(x=0.02,0.03,0.04,0.05,0.06,0.07)phosphors.The datum agreed well with PDF No.81-1808 of LiBaBO3,therefore the phase purity is high,and the crystallinity is good,indicating that Tb3+in the sample enters successfully the main lattice,and there is no effect on LiBaBO3.LiBaBO3belongs to the monoclinic crystal system withP21/nspace group,which is reported by references[22,33].
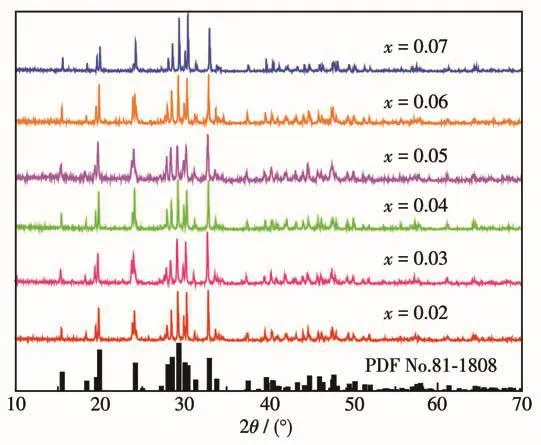
Fig.1 XRD patterns of LiBa1-xBO3∶xTb3+ samples
2.1.2 Fluorescent spectra of LiBa1-xBO3∶xTb3+
Fig.2 shows the emission and excitation spectra of LiBa1-xBO3∶xTb3+phosphor with Tb3+molar fraction of 0.05.Under the excitation of 369 nm,the emission spectrum exhibited four major emission bands at 488,544,583 and 622 nm,which are originated from5D4→7F6,5D4→7F5,5D4→7F4and5D4→7F3,characteristics transitions of Tb3+ions,respectively.The strongest one appeared at 544 nm(5D4→7F5),and its intensity was much larger than other emission peaks,so the whole sample showed green light emission.The excitation spectrum for 544 nm emission had excitation peak distribution in a range of 200~400 nm,indicating that the phosphor can be effectively excited by near ultraviolet and ultraviolet light.Among them,the broadband excitation peak in a range of 220~280 nm corresponds to the 4f8→4f75d1transition of Tb3+ion;the absorption band in a range of 300~400 nm belongs to the 4f→4ftransition of Tb3+ions;the peaks were located at 318 nm(7F6→5H6),341 nm(7F6→5L8),352 nm(7F6→5L9),359 nm(7F6→5G6),369 nm(7F6→5L10)and 378 nm(7F6→5D3).The strongest excitation peak was located at 369 nm,and the excitation peaks at 378 and 251 nm were also strong.Taking 378,369 and 251 nm as excitation wavelengths,respectively,the emission spectra of the obtained samples were found to have the same characteristics.Except for the difference in the intensity of the emission peak,the position and shape of the other emission peaks were not significantly different.
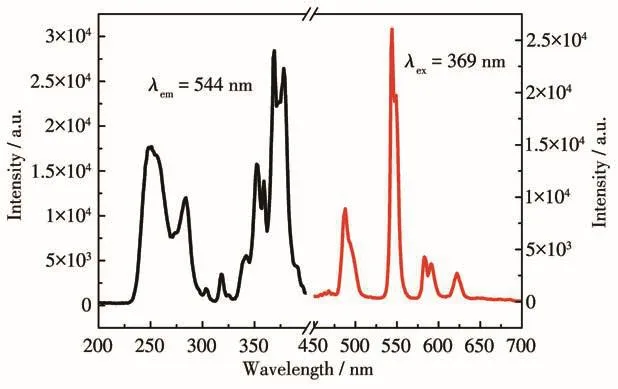
Fig.2 Excitation and emission spectra of LiBa0.95BO3∶0.05Tb3+ phosphor
The fluorescent spectra of LiBa1-xBO3∶xTb3+(x=0.02,0.03,0.04,0.05,0.06,0.07)phosphor samples were very similar.With the gradual increase of doping amount of Tb3+,the luminous intensity at 544 nm gradually increased;when the Tb3+ions doping molar fractionx=0.05,the intensity was the largest,which was different from the results reported in the literature[22];afterwards,when the doping amount continued to increase,it appeared instead.The tendency of the luminous intensity to weaken is that there is a concentration quenching phenomenon.This phenomenon stems from the fact that as the Tb3+ions were gradually incorporated,the distance between the Tb3+ions in the matrix continued to decrease,and the number of luminescent centers increased accordingly,so the luminous intensity gradually increased,and reached the strongest intensity at the optimal doping amount of Tb3+.However,as the amount of doping continued to increase,the distance between the luminescent centers of Tb3+ions continued to decrease,and the quenching occurred between adjacent Tb3+through non-radiative energy transfer,thus making the luminescent intensity of the phosphor weaked(Fig.3a and 3b).
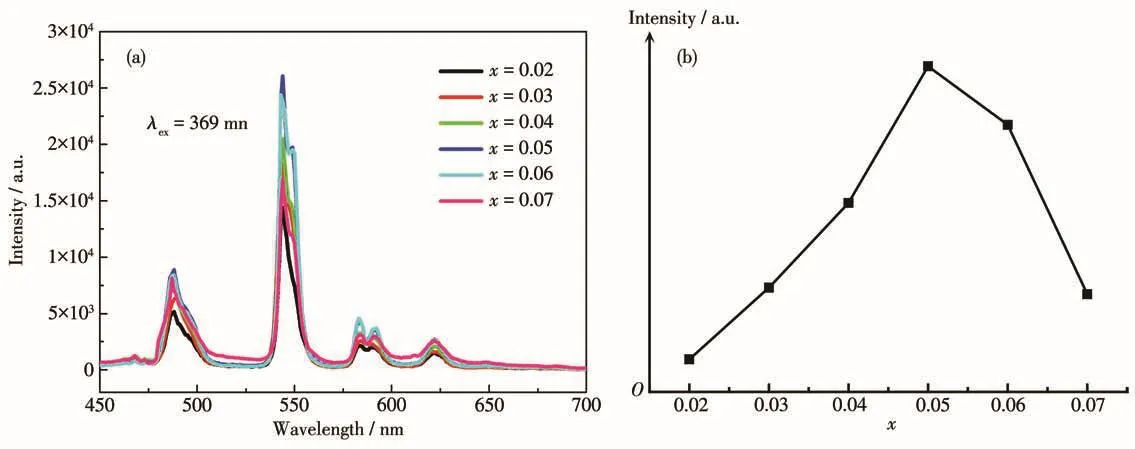
Fig.3 (a)Emission spectra of LiBa1-xBO3∶xTb3+ phosphors;(b)Relative emission intensity as a function of Tb3+ concentration for 544 nm peak
2.1.3 CIE color chromaticity coordinates of LiBa1-xBO3∶xTb3+
Table 1 lists the color chromaticity coordinate values calculated from the emission spectrum of LiBa1-xBO3∶xTb3+sample.From this,it can be seen that the emission interval of the phosphor was in the green light range.Fig.4 is a comparison chart of the color coordinates(0.314,0.535)of LiBa0.95BO3∶0.05Tb3+phosphor sample and the green light color coordinates(0.310,0.595)of the international SMPTE C standard.It can be seen from the figure that the fluorescent pink coordinate of products was close to the standard green color coordinate,and with the change of Tb3+dosage,the change of color chromaticity coordinate was small,indicating that the luminous performance of LiBa1-xBO3∶xTb3+phosphor is stable.
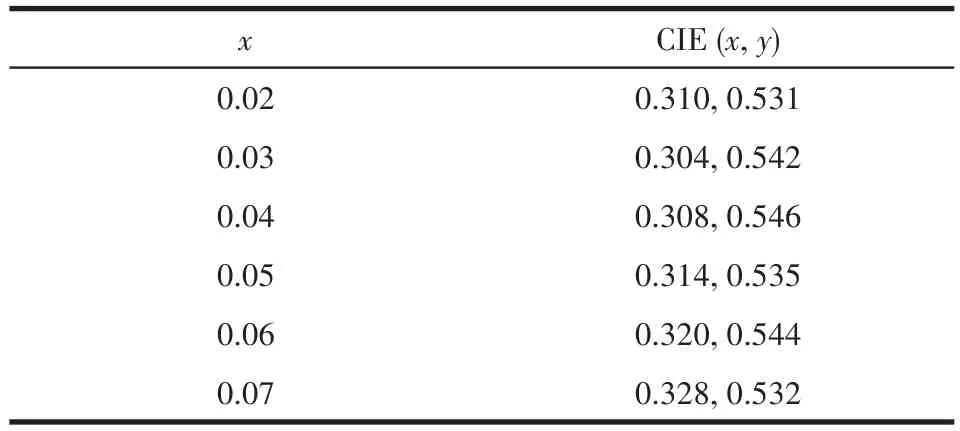
Table 1 Chromaticity coordinates of LiBa1-xBO3∶xTb3+ phosphors excited at 369 nm
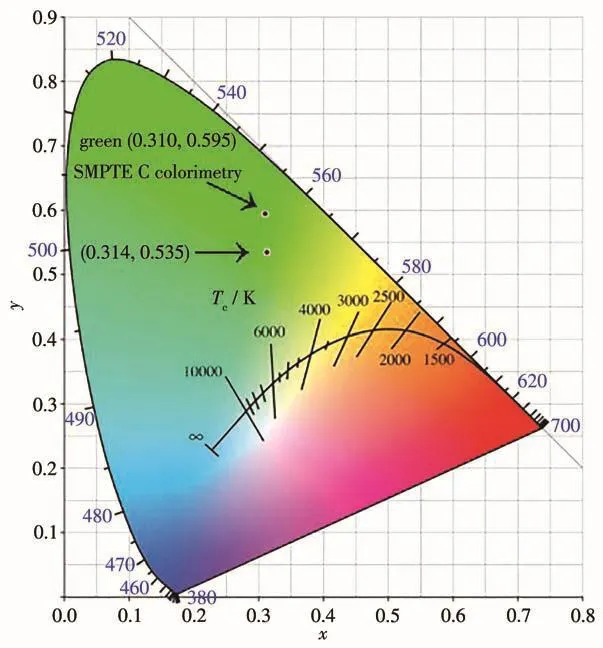
Fig.4 CIE color chromaticity coordinates of LiBa0.95BO3∶0.05Tb3+ phosphor
2.1.4 SEM of LiBa0.95BO3∶0.05Tb3+
Fig.5 is a SEM image of LiBa0.95BO3∶0.05Tb3+sample at 30 000 times magnification,which shows that the sample was composed of irregular massive agglomerated particles and a large number of needle-like grains on its surface,and the needle-like shape.The length of the grain was 1~2 μm.
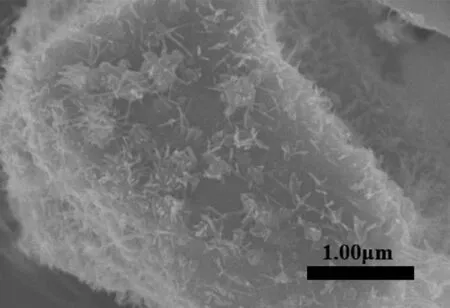
Fig.5 SEM image of LiBa0.95BO3∶0.05Tb3+ sample
2.2 Series of LiBa0.95-yBO3∶0.05Tb3+,yBi3+
2.2.1 PXRD of LiBa0.95-yBO3∶0.05Tb3+,yBi3+
Fig.6 shows the XRD patterns of phosphor samples with different Bi3+doping amounts,LiBa0.95-yBO3∶0.05Tb3+,yBi3+(y=0.01,0.02,0.03,0.04,0.05,0.06).According to the standard card,LiBaBO3belongs to the monoclinic system,and the space group isP21/n.It can be seen from the figure that the positions of the diffraction peaks of the samples are in accordance with the standard card of LiBaBO3(PDF No.81-1808),which shows that the phase of the prepared series of phosphor samples is pure.It indicates that a small amount of Tb3+and Bi3+ions enter the matrix lattice through calcination,which partially replaces the Ba2+lattice position,and has no obvious effect on the crystal structure of main crystal phase of LiBaBO3.
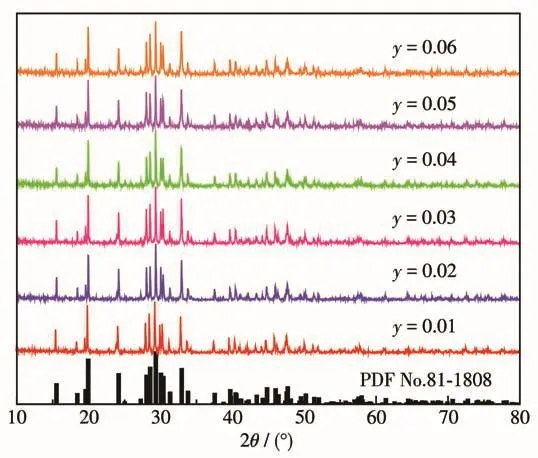
Fig.6 XRD patterns of LiBa0.95-yBO3∶0.05Tb3+,yBi3+ samples
SEM images at different magnifications and EDS spectrum results of LiBa0.92BO3∶0.05Tb3+,0.03Bi3+are shown in Fig.7.It can be observed from the figure that the sample was composed of irregular massive agglomerates and a small number of needle-shaped grains.The size of these massive agglomerates was a few microns or less than 1 μm.In order to detect the elemental composition of the sample,the EDS spectrum of the sample was further tested.It can be seen that the chemical composition of this sample included B,O,Tb,Ba,and Bi,indicating that Tb3+and Bi3+are co-doped into the LiBaBO3matrix.Since the EDS detector was not sensitive to Li,Li did not appear in the EDS spectrum.
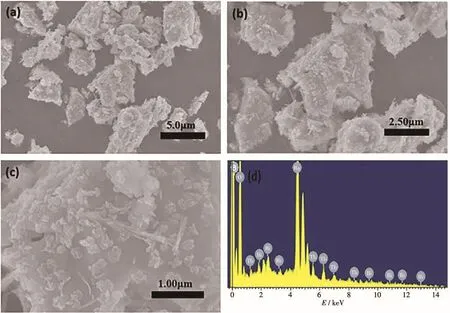
Fig.7 SEM images of LiBa0.92BO3∶0.05Tb3+,0.03Bi3+ sample and corresponding EDS spectrum
2.2.2 Luminescent properties of LiBa0.95-yBO3∶0.05Tb3+,yBi3+
Fig.8 shows the excitation and emission spectra of LiBa0.94BO3∶0.05Tb3+,0.01Bi3+phosphor.With 544 nm as the detection wavelength,the excitation spectrum of the sample showed strong absorption peaks in a range of 230~400 nm.The strongest excitation peak was at 254 nm,which belongs to the 4f8→4f75d1transition of Tb3+ions;the excitation peaks at 368 nm(7F6→5L10)and 377 nm(7F6→5D3)were also relatively strong,corresponding to 4f→4fjump of Tb3+ions.In a range of 300~390 nm,the other narrow excitation peaks of the 4f→4ftransition of Tb3+ions were 318,342,351 and 358 nm,corresponding to7F6→5H6,7F6→5L8,7F6→5L9and7F6→5G6transition.Taking 254 nm as the excitation wavelength,the main emission peaks of the sample were located at 487,544,585 and 621 nm,corresponding to the characteristic5D4→7FJ(J=6,5,4,3)transition of Tb3+ion.
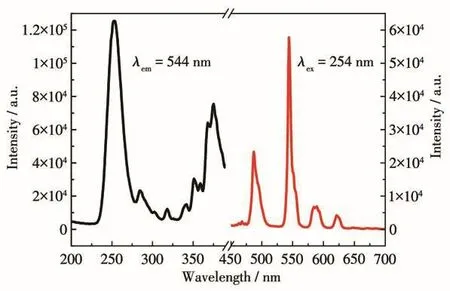
Fig.8 Excitation and emission spectra of LiBa0.94BO3∶0.05Tb3+,0.01Bi3+ phosphor
At the same time,the emission spectra of the samples with Bi3+ion doping amounty=0 andy=0.01 were compared,as shown in Fig.9.We found that after codoping with a small amount of Bi3+and Tb3+ions,the position and shape of the emission peak hardly changed,and the luminous intensity at 544 nm was significantly enhanced,indicating that the doping of Bi3+enhanced the luminous intensity of the activated ion Tb3+.
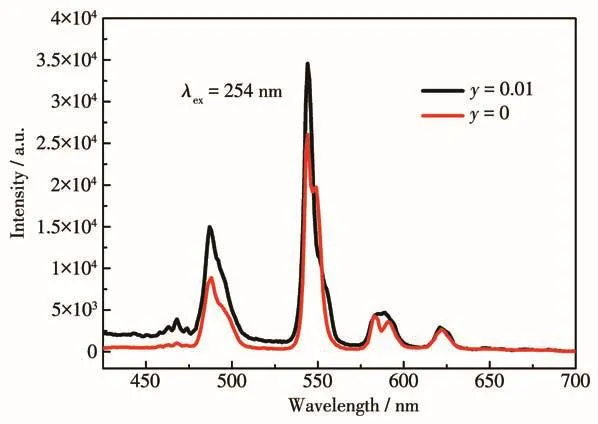
Fig.9 Emission spectra of LiBa0.95-yBO3∶0.05Tb3+,yBi3+(y=0,0.01)phosphors under 254 nm
By changing the doping amount of sensitizing ions Bi3+,the effect of co-doped sensitizing ions and activating ions on the luminescence properties of LiBa0.95-yBO3∶0.05Tb3+,yBi3+phosphors was further studied.Fig.10 shows the emission spectra of LiBa0.95-yBO3∶0.05Tb3+,yBi3+(y=0.01,0.02,0.03,0.04,0.05,0.06)phosphor samples and the luminescence intensity at 544 nm as a function of the amount of doped Bi3+.It can be observed from the figure that the change of doping amount does not affect the position and shape of emission peak of the phosphor,and the emission spectra of all samples included four main emission peaks of 487,544,585 and 621 nm.It is worth noting that with the increase of the doping amountyof Bi3+from 0.01 to 0.06,the intensity of the emitted light changes greatly.Initially,wheny=0.01~0.03,the luminous intensity of LiBa0.95-yBO3∶0.05Tb3+,yBi3+phosphor increased with the increase of the amount of Bi3+.Wheny=0.03,the luminous intensity was optimal.After that,when the amount of Bi3+ions added further increased,the luminous intensity decreased,which shows that the sensitivity of Bi3+to Tb3+depends on the concentration of Bi3+ions.In this process,it may be that a small amount of Bi3+ion is not conducive to improving the luminous intensity,and the slightly higher amount of Bi3+ion doping has the tendency to transfer more energy to Tb3+.This effective energy transfer from Bi3+to Tb3+can increase the luminous intensity.However,due to the aggregation effect of excess Bi3+ions,the distance between the ions becomes smaller,resulting in a concentration quenching phenomenon,which leads to a decrease in luminous intensity.
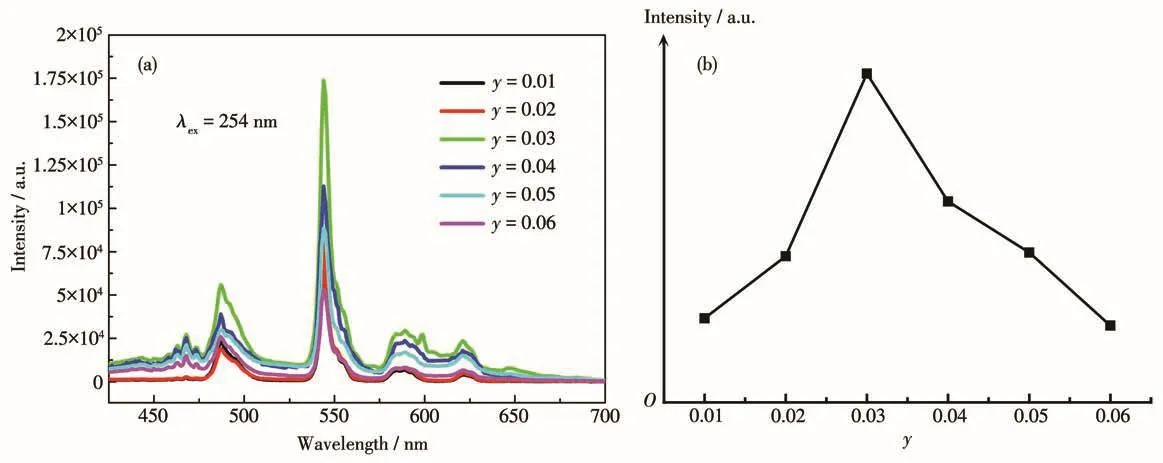
Fig.10 (a)Emission spectra of LiBa0.95-yBO3∶0.05Tb3+,yBi3+ phosphors;(b)Relative emission intensity as a function of Bi3+ concentration for 544 nm peak
According to the Eq.1[34]for the critical distance between sensitized ions and activated ions,the critical distance between Bi3+and Tb3+can be obtained:

WhereNis the number of molecules contained in the unit cell,andXis the sum of the critical concentrations of Bi3+and Tb3+.For LiBa0.95-yBO3∶0.05Tb3+,yBi3+phosphors,the unit cell volumeV=0.298 2 nm3,N=4,X=0.08.After calculation,the critical distanceRcof the quenching concentration was 1.21 nm.In oxide phosphors,only when the critical distance is less than 0.5 nm,the non-radiative energy transfer will be carried out by exchange of interactions.In the LiBaBO3matrix,the energy transfer between Bi3+and Tb3+is mainly due to multipole-multiple extreme interaction.
For multipole interaction and Reisfeld approximation,the luminous intensity can be calculated according to Dexter′s energy transfer formula(2)[35]:

WhereIis the luminous intensity of the phosphor LiBa0.95-yBO3∶0.05Tb3+,yBi3+(y=0.03,0.04,0.05,0.06),yis the concentration of the sensitizing ion Bi3+,cis a constant andθ=6,8 and 10 correspond to dipoledipole,dipole-quadrupole,and quadrupole-quadrupole interaction,respectively.The data of the luminous intensity and doping amount of5D4→7F5transition in the phosphors were calculated and fitted,and there was a linear relationship between lg(I/y)and lgy(Fig.11).After linear fitting,θwas found to be 7.87,and it was closest to 8.Therefore,in LiBa0.95-yBO3∶0.05Tb3+,yBi3+phosphor,the main energy transfer from Bi3+to Tb3+is through dipole-quadrupole interaction.
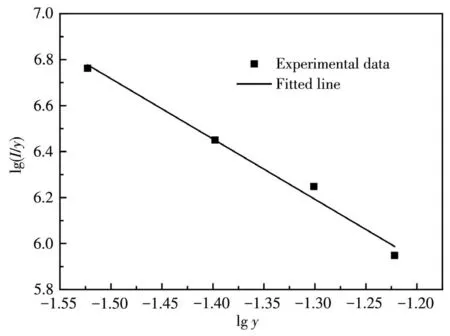
Fig.11 Dependence of lg(I/y)on lg y for LiBa0.95-yBO3∶0.05Tb3+,yBi3+(y=0.03~0.06)phosphors
2.2.3 CIE color chromaticity coordinates of LiBa0.95-yBO3∶0.05Tb3+,yBi3+
The CIE color chromaticity coordinates of LiBa0.95-yBO3∶0.05Tb3+,yBi3+phosphor are shown in Table 2.Fig.12 shows the chromaticity coordinates of the phosphors that have been marked.It can be observed that when a small amount of sensitizing ion Bi3+was added(y=0.01~0.03),the chromaticity coordinates were mainly located in the green light area.The color change of the powder sample was small,indicating that its luminous performance is relatively stable.When the amount of Bi3+added continued to increase(y=0.04~0.06),the color coordinate position of the phosphor sample was close to the standard ideal white light color coordinate(0.33,0.33).The overall emission color of the sample showed a gradual trend from green light to white light,which shows that the change of the amount of Bi3+added can adjust the emission color of LiBa0.95-yBO3∶0.05Tb3+,yBi3+phosphor.
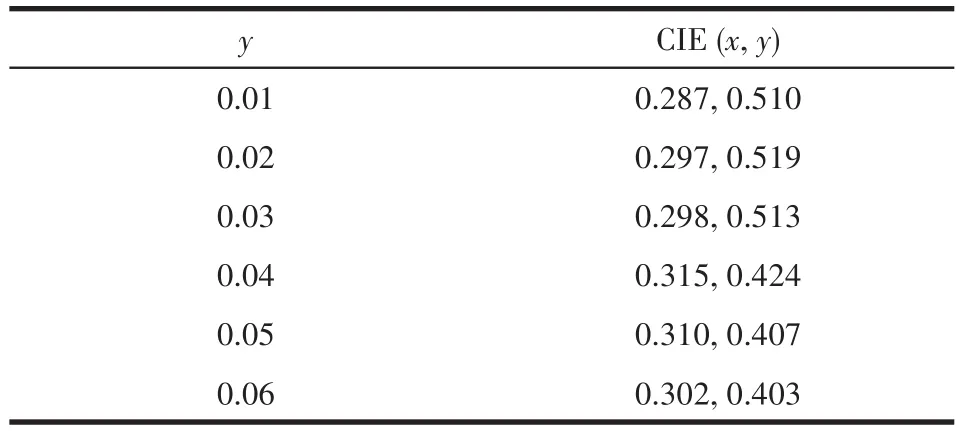
Table 2 Chromaticity coordinates of LiBa0.95-yBO3∶0.05Tb3+,yBi3+ phosphors excited at 254 nm
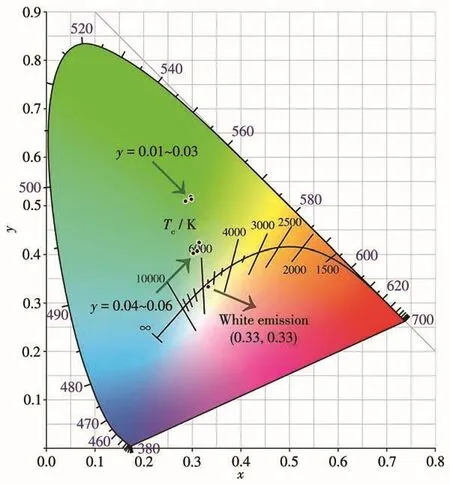
Fig.12 CIE color chromaticity coordinates of LiBa0.95-yBO3∶0.05Tb3+,yBi3+phosphors
3 Conclusions
A series of Tb3+single-doped phosphors LiBa1-xBO3∶xTb3+(x=0.01,0.02,0.03,0.04,0.05,0.06,0.07)were prepared by using traditionalhightemperature solid-phase method at not too high temperature.According to the relationship between fluorescent intensity and doping amount of Tb3+,it is found that the luminous intensity of the product was the largest whenx=0.05,so as to determine the optimal doping amount of Tb3+.Another series of phosphor of co-doped Tb3+and Bi3+LiBa0.95-yBO3∶0.05Tb3+,yBi3+(y=0.01,0.02,0.03,0.04,0.05,0.06)were also prepared based on this.The PXRD patterns of two series of phosphors agreed well with LiBaBO3(PDF No.81-1808),indicating that either single doped Tb3+or co-doped Tb3+/Bi3+did not cause any significant change in the host lattice.LiBaBO3belongs to the monoclinic crystal system,and the space group isP21/n.All samples were pure phase,and their microscopic morphology was mainly composed of massive particles and a large number of needle-like crystal grains on the surface,and had good crystallization properties.Fluorescent spectra showed that the luminescent intensities of the second series of phosphors were better than those of the first series,which indicates that Bi3+has a sensitizing effect on the luminescence of Tb3+.The emission intensity initially increased with Bi3+molar fraction,and reached a maximum at molar fraction of Bi3+being 0.03.A decrease in the emission intensity was observed as the Bi3+molar fraction continued to increase,and this shows the occurrence of energy migration between Bi3+and Tb3+ions at different sites in the lattice,resulting in content quenching.CIE color chromaticity coordinates show that the luminescent color of LiBa0.95-yBO3∶0.05Tb3+,yBi3+presented a gradual trend from green to white,which provides useful information for the preparation and application of such luminescent materials.