Evaluation of numerical wave model for typhoon wave simulation in South China Sea
2018-11-15ZhiyuanWuChangboJiangBinDengJieChenYonggangCaoLianjieLi
Zhi-yuan Wu,Chang-bo Jiang,Bin Deng,*,Jie Chen,Yong-gang Cao,Lian-jie Li
aSchool of Hydraulic Engineering,Changsha University of Science and Technology,Changsha 410004,China
bKey Laboratory of Water-Sediment Sciences and Water Disaster Prevention of Hunan Province,Changsha 410004,China
cSchool for Marine Science and Technology,University of Massachusetts Dartmouth,New Bedford,MA 02744,USA
dKey Laboratory of Technology for Safeguarding of Maritime Rights and Interests and Application,State Oceanic Administration,Guangzhou 510310,China
Abstract The simulating waves nearshore(SWAN)model has typically been designed for wave simulations in near-shore regions.In this study,the model's applicability to the simulation of typhoon waves in the South China Sea(SCS)was evaluated.A blended wind field,consisting of an interior domain based on Fujita's model and an exterior domain based on Takahashi's model,was used as the driving wind field.The waves driven by Typhoon Kai-tak over the SCS that occurred in 2012 were selected for the numerical simulation research.Sensitivity analyses of time step,grid resolution,and angle resolution were performed in order to obtain optimal model settings.Through sensitivity analyses,it can be found that the time step has a large influence on the results,while grid resolution and angle resolution have a little effect on the results.
©2018 Hohai University.Production and hosting by Elsevier B.V.This is an open access article under the CC BY-NC-ND license(http://creativecommons.org/licenses/by-nc-nd/4.0/).
Keywords:Typhoon wave;South China Sea;SWAN model;Numerical wave model;Wave prediction and simulation
1.Introduction
Information on wind waves is very important for coastal ocean engineering and marine activities.The sustainable development of economic activities in the marine environment requires long-term data about environmental conditions such as wind-generated waves.Accordingly,knowledge of the wind-wave patterns is necessary in a variety of applications including design of coastal structures,sediment transport,coastal erosion,and pollution transport studies(Akpınar et al.,2012;Jiang et al.,2015,2017;Chowdhury and Behera,2017).
Up to 90%of natural destruction of the ocean is induced by waves,especially tropical cyclones and typhoon waves(Monserrat et al.,2006).As ocean resources development activities have been taken to new areas such as deep-sea areas with poor natural environments,wind-generated waves have obstructed the exploitation of the ocean resources by creating a poor operating environment.The South China Sea(SCS)has two different climate zones:the tropical and subtropical zones.Typhoons,which occur frequently,pose great threats to the SCS(Morton and Blackmore,2001)due to its water depth,wind fitch,varied topography,complicated hydrology,active tropical cyclones,and prevalent monsoons(Huangfu et al.,2017;Shao et al.,2018),constituting a serious challenge to deep-sea engineering.Therefore,it is urgently necessary to conduct further study on extreme environmental factors such as typhoons and waves in the SCS,in order to meet the needs of design,construction,and safe operation of deep-water engineering in the SCS.
Currently,there are mainly three kinds of numerical models used to calculate typhoon waves:the wave modeling(WAM,Group,1988),WAVEWATCHIII(WWIII)model(Tolman,2009),and simulating waves nearshore(SWAN)models(Padilla-Hernandez et al.,2007;Xu et al.,2017;Umesh and Swain,2018).The calculation principles for the three models are roughly similar.The WAM model and WWIII model are suitable for the calculation of large-scale wavefields in the deep sea,but the results are not satisfactory when they are used to calculate small-scale wave fields in shallow water.The SWAN model is modified by the WAM model,adding the shoaling on the basis of the WAM model.The SWAN model includes some wave propagation factors,such as wave breaking,wave diffraction,and bottom friction in shallow water(Ou et al.,2002;Rogers et al.,2007).Thus,the simulation accuracy of the waves in the near-shore area can be largely enhanced.Considering the physical process,the computational efficiency of the SWAN model is lower than that of the WAM and WWIII models.
Because the range of wind speed adopted in parameter calibration of the wind wave growth model is from 12 to 17 m/s(Booij et al.,1999),some researchers believe that the SWAN model is applicable to the calculation of general wind and waves,while the WWIII model is suitable to the calculation of large-scale typhoon waves(Reguero et al.,2012;Chen et al.,2013).With consideration of nonlinear physical process,the WWIII and SWAN models both tend to solve the balance equation of dynamic spectral density of the directional spectrum.Using the Jonswap spectrum,the WWIII model mainly considers wind energy input,nonlinear wave-wave interactions,bottom friction,and whitecapping.
In addition to the physical process considered in the WWIII model,the SWAN model also takes the dissipation of energy and three-wave interaction of depth-induced wave breaking into account.With consideration of the shallow water effect,the computational efficiency of the SWAN model is slightly lower.In the WWIII model,the linear growth of the wind energy input is not considered,but the exponential growth is considered,as in the SWAN model.The waves are mainly affected by a linear growth in the primary generating stage as well as exponential growth in the growing stage.Meanwhile,the case is different when the wind speed turns into friction wind speed.
It should be noted that the SWAN model is typically driven by the wind speed at an elevation of 10 m(U10),whereas in this study it was driven by the friction velocity U*.For the WWIII model formulation,the transformation from U10to U*is obtained with U*=,where CDis the drag coefficient and CD= (0.8+0.065U*)× 10-3.In the SWAN model,when the wind speed is greater than 7.5 m/s,CDtakes the same value as in the WWIII model,and when the wind speed is less than 7.5 m/s,CDcan be regarded as a constant,and CD=1.2875×10⁻³.Consequently,the SWAN model has a rather wider range of adaptive wind speed than the WWIII model in wave calculation.
In this study,the calculation of waves caused by a specific typhoon in the SCS was carried out based on the SWAN model.A blended wind field consisting of an interior domain and an exterior domain,based on Fujita's model and Takahashi's model,respectively,was used as the driving wind field.The waves driven by Typhoon Kai-tak over the SCS occurring in 2012 were used for numerical simulation.
2.Theoretical background of wind and wave models
2.1.Typhoon wind field
In this study,the interior domain based on Fujita's model(Fujita,1952)and the exterior domain based on Takahashi's model(Takahashi,1939)were adopted as the model wind if eld.Fujita's model was selected to simulate the wind field within two times the maximum wind speed radius,and Takahashi's model was selected beyond the range.The atmospheric pressure(pr)distribution in a typhoon area has the following forms:

where pris the pressure at a radial distance r from the cyclone center(hPa);r is the distance from any position(x,y)to the center of the typhoon,andwhere xcand ycare the positions of typhoon center;p∞is the ambient or environmental pressure,equal here to 1013.25 hPa;p0is the central pressure of the typhoon;and R is the radius of the maximum wind speed(km),obtained with an empirical formula put forward by Graham and Nunn(1959)as follows:
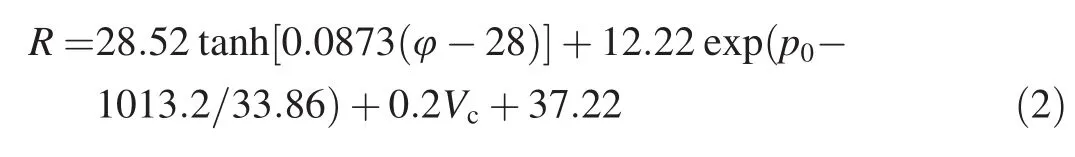
where Vcis the speed of the typhoon center and φ is the geographic latitude.
The combination of Fujita's air pressure formula and Takahashi's air pressure formula can better describe the distribution of a typhoon pressure field.If the origin of coordinates was in the fixed computational domain,the center of the wind field in the typhoon domain would be symmetric.The distribution of the typhoon domain has the following forms:
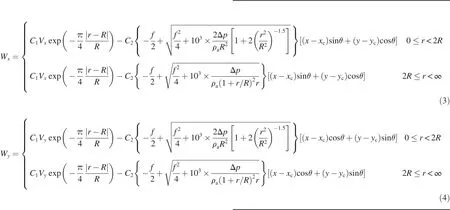
where Wxand Wyrepresent the components of wind speed in the x and y directions,respectively;Vxand Vyrepresent the components of the moving speed of the typhoon center in the x and y directions,respectively; Δp=p∞-p0,indicating different atmospheric pressures of the typhoon center;ρais the air density;θ is the fluid inlet angle;C1and C2are constants,with C1=1.0 and C2=0.8;and f represents the Coriolis force.
2.2.Formulations of SWAN model
As a third-generation wave model,the SWAN model is one of the wave numerical models commonly used around the world at present.It can be used to calculate waves driven by wind,swells,and mixed waves of coastal,lake,and estuarine waters.All kinds of important wave parameters required in coastal engineering can be calculated,including wave height,wave period,wave length,wave steepness,the wave-moving direction,and wave energy propagation.The SWAN model has been widely used in simulation and calculation of waves since it was released.
In the SWAN model,for the control equation for wave description,the dynamic spectrum balance equation is adopted based on the theory of linear and random surface gravity waves.In the flow field,the random waves are presented in two-dimensional dynamic spectral density rather than twodimensional energy spectral density.Dynamic spectral density N(σ,θ)is the ratio of the spectral energy density E(σ,θ)to the intrinsic representative wave frequency σ.The control equation is

where N is the evolution of the action density;t is time;Cxand Cyare the propagation velocities of wave energy in the x and y directions,respectively;Cσand Cθare the propagation velocities in spectral spaces σ and θ,respectively;and S represents the energy source.The left-hand side is the kinematic part of this equation.The first item on the left side of this equation represents the changing rate of wave action density over time;the second and third items represent the propagation of wave energy in the x and y directions,respectively;the fourth item represents shifting of the relative frequency due to variations in depths and currents;and the fifth item represents the depth-induced and current-induced refraction.The item S on the right side of this equation includes dissipations,quadruplet interaction,and triad interaction caused by wind input,white capping,bottom friction,and depth-induced wave breaking.
These terms mentioned above denote,respectively,generation due to wind input,dissipations due to depth-induced wave breaking,bottom friction,white capping,and triad and quadruplet nonlinear wave-wave interactions(Cavaleri et al.,2007).Details of these processes can be found in the SWAN manual(SWAN Team,2010).
3.Study area and datasets
3.1.Wind data of Typhoon Kai-tak
Typhoon Kai-tak,known in the Philippines as Tropical Storm Helen,was a mild tropical cyclone that affected China,Vietnam,and Laos.It was the seventh typhoon and the thirteenth named storm of the 2012 Pacific typhoon season.The storm killed up to 40 people and caused a loss of 315 million dollars.Typhoon Kai-tak originated from an area in the Pacific Ocean on the evening of August 12,2012,then moved to the west,and developed into a severe tropical storm offshore of Luzon in the Philippines.It intensified into a typhoon on the surface of the northern SCS,was then downgraded into a tropical depression at 14:00 p.m.on August 18,and slowly dissipated after that.The track of Typhoon Kai-tak is illustrated in Fig.1.
3.2.Study area
The SCS is a marginal sea,a part of the Pacific Ocean,encompassing an area of around 3.5×10⁶km2from the Singapore and Malacca Straits to the Taiwan Strait.James Shoal,about 2000 km from Guangdong Province,is located in the southern most part of China.The SCS is the deepest sea in China.The average water depth is about 1212 m,and the maximum depth of the middle of the abyssal plain reaches 5567 m.
This study focuses on all the areas of the SCS.The computational domain of the SWAN model,from 0°N to 32°N and 102°E to 130°E,covers the SCS,as shown in Fig.2.
In this study,the SWAN model was adopted for numerical calculation with the nesting method,as shown in Fig.2.The large grid(Domain 1)was used to calculate the wave height,wave direction,wave period,and some other characteristic values of the SCS and its surrounding waters,providing the boundary conditions for calculation of the small grid(Domain 2).The small grid(Domain 2)was used to calculate the wave characteristic values of the Beibuwan Gulf,the Qiongzhou Strait,and the surrounding waters.
3.3.Bathymetry
The bathymetric data for the SCS were provided by the United States National Geophysical Data Center(NGDC)of the National Oceanic and Atmospheric Administration(NOAA)(Amante and Barry,2009).

Fig.1.Track of Typhoon Kai-tak.

Fig.2.Two nested domains in SWAN modeling system.
The coastline was supplied by a global self-consistent,hierarchical,high-resolution geographical(GSHHG)database(http://www.ngdc.noaa.gov/ngdc.html).Thisdatabasewas amalgamated from three databases in the public domain:World Vector Shorelines(WVS),CIA World Data Bank II(WDBII),and Atlas of the Cryosphere(AC).The latest release data of bathymetry(Version 2.3.4 released on January 1,2015)was used in this study.
The topography was interpolated from the global ETOPO1.ETOPO are the digital terrain elevation data released by the United States NGDC,including data about land elevation and sea bottom topography.ETOPO terrain data have a total offive specifications.ETOPO1,adopted in this study,are the global relief data with the best effect and highest precision.They constitute a 1 arc-minute global relief model of Earth's surface that integrates land topography and ocean bathymetry.The database was built from numerous global and regional data sets,and is available in “Ice Surface”(top of Antarctic and Greenland ice sheets)and “Bedrock”(base of the ice sheets)versions.
The spatial resolution of the bathymetric data source is 1× 1and the bathymetry is shown in Fig.3.In other words,it represents a spatial resolution of 1.3 km×1.8 km.Based on the terrain data,the topographic map of the SCS is shown in Fig.3.
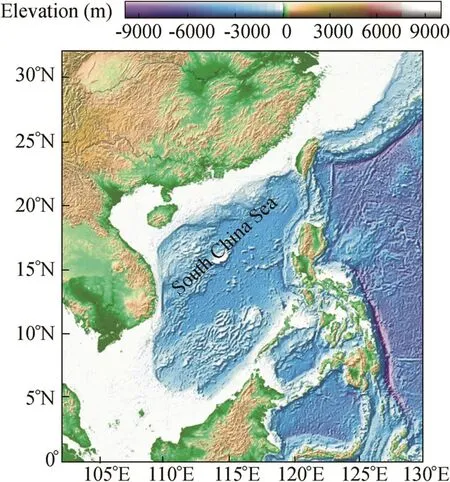
Fig.3.Topographic map of computational Domain 1 based on ETOPO1.
4.Set-up of SWAN model
In this study,the SWAN cycle III version 41.01 was used for wave simulations.The model was executed in the third generation and non-stationary mode with spherical coordinates.Both linear and exponential wind input growths were included in the model.The grid definitions in this study and recommended values for computational grid discretization in the SWAN model are summarized in Table 1.Formulations of available physical processes and their associated coefficients included in the model are summarized in Table 2.
5.Discussion
A few sensitivity analyses were performed to obtain optimal model settings for time step,grid resolution,and angle resolution.
5.1.Sensitivity analysis for time step
In order to determine the time step,the calculation time steps were set as 60 min,30 min,20 min,and 10 min.The results of significant wave heights in the four different conditions are shown in Fig.4.The calculated significant wave heights are lower than the measured values when the calculation time step is the same as that of the wind field.This shows that the simulation result is unsatisfactory when using a relatively larger time step.When the time steps were set as 10 min,20 min,and 30 min,the accuracy of simulation improved significantly.It can be found that the simulation result was best when the time step was 10 min.Therefore,the time step of 10 min was selected in the subsequent calculations.
5.2.Sensitivity analysis for grid resolution
To avoid the deviation caused by the wind field interpolated into the computing grid,the resolutions of the wind field and computing grid were set at the same level when verifying the impact of the computing grid resolution on simulation results.Grid resolutions were selected at four different calculation values:0.05°,0.10°,0.15°,and 0.20°.The comparison of calculated significant wave heights with different grid resolutions is shown in Fig.5.When the computing grid resolutions were set as 0.20°and 0.15°,both simulation results were less ideal than the observed results.When the computing grid resolutions were set as 0.05°and 0.10°,both simulation results were satisfied,and there was almost no difference in the significant wave heights simulated with the computing grid resolutions of 0.05°and 0.10°.To improve the calculation efficiency,the angle resolution of 0.10°was selected as the computing grid.
5.3.Sensitivity analysis for angle resolution
The SWAN model is calculated in the space of a twodimensional spectrum on a directional spectrum.It is suggested that the angle resolutions be set between 2°and 5°when calculating swells but between 10°and 15°when calculating wind and waves.In this study,the values of 10.00°,11.25°,12.50°,and 15.00°were selected for calculation.The comparison results of significant wave heights at four different angle resolutions are shown in Fig.6.When the angle resolutions were set at 11.25°,12.50°,and 15.00°,the simulation results were close to one another.When the angle resolution was set as 10.00°,the simulation result was superior to those of other angle resolutions.Therefore,the angle resolution of 10.00°was selected for the calculation.That is,360°was divided into 36 parts in the direction of the angle.
6.Summary and conclusions
The atmospheric driving forces of the typhoon wave model(pressure and wind fields)have been simulated by a blended wind field consisting of Fujita's model and Takahashi's model.The topography files obtained from NOAA were selected,and the typhoon waves driven by Typhoon Kai-tak over the SCS in 2012 were simulated based on the SWAN model.The SWAN model was successfully implemented for Typhoon Kai-tak over the SCS with the purpose of constituting a database for various typhoon wave parameters.This database can be used to comprehensively examine wave energy potential and long-term changes in wind-wave climate,and perform extreme value statistics to come up with design parameters.To validate the SWAN model,measured data were obtained from a buoy station.The results showed that the extreme wave heights calculated by the SWAN model agreed with the measured values when an accurate wind field was provided.The SWAN model can accurately describe the development process of typhoon waves driven by Typhoon Kai-tak.

Table 1 Grid definitions in this study and recommended values for computational grid discretization in SWAN model(van der Westhuysen,2002).

Table 2 Formulations of available physical processes and their associated coefficients included in SWAN model for application.

Fig.4.Comparison of significant wave heights under influence of different time steps at a buoy station in 2012.

Fig.5.Comparison of significant wave heights under influence of different grid resolutions at a buoy station in 2012.

Fig.6.Comparison of significant wave heights under influence of different angle resolutions at a buoy station in 2012.
Through sensitivity analysis,it was found that the time step had a strong influence on the simulation results,while grid resolution and angle resolution had less of an influence.Based on this,the nested grids and the non-static schema under spherical coordinates were chosen.The spatial resolution of the model was set as 0.1°× 0.1°,the time step was set as 10 min,and the angle resolution was set as 10.00°.In the twodimensional spectral space of frequency and direction,frequency was distributed in logarithmic form and divided into 34 spectrums,from 0.04 Hz to 1.00 Hz.
The SCS is rather deep,as can be seen from the topographic map.At the edges of the SCS,the shallow water processes become significant,causing enhanced gradients in wave conditions.Therefore,for nearshore predictions,the present spatial resolution is possibly too crude.A simple solution to this problem is to apply the nesting facilities of the SWAN model,or to apply unstructured grids with varying spatial resolution.In addition,validation and calibration of wind fields against satellite data are recommended as well as application of wind fields with a finer spatial and temporal resolution,in order to further improve the quality of the wave model for the SCS.
杂志排行

Water Science and Engineering的其它文章
- Application of a hybrid multiscalar indicator in drought identification in Beijing and Guangzhou,China
- On relationship between curve numbers and phi indices
- Analysis of influence of observation operator on sequential data assimilation through soil temperature simulation with common land model
- Common effluent treatment plant(CETP):Reliability analysis and performance evaluation
- Disinfection of dairy wastewater effluent through solar photocatalysis processes
- Numerical study of hydrodynamic mechanism of dynamic tidal power