Common effluent treatment plant(CETP):Reliability analysis and performance evaluation
2018-11-15AshwiniPadalkarRakeshKumar
Ashwini V.Padalkar,Rakesh Kumar*
CSIR-National Environmental Engineering Research Institute(NEERI),Mumbai 400018,India
Abstract Common effluent treatment plants(CETPs)have been installed and are in operation at numerous industrial clusters throughout India.They serve to reduce effluent treatment cost,provide better collective treatment,and reduce land cost for small-scale industrial facilities that cannot afford individual treatment plants.Optimum working conditions for treatment of effluent to be at par with discharge standards is a major mandate for any CETP.In this study,the reliability and removal efficiencies(REs)of a CETP in the industrial area of Maharashtra State in India were examined.An established methodology was adopted to determine the effectiveness of the CETP in terms of biochemical oxygen demand(BOD),chemical oxygen demand(COD),total suspended solids(TSS),and oil and grease(O&G)concentrations.The CETP's compliance with respect to design standards and its operation were studied in detail.This paper highlights the results of RE and the coefficient of determination(R2)values obtained from the CETP data,estimates the pollutants removed at the highest and lowest rates over a period of time,and highlights the reasons for problem areas along with remedial measures.It was observed that,except O&G,all the parameters(BOD,COD,and TSS)showed fluctuations in removal efficiencies and their reliabilities.This situation can be improved by releasing effluent containing hydraulic and organic loading to the CETP as per standards and optimizing treatment processes,especially primary clari-flocculators and aeration tanks,both of which are important units of any CETP.
©2018 Hohai University.Production and hosting by Elsevier B.V.This is an open access article under the CC BY-NC-ND license(http://creativecommons.org/licenses/by-nc-nd/4.0/).
Keywords:Aeration tank;Clari-flocculator;Coefficient of reliability;Coefficient of variation;Common effluent treatment plant;Removal efficiency;Reliability analysis
1.Introduction
Common effluent treatment plants(CETPs)are treatment systems specifically designed for collective treatment of effluent generated from small-scale industrial facilities in an industrial cluster(Vyas et al.,2011).Individual effluent treatment plants(ETPs)generally face problems from lack of space,resources,capital cost,and specialized manpower for operation and maintenance,which are especially exacerbated for small-scale industrial facilities(Pathe et al.,2004).These problems are reduced by collective treatment of effluent from a large number of small-scale facilities at a single site where the effluent undergoes similar treatment to what it would be subjected to individually(Padalkar et al.,2016).This helps in terms of land conservation,better treatment at one location,easy operation and maintenance,and shared expenses.CETPs are designed to collect and treat effluent from a multitude of facilities,which can also require CETPs to deal with varying qualities and quantities of effluent(Vyas et al.,2011).Although equalization tanks present as a part of primary treatment in every CETP act to cause steady-state mechanisms in the effluent for further processing,there are a multitude of possible reasons for failure,including shock loads,damage to mixers,and clogging of pumps and plumbing systems,to mention a few(Du et al.,2014;Garcia et al.,2013).This can lead to non-homogenized effluent flowing to subsequent units,causing non-uniformity in the entire process in general,and leading to substandard quality of treated effluent(Padalkar et al.,2016).The effect of poor effluent treatment can technically be termed failure of the CETP,where the treated effluent pollutant concentrations exceed the standard discharge values(Al Saleem,2007).The extent of failures of a CETP may change sporadically or on a periodic basis,depending on the field conditions.Failures may be caused by different factors and the extent of failures may change according to the situation.Hence,it is difficult to predict these failures on a regular basis with short-term studies(Weirich et al.,2015).The closest alternative to studying the efficiency of a CETP is removal efficiency(RE),which is defined as the overall percentage of a pollutant removed by the CETP(Luo et al.,2014).It is used as a safer and quicker alternative for understanding the performance of a CETP at any point of time.This parameter merely requires quantitative data of inlet and outlet pollutants,which can be obtained through primary sources(actual first-hand sample collection and analysis)or secondary sources(collection of results obtained by second-hand or indirect sources).RE is currently the preferred option for assessing the performance evaluation of a treatment plant(Luo et al.,2014).This parameter,however,has its own advantages and limitations.It can be used to quickly assess the adequacy of a CETP for treatment of target pollutants.However,it cannot focus on the reasons causing substandard treatment and inadequate pollutant removal.Also,it cannot differentiate between the remediation measures,which could include design optimization,proper operation and maintenance,or variations in raw effluent hydraulic and pollutant loads.Moreover,RE values of a CETP can change on a daily or even hourly basis,which could make future system predictions all the more challenging(Golovko et al.,2014).
An alternate option to the study of RE is reliability study for a CETP,which takes into account the effluent coefficient of variation(Cv),the coefficient of reliability(Cr),pollutant discharge standards(as prescribed by the relevant regulatory body),and the probable confidence threshold,commonly considered to be 95%(Metcalf and Eddy,Inc.,2003).Reliability basically demonstrates the extent of predictive functioning of a CETP.It helps in estimation of(1)future probability of mechanism and system failures,(2)impacts of mechanism and system failures on the effluent quality,and(3)variation of treatment effectiveness under normal operating conditions(Alderson et al.,2015).It is incorporated as an important part of the future planning and design process of any treatment system to avoid failures and substandard effluent quality(Alderson et al.,2015).It is a very important parameter that has long-term implications for the effectiveness of treatment processes and protection of public health and the environment.Different techniques,including fault tree analysis,event tree analysis,failure modes,effect analysis,and critical component analysis,have been used by researchers to predict the reliability of a system(Metcalf and Eddy,Inc.,2003).This parameter however requires extensive data to account for all the possible variations occurring in the effluent treatment for different reasons,including member industrial batch and shift changes,manner of operation of treatment units,seasonal variations,operation and maintenance issues,and design and upgradation changes in the CETP.An alternative approach has been discussed in our previous research,which derived the relationship between RE and reliability(Padalkar et al.,2018).The coefficient of determination(R2)value thus obtained was shown to be exclusively dependent on the type of effluent from member facilities dominant in the study area.
This research is an extension of our previous work and aims to study the use of the R2value in improving the effectiveness of a CETP.This study has been performed to(1)compare the results of RE and R2values obtained from the CETP data,(2)estimate the pollutants removed at lower rates by the CETP over a period of time based on the results,(3)highlight the probable reasons for the problem areas,and(4)determine methods to eliminate problem areas.This study was based on previously collected and described data.Thus,this paper does not provide a repetition of sample collection,handling,and analysis.Past experience with CETPs was used as a basis for problem identification and improvement.The results of this study will help researchers obtain a quick overview of the treatment units,better understand and derive standards of effluent quality,and provide guidelines for readers in relevantfields.
2.Materials and methods
2.1.Introduction to study area
The CETP in this study was designed for collection and treatment of effluent from the chemical and textile industries in an industrial cluster in Maharashtra,India.More than 90%of the member facilities belonged to the red category,indicating that they were of a highly polluting type and their effluent would require adequate treatment measures before disposal.This CETP had a conventional mode of treatment consisting of primary(an equalization tank and primary clariflocculator)and secondary(an aeration tank and secondary clarifier)treatment processes.The type of member facility(chemical and textile)and the treatment system of this CETP can be considered representative of other CETPs,which deal with similar industries’effluent and treatment processes,and hence this CETP was chosen for further study.The CETP had a design capacity of 16000 m3/d and the treatment units comprised an equalization tank(with neutralization and surface aeration,and a retention time of 11 h),a clari-flocculation unit(using a high rate with a lamella separator,and a retention time of 3.6 h),an aeration tank with an activated sludge process(with either surface or diffused aeration),and a secondary clarifier unit(using a high rate with a lamella separator,and a retention time of 3.6 h)with a final outlet(with a retention time of 0.26 h).Fig.1 shows the layout of the treatment processes involved in the CETP examined in this study.

Fig.1.Operational layout of CETP in this study.
The quality of the effluent at the inlet and the outlet of the CETP was assessed using four parameters commonly studied for effluent:biochemical oxygen demand(BOD,in mg/L,at 27°C for three days with the Winkler azide method),chemical oxygen demand(COD,in mg/L,by acid digestion),total suspended solids(TSS,in mg/L,with the gravimetric method),and oil and grease(O&G,in mg/L,with the gravimetric method).The pH of effluent was measured using a pH meter.The data obtained from the CETP were for two years(2014-2016),in all seasons,and were obtained directly from the operational records of the plant.These data were sufficient to cover seasonal variations(wet and dry),peak loads,and other operational changes occurring within the CETP.The operational conditions used for analysis of physico-chemical parameters are given in Table 1.
2.2.Reliability analysis and coefficient of reliability
The reliability of a CETP is its capacity to demonstrate consistency in the system's ability to predict the treatment values obtained in the future by the system(Garrido-Baserba et al.,2014).A CETP is said to be more reliable when the values of pollutants in the effluent treated by the plant meet the set discharge standards more often as compared to those of a CETP that frequently exceeds the standards(Alderson et al.,2015).A probabilistic analysis method developed by Niku et al.(1979)has been used to determine the discharge threshold for effluent that would comply with the standard discharge values as prescribed by the governing bodies.This method has been recommended in many handbooks dealing with industrial and sewage effluent(Metcalf and Eddy,Inc.,2003).The model of reliability as developed by Niku et al.(1979)is given below:

where r is the reliability of plant and PFis the probability of failure.
This probability of failure is sensitive to the probabilistic distribution functions(PDFs)of the pollutant parameters under study.Thus,this PDF,when known,can be used to understand the times of exceedance of set standards for the parameters.It can also be used to predict the behavior of a CETP in the future and can help in setting a threshold value for a given parameter(Messaoud et al.,2013).The threshold value(t),i.e.,the average concentration of treated effluent to be maintained to ensure maximum compliance,to be set for a given pollutant parameter in the treated effluent of a CETP,to maintain the pollutant discharge limits within standards at all times,is based on the reliability of the plant under study.It is as follows:

where Csis the selected effluent concentration set by standards.
Niku et al.(1979)have modelled Crusing the given mathematical model:

where Z1-αis the standardized normal variate corresponding to the value of no exceedance probability at a confidence threshold of 1- α,where α is the significance level(Padalkar et al.,2018).
The confidence levels with their corresponding Z1-α-distribution values are given in Table 2 for ease of understanding of the concept of Cr.These values are common for all treatment plants in general.

Table 1 Operational parameters for CETP in treating textile and chemical effluent.

Table 2 Cumulative probabilities of standard normal distribution for given confidence threshold.
The values of Z1-αthus determined were used to plot Crfor arbitrary Cvvalues for confidence thresholds of 60%-99%.The confidence thresholds were selected only in the range of 60%-90%as Crvalues determined for confidence thresholds less than 60%were likely to demonstrate poorer performance results.It can also be assumed that any CETP working at a confidence threshold of 50%is highly unreliable and requires the implementation of major changes,rather than smaller improvements.The data were plotted to study the pattern of results obtained.As seen from Fig.2,Cris inversely proportional to Cv,i.e.,as the variability of data increases,there is a proportional decrease in the Crif the confidence threshold remains the same.For the same level of variability,Crincreases as the confidence threshold of 1-α decreases.An example is as follows:For a Cvvalue of 1.8 at a treatment plant,if the reliability of treatment is expected to be 95%,the value of Crwill be 0.689.However,if the confidence threshold is expected to be further increased to 99%,the value of Crwill be 0.590.This means that for the same Cv,the Crwill increase if the reliability is limited,i.e.,for an increase in the confidence threshold there is a decrease in Cr.This is logical as the design values for treatment are derived from Crand the standard concentrations for effluent discharge.If the Crvalues are high,for the same Cv,the design values will be accordingly high.Also,if the Crvalue has to be increased while the confidence threshold is kept constant,the Cvvalue has to be reduced for the effluent.This can be achieved by maintaining consistency in the quality of the effluent,which will reduce the standard deviation(SD)of the effluent.It can be observed that with confidence thresholds of 90%or higher(the threshold generally considered in most cases),the values of Crshow a general decreasing trend,as can be seen from Fig.2.This can be attributed to the inverse relationship between Crand reliability,i.e.,the higher the desired reliability,the lower the Crand thus the mean value of effluent needs to be.

Fig.2.Coefficient of reliability(Cr)corresponding to coefficient of variation(Cv)and confidence threshold.
The softwares used to perform all the tests were the IBM Statistical Package for the Social Sciences(IBM SPSS 17)and Microsoft Excel 7(MS Excel 7).These softwares were used to obtain the confidence threshold using Cvvalues for a CETP in an industrial area of Maharashtra by measuring the daily effluent characteristics used to examine the treated effluent quality.
2.3.Operational parameters to achieve desired concentration and percentage compliance
The minimum standards required for treated effluent discharge from the outlet of a CETP to a receiving water body depend on the type of member industries and the receiving water body.These discharge standards are set and governed by the Maharashtra Pollution Control Board(MPCB)in Maharashtra,India.The discharge point for the CETP under study was at a creek,which is in the category of marine coastal water.The pollutant discharge standards for this point are 100 mg/L of BOD,250 mg/L of COD,100 mg/L of TSS,and 20 mg/L of O&G(Eldho,2014).The application of Crfor setting effluent values can be demonstrated using an example:for a CETP discharging effluent into a river,if the Crvalue for BOD is 0.36,then to achieve 95%compliance of the effluent quality with the standard discharge values,the mean BOD concentration of the effluent should be,according to Eq.(2),t=0.36Cs.
The percentage of compliance of a CETP according to the discharge standards can be derived from the normal and lognormal of the effluent discharge values and their Cvvalues,and can be calculated as follows(Oliveira and von Sperling,2008;Padalkar et al.,2018):

where Xsis the permissible parameter concentration in mg/L and tis the actual mean effluent concentration in mg/L.
The value of 1-α can be determined from statistical textbooks(Montgomery and Runger,1999).The value of Z1-αcorresponds to the area covered by the standardized normal curve.This calculation can be illustrated by an example here:at a CETP,for mean operational values for the COD concentration of 540 mg/L and Cvof 0.35,based on standard discharge values of COD for 250 mg/L,the calculated Z1-αwill be 0.842 corresponding to a confidence threshold of 80%.This implies that if the same operating conditions are maintained for a particular CETP,the plant is expected to meet standard compliance values 80%of the time.
3.Results and discussion
3.1.Removal efficiency and reliability of CETP for pollutants under study
The parameters that are generally considered sufficient to assess the quality of effluent are pH,BOD,COD,TSS,and O&G.The values of pH for the effluent were found to be within the range of MPCB effluent discharge standards at all times(5.5-9.0)during the duration of study and thus will not be discussed further.The preliminary statistics used to describe the characteristics of the pollutant data are presented in Table 3.The monthly values for inlet and outlet effluent for all the four pollutants(BOD,COD,TSS,and O&G)along with their removal efficiencies are given in Fig.3.The CETP records showed that the plant was hydraulically and organically overloaded at all times.The actual hydraulic flow rate was approximately 23000 m3/d,which was considerably higher than the design flow rate of 16000 m3/d.It was also observed that the effluent characteristics showed fluctuations at the CETP inlet and the outlet.The changes in the inlet effluent characteristics could be attributed to the varying effluent quality from member facilities,their hydraulic load,and the type of industrial processes,which varied with time.The outlet effluent characteristics and REs depended on the inlet effluent loading and the conditions of the treatment units.The RE values for BOD,COD,TSS,and O&G ranged from 40%to 80%,10%-80%,0-80%,and 0-100%,respectively,indicating abroad range of removal from minimum to maximum.The design criteria for BOD,COD,TSS,and O&G values for incoming effluent from the member facilities for the CETP were 800 mg/L,1600 mg/L,500 mg/L,and 100 mg/L,respectively.It was observed from the data that the actual inlet effluent values for BOD and COD exceeded the inlet design standards by approximately 91%and 96%,respectively.This was estimated by calculating the exceedance percentage in a similar way to the calculation of RE.TSS inlet values exceeded standards approximately 55%of the time,while O&G was generally well below the inlet standards.This is likely to cause organic overloading to the treatment units of the CETP in terms of organic and inorganic matter.
It is essential that any treatment unit be loaded as per design under normal conditions.There are possibilities of shock loads,causing both overloading and underloading to the plant,which should be avoided to a feasible extent.Hydraulic and organic overload to primary clari-flocculators can severely impair the ability of the unit to flocculate,settle,and thicken the sludge adequately.Hydraulic overloading denotes that the overflow velocity exceeds the particle settling velocity causing current at the notches of weir overflow,forcing solids out of the tank.This can increase the organic loading and impact the subsequent treatment units.A higher liquid-tosolid ratio also increases pumping and treatment costs,as the removed sludge is liquid due to the high content of water in it.This can cause overloading in sludge digesters,thickeners,and decanter centrifuges as they are designed to treat solids but have to deal with liquid waste.Overloading in secondary clarifiers can reduce the unit capacity,causing short-circuiting and,thus,poor settling.In an aeration tank,the excess BOD and COD(referred to as organic loading henceforth)normally render the dissolved oxygen(DO)supply from aerators insufficient.This causes anoxic conditions,inducing sulphate formation and heavy metal precipitation of reduced sulphur compounds,including some commonly occurring compounds in effluent with poor DO,e.g.,H2S.This compound can promote the growth of filamentous bacteria in an aeration tank,which can cause sludge bulking,poor settling,and greater sludge wasting.Hydraulic overloading in an aeration tank can lead to reduced retention time,thus causing insufficient treatment(biodegradation)and substandard quality of treated effluent.
Based on the values of the water quality parameters at the inlet and outlet of the CETP,the reliability of the CETP was calculated for each of the parameters.The scatter plot for the reliability is given in Fig.4.
As can be seen from Fig.4,the reliability percentages of all the parameters show a large amount of variation.This can be attributed to the inconsistencies in the raw water quality as well as the inadequacy in effluent treatment.It is difficult to derive a logical conclusion from these varied reliability results regarding the effectiveness of the treatment units of the CETP.The reliability of the studied CETP showed identical patterns for BOD,COD,and TSS.However,the reliability in terms ofBOD was higher than that for COD and TSS.It was generally higher for BOD and TSS as compared to COD.Thus,the relationship between reliability and RE was considered to assess the overall working of the CETP.

Table 3 Preliminary statistics for description of effluent data characteristics.
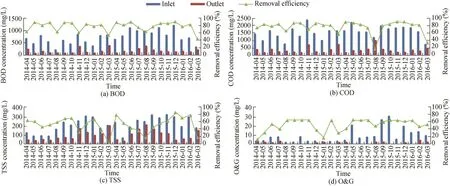
Fig.3.BOD,COD,TSS,and O&G concentrations in inlet and outlet effluent with removal efficiencies.
3.2.Establishing operating guidelines for CETP and examining relationship between removal efficiency and reliability of CETP

Fig.4.Scatter plot of reliability of CETP for physico-chemical parameters.
The values of Cvwere calculated for all the four daily effluent parameters for the years 2014-2016 for the CETP.Crvalues were then calculated as per Eq.(3)for each value corresponding to a(1-α)confidence threshold equal to 95%(α is a 5%significance level).This significance level was used to calculate the Z1-α-distribution and the values were determined by the NORMSDIST function in MS Excel software.The results of Cvand Crfor this study have been calculated for a confidence threshold of 95%.It can be observed from Table 3 that Cvvalues for treated effluent are well below 1.0 except for O&G,which is slightly greater than 1.0.It can be inferred from low Cvvalues that the effluent was treated considerably at the treatment units.This can also be verified from RE results described in Section 3.1.The lowest value for O&G was 0 mg/L,while the maximum values varied as per the discharges by member facilities and the treatment conditions.Thus,the SD of O&G values was much higher than the mean values,giving high Cvvalues for the parameter(Padalkar et al.,2018).Crhas an inverse relationship with Cv,which indicates that the reliability of a treatment plant is higher when the fluctuations in effluent quality are minimal.The derived Crvalues for BOD,COD,TSS,and O&G were 0.972,0.968,0.976,and 0.828,respectively.The effluent quality limits to be maintained at all times by the CETP(t)to achieve standard discharge limits prescribed by MPCB(Cs)under a given confidence threshold were calculated as per Eq.(2).The values obtained were 97.2 mg/L for BOD,242.0 mg/L for COD,97.6 mg/L for TSS,and 16.6 mg/L for O&G.These values are fully dependent on the incoming effluent characteristics,REs of treatment units,reliability,and the point of effluent discharge.These values are also generally more stringent for inland water bodies owing to their water usage.
Previous studies regarding the relationship between RE and reliability have indicated a strong correlation between the two parameters,which can be established through a regression equation,where O&G represents the preliminary treatment units,TSS represents the primary treatment units,BOD represents the secondary treatment units,and COD represents the overall working of the plant(Padalkar et al.,2018).High R2values(obtained by regression equations for the reliability and RE)for any parameter signify efficient working of the respective units,whereas R values(obtained by Pearson's correlation)show the correlations between various effluent quality parameters.The CETP under study showed a fairly good correlation for COD(R=0.71)and TSS(R=0.79)but not a considerably strong correlation for BOD(R=0.62)and O&G(R=0.66).It can be observed in Table 4 that at this CETP the chemical and textile effluent show higher R2values for COD,TSS,and O&G.It can be assumed from the correlation of RE and reliability for the present data and reconfirmation fromprevious studies that the CETP was successful in addressing 62%of the incoming BOD,71%of the COD,79%of the TSS,and 66%of the O&G.The weak correlation of reliability with RE for BOD indicated that biological degradation in the plant was not satisfactory and did not discharge effluent meeting the standards.This situation can be considerably improved by optimizing the operating conditions of the plant units.

Table 4 R2values for equations establishing relationships between RE and reliability.
3.3.Improving percentage of compliance of CETP for effluent pollutants
The primary indicator of the performance of a CETP is its treated effluent quality.Optimum design,regular operation and maintenance,and periodic checking of the treatment units can usually deliver satisfactory treatment performance.Primary and secondary clarifier tanks deal primarily with removal of TSS and organic matter associated with it.The efficient working of a clarifier depends on its solids separation and settling capacity,which can be enhanced by increasing the clarification capacity of the units(Goldblatt and Leitz,2015).This can be achieved either by enhanced chemical treatment,optimization of dosages of clarifying and flocculating agents,or using more efficient settling devices(Dang et al.,2017).Efficient solid settling causes thicker sludge,which can be handled,dewatered,and treated easily.Primary clariflocculators can be subjected to chemical treatment,which is not required for secondary clarifiers,as biological sludge is generally settleable(Parker and Günthert,2014).Chemical addition to secondary clarifiers is also not desirable as it might hamper the existence of active biomass,which is recirculated to the aeration tank for biomass maintenance.It is essential to optimize the settling and removal of TSS from primary clariflocculators.Excessive removal of organic matter with settling and removal of TSS from the primary clarifier can cause severe organic under loading to subsequent treatment units.If the BOD loading in the aeration tank falls below 0.25-0.35 kg of BOD per kg of mixed liquor volatile suspended solids(MLVSS)per day,it can cause a severe drop in the food to microbe(F/M)ratio,causing microbial starving and prevailing of nitrification conditions(Amanatidou et al.,2015).This reduces the oxygen demand of the effluent as the nitrogenous organic matter has been oxidized,however with a subsequent increase in the oxygen demand required for aeration,causing increased unnecessary costs(Hreiz et al.,2015).Secondary clarifiers should be designed with rapid and automated sludge withdrawal systems for rapid sludge withdrawal prior to the sludge turning anoxic.Weirs should be on a level,should be clean,and should have a sharp saw-tooth type design,and baffles should be provided for uniform flow distribution and reduced effluent velocity.
Aerators should be checked for malfunctioning,including blockages and fouling.The organic loading to the aeration tank should always be as per the design standards to avoid anoxic conditions and further associated problems.In the case of shock loads,if high organic loading to the aeration tank cannot be avoided,inlet hydraulic flow to the aeration tank should be reduced.An oxygen supply of 1.5 kg of O2per kg of BOD loading orDO concentrations in the range of 1.5-2.0 mg/L should be maintained in the aeration tank at all times to prevent anoxic conditions and formation of undesirable degradation products(Metcalf and Eddy,Inc.,2003).This can be aided by the addition of a pre-chlorination or preaeration unit at a point prior to the aeration tank,which can also be used to reduce the growth of filamentous microbes(Bahadori,2014).Biomass recirculation in the form of return activated sludge(RAS)should be maintained at 10%-40%for mechanically aerated treatment units and 20%-40%for diffused aerated treatment units for optimization of the F/M ratio(Schmit et al.,2009).Active biomass in the form of mixed liquor suspended solids(MLSS)should be in the range of 3000-6000 mg/L and should be determined experimentally depending on the effluent type.Excess MLSS can be controlled by wasting the sludge in excess and by reducing RAS feed to the aeration tank.Sludge settleability in the form of sludge volume index(SVI)and sludge age should be determined periodically and the SVI should be maintained at approximately 100,while the sludge age should range from three to 15 days(Metcalf and Eddy,Inc.,2003).Settled sludge should be removed continuously or at regular intervals to avoid sludge septicity.The DO concentration of 1.0 mg/L should essentially be present in the treated effluent unit to prevent generation of undesirable anoxic compounds.
4.Conclusions
The efficiency of any treatment plant,especially a CETP,depends on its optimum design and functioning and also strict compliance by member facilities.It is not always possible for the CETP to work in optimum conditions.However,it is recommended that the chances of failure be reduced to a few cases per year.Major steps need to be taken on this account by the CETP and member facilities as well.
(1)To achieve high reliability,the variability in the quality of the raw water entering the CETP should be monitored and controlled.This can be achieved by notifying all the member facilities that they should follow inlet discharge standards prescribed to them by the governing body,i.e.,MPCB in this case.The framework formulated by MPCB and stipulated in the consent-to-operate form should be strictly followed by each member facility.
(2)Biological treatment units can be optimized by maintaining a healthy biomass and F/M ratio.The recalcitrant compounds in the effluent should be identified and priority should be given to removing them either at the facility level or at the CETP treatment units.
(3)At the facility level,heavy metals can be removed by physical adsorption,bioadsorption,membrane filtration,lime precipitation(for heavy metal concentrations higher than 1000 mg/L),ion exchange,electrodialysis,reverse osmosis,ultrafiltration,or photocatalysis(Barakat,2011;Gunatilake,2015; Hegazi,2013).Recalcitrant and high COD effluent can be treated by wet air oxidation,physical adsorption(with powdered activated charcoal),a microwave discharge electrodeless lamp-assisted Fenton process,and cavitation(Davies and Kaplan,1966;Li et al.,2015;Luan et al.,2012).
(4)At the CETP,reduction in sludge wasting can be attempted in order to increase the sludge retention time and the active biomass for obtaining maximum biodegradation of organic matter.Membrane bioreactors can be used in place of the conventional activated sludge process to operate effluent at higher MLSS(thus,higher MLVSS)and higher BOD concentration to increase the competitive biomass,thus enhancing biodegradation.
(5)Bed bioreactors can also be moved,as an efficient alternative to membrane bioreactors,in order to maintain the biomass and increase sludge retention,as well as to increase contact time between the refractory organics and biomass,thus causing enhanced biodegradation.
(6)The MLVSS in the conventional activated sludge process can also be increased through bioaugmentation in the activated sludge process,when upgradation of the treatment units is not possible.
(7)The facilities discharging effluent with a high pollution load(i.e.,red category industries)should be charged more for the cost of operation and maintenance as compared to other factories.Upgradation of the capacity of any member facility or changes in product processes,capacity,or types should be carried out strictly in consultation with the CETP.
(8)Online monitors should be installed,calibrated,and monitored for flow rate,pH,COD,TSS,and DO at the inlet and outlet of the CETP as well as in the aeration tanks.Workshops and training programs should be frequently conducted for training the CETP personnel regarding CETP operation and maintenance.
Acknowledgements
Ashwini V.Padalkar would like to thank University Grants Commission(UGC)for JRF and SRF fellowship.Authors are also thankful to CSIR-National Environmental Engineering Research Institute(NEERI,Mumbai Zonal Lab)and Maharashtra Pollution Control Board(MPCB)for their support and cooperation during the course of the research.
杂志排行

Water Science and Engineering的其它文章
- Application of a hybrid multiscalar indicator in drought identification in Beijing and Guangzhou,China
- On relationship between curve numbers and phi indices
- Analysis of influence of observation operator on sequential data assimilation through soil temperature simulation with common land model
- Disinfection of dairy wastewater effluent through solar photocatalysis processes
- Numerical study of hydrodynamic mechanism of dynamic tidal power
- Evaluation of numerical wave model for typhoon wave simulation in South China Sea