On relationship between curve numbers and phi indices
2018-11-15DavidChin
David A.Chin
Department of Civil,Architectural,and Environmental Engineering,University of Miami,Coral Gables,FL 33124,USA
Abstract The curve number and phi(φ)-index models each provide a simple one-parameter relationship between storm-event rainfall and runoff.It is shown that the curve number and φ-index models can both be used to segregate the rainfall hyetograph into initial abstraction,retention,and runoff amounts.However,the principal advantages of the φ-index model are that both rainfall distribution and duration can be explicitly taken into account in calculating runoff,and the φ index is more physically based than the curve number.The quantitative relationship between the curve number and the φ index is presented and validated with field measurements.Knowing the relationship between the curve number and the φ index is useful in that it facilitates using the extensive database of curve numbers in the more realistic φ-index model in calculating a runoff hydrograph from a given rainfall hyetograph.It is demonstrated that conventional adjustments to curve numbers can be largely explained by variations in storm duration,which suggests that variable rainfall duration can possibly be an essential factor in accounting for deviations from the median curve number of a catchment.
©2018 Hohai University.Production and hosting by Elsevier B.V.This is an open access article under the CC BY-NC-ND license(http://creativecommons.org/licenses/by-nc-nd/4.0/).
Keywords:Infiltration;Rainfall;Runoff;Curve number;φ index;Storm duration
1.Introduction
The curve number model is an enigmatic empirical model that parameterizes the relationship between storm-event rainfall and the corresponding runoff using a single abstraction parameter:the curve number.The validity of the curve number model is primarily based on the observation that the functional form of the rainfall-runoff relationship embodied in the curve number model approximately mimics observations.The most remarkable and controversial feature of the curve number model is that it uses a single parameter to account for all of the fundamental hydrologic processes that influence the relationship between rainfall and runoff.In particular,the temporal distribution of rainfall and the abstraction process are not explicitly represented in the curve number model,which leads to uncertainties both in the mechanism of runoff represented by the model and the catchment conditions under which the model might be valid.
The phi(φ)-index model is another one-parameter model that relates runoff to rainfall.The φ index of a catchment is defined as the constant infiltration capacity that would yield the actual total runoff for a given rainfall amount.In principle,the magnitude of the φ index is bounded between the maximum and minimum average infiltration capacities of the catchment during a rainfall event.Although the curve number and φ-index models are both limited in that they use only one parameter to relate rainfall to runoff,the φ-index parameter differs from the curve number parameter in that the φ index has a physical meaning as a characteristic infiltration capacity of the catchment.
Important practical limitations of the conventional curve number model are that it overestimates the initial abstraction prior to the beginning of runoff(typically by a factor of around 4),and it does not account for variations in the duration of rainfall events in estimating runoff.In contrast,the φ-index model is capable of providing realistic estimates of the initial abstraction when the primary abstraction mechanism is infiltration,and the φ-index model explicitly takes into account the duration of a rainfall event in estimating runoff.An advantage of the curve number model over the φ-index model is that there is a substantial database of handbook-recommended curve number values for use in ungauged basins,whereas such databases do not exist for φ values.
Aside from the aforementioned differences,the curve number and φ-index models share the common limitation that curve number and φ values only approach constant values after some minimum amount of rainfall,and this limitation is not usually taken into account.Since the φ-index model gives a physical representation of the rainfall-runoff process,in contrast to the empirical representation of the curve number model,and both models are one-parameter models,this paper investigates,for the first time in the open literature,the quantitative relationship between the curve number and the φ index,and also uses the physically based φ-index model to provide insight into the rainfall-runoff mechanism represented in the curve number model.By providing a relationship between the curve number and the φ index,opportunities to apply the φ-index model are enhanced,since the extensive database used for estimating curve numbers in ungauged basins can now be used to estimate corresponding φ values and facilitate application of the physically based φ-index model,which does not have some of the key limitations associated with the curve number model.
2.Background
2.1.Curve number model
The curve number model was developed in the 1950s under the leadership of the United States Department of Agriculture(USDA)Soil Conservation Service as a planning tool to empirically represent the average relationship between stormevent rainfall,P,and the corresponding runoff,Q.The relationship between P and Q embodied in the curve number model is shown in Fig.1,where different curves correspond to different catchment conditions,and each curve is associated with a curve number(CN).Each rainfall-runoff curve is characterized by an initial abstraction,Ia,that must be satisfied before any runoff occurs.

Fig.1.Conventional curve number model.
The actual model parameter that distinguishes the curves shown in Fig.1 is an abstract quantity called the potential maximum retention,S.The relationships between P,Q,Ia,and S are embodied in the following two equations:

where F is the cumulative infiltration after the initial abstraction.Eq.(1)is a conservation-of-mass relationship that accounts for the partitioning of P into Ia,Q,and F,and Eq.(2)is the basic functional assumption of the curve number model that the ratio of the runoff(Q)to the maximum possible runoff(P-Ia)is equal to the ratio of the infiltration(F)to the maximum possible post-initial-abstraction infiltration,as quantified by the potential maximum retention(S).Combining Eqs.(1)and(2)to eliminate F yields

To further reduce Eq.(3),the model developers assumed that Iais a fixed fraction,λ,of S,such that Ia= λS.Eq.(3)becomes

This equation relates Q to P in terms of the two parameters λ and S.The curve number,CN,is simply a normalized potential maximum retention,S,such that 0<S<∞ maps into 0<CN<100.The curve number is related to the potential maximum retention as follows:

where S is in cm.For Eq.(4)to be a one-parameter equation,λ must be specified as a fixed value.The conventional curve number model fixes λ=0.2,and conventional curve numbers are conditioned on this assumption.Subsequent studies at sites around the world have indicated that λ≈0.05 provides a much better fit with observations that were used in the original development of the curve number model(Lal et al.,2015,2017;D'Asaro et al.,2014;Fu et al.,2011;Hawkins et al.,2009;Baltas et al.,2007).However,the conventional formulation with λ=0.2 remains the standard.Values of CN corresponding to λ=0.2 are different from the values of CN corresponding to λ=0.05,so this distinction is important.
In the conventional curve number model,CN is taken to be a function of soil type,land use,and land cover in the catchment.To account for the hydrologic effects of various soil types,four hydrologic soil groups(HSGs)have been defined by USDA.These HSGs are designated as A,B,C,and D,where the different soil groups are delineated by their minimum infiltration capacities.The minimum infiltration capacities of the various soil groups are A:larger than 0.76 cm/h,B:0.38-0.76 cm/h,C:0.13-0.38 cm/h,and D:less than 0.13 cm/h.
Further details of the conventional curve number model are provided in the Natural Resources Conservation Service(NRCS)National Engineering Handbook:Part 630/Hydrology(NRCS,2017),and a cogent summary of the limitations of applying the curve number model can be found in Ogden et al.(2017).
2.2.φ-index model
The φ-index model is perhaps the most widely used index model in hydrology,and references to this model can be found in most reputable texts and handbooks of hydrology(e.g.,McCuen,2017;Gupta,2017;Singh,1992;ASCE,1996).The φ index is equal to the constant infiltration capacity of a catchment that would be necessary to accurately partition the rainfall into runoff and infiltration.Unlike the curve number model,which yields the total runoff for a given total rainfall,the φ-index model is applied at incremental time steps, Δt,within a rainfall event.For any given rainfall event,the total runoff,Q,determined using the φ-index model is given by

where N is the number of incremental time steps in the rainfall event,ΔPiis the rainfall increment in the ith time step,and fiis the average infiltration rate during the ith time step,given by
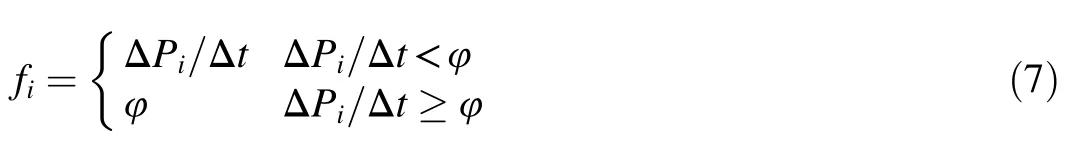
Eq.(7)states that the infiltration rate is equal to the rainfall intensity when the intensity is less than φ,and the infiltration rate is equal to φ when the rainfall rate is greater than or equal to φ.This represents the classic rainfall-excess(Hortonian)mechanism of runoff.In cases in which a catchment is not homogeneous and infiltration-excess runoffoccurs,the catchment-averaged φ index can be estimated by taking an area-weighted average of the φ indices of the sub-areas within the catchment.In cases in which saturation-excess runoff occurs,the situation is more complicated since saturated conditions can occur over variable subareas within the catchment and the extent of saturation excess could depend on the amount of rainfall.With this in mind,the results presented here are primarily applicable to catchments where runoff is generated by infiltration excess.
2.3.Model comparison
The partitioning of a hyetograph into initial abstraction,Ia,cumulative infiltration,F,and runoff,Q,using both the curve number and φ-index models is illustrated in Fig.2.
The key difference between the curve number and φ-index models is that the curve number model yields only the storm-event total values of Ia,Q,and F for given values of P and S,whereas the φ-index model partitions the incremental rainfall amounts into incremental contributions to Ia,Q,and F.As a consequence,the φ-index model explicitly takes into account both the rainfall duration and the rainfall distribution,which are not taken into account by the curve number model.It should be noted that application of the curve number model to cumulative precipitation within a rainfall event is inconsistent with the development and formulation of the curve number model,and incremental application of the curve number model can lead to unrealistic infiltration predictions(Chin,2013).Not taking rainfall duration into account has long been cited as a limitation of the curve number model,since a given rainfall,P,over a short duration would be expected to yield more runoff than P over a longer duration.However,the curve number model yields the same runoff regardless of duration.The role of rainfall distribution is subtler,and its potential importance can be illustrated by an example.For a given rainfall duration and constant infiltration capacity,a constant rainfall distribution that is less than the infiltration capacity would yield zero runoff,whereas a rainfall distribution with highintensity bursts greater than the infiltration capacity would yield non-zero runoff,even if both events have the same P and duration.In spite of this reality,the curve number model would give the same runoff in both cases.
There have been few attempts to explicitly account for the rainfall duration in the curve number model.A seminal attempt to incorporate rainfall duration into the curve number model was made by Jain et al.(2006),who incorporated the rainfall duration by adjusting the actual storm-event rainfall amount,P,by a factor that is a function of the ratio of the actual storm duration to the long-term average storm duration.This modified curve number model performed significantly better than the standard curve number model,thereby demonstrating the importance of accounting for rainfall duration in accurately modeling the rainfall runoff relationship.A recent investigation reported by Lal et al.(2017)showed that,for selected plot-scale catchments in India,catchment values of CN were most highly correlated with the infiltration capacity of the soils in the catchment.Since the catchment-averaged infiltration capacity is approximated by φ,the results of Lal et al.(2017)give field-measurement support to the fundamental assertion of this investigation that a relationship can be established between CN and φ.
3.Methodology
The methodology for estimating the runoff,Q,from a given rainfall distribution and catchment-averaged φ index is illustrated in Fig.2.The rainfall event has a duration td,and the total storm-event rainfall is P.For each time interval,Δt,the rainfall increment isΔP,and the rainfall intensity is i= ΔP/Δt.

Fig.2.Partitioning of rainfall.
3.1.Conventional synthetic rainfall distributions
The NRCS 24-h rainfall distributions are widely used in engineering applications in the United States.These distributions are categorized into four standard rainfall types(I,IA,II,and III),each being applicable to different geographic regions of the United States.The standard rainfall distributions were derived from local intensity-duration-frequency(IDF)curves using an alternating-block approach with 0.1-h intervals.The method used in constructing the standard 24-h rainfall distributions allows these distributions to be used in the design of stormwater management systems without knowledge of the critical design-storm duration that would cause worst-case conditions,such as the peak catchment runoff.The fact that a constant IDF curve is nested within each of the standard 24-h rainfall distributions allows each rainfall distribution to be temporally downscaled into storm events that have durations shorter than 24 h,with all downscaled distributions having the same nested IDF function.In current engineering practice,the four standard NRCS rainfall distributions are regarded as rough approximations of local conditions,with the appropriate volume from the National Oceanic and Atmospheric Administration(NOAA)Atlas 14(e.g.,Bonnin et al.,2006)being the preferred source of data for constructing location-specific rainfall distributions of any duration based on location specific IDF functions(NRCS,2017).
3.2.Downscaling conventional rainfall distributions
A rainfall distribution of any duration,td,less than or equal to 24 h can be derived from any of the four standard NRCS 24-h rainfall distributions by downscaling.The downscaling technique described below preserves the IDF curve that is nested within the NRCS 24-h rainfall distribution.Hence,all downscaled rainfall distributions have the same IDF function that is characteristic of the catchment area.The steps followed in downscaling the 24-h rainfall distribution are described below.
Step 1:The standard 24-h rainfall distribution is divided into intervals with Δt=0.1 h.Standard rainfall distributions can be obtained directly from the NRCS National Engineering Handbook:Part 630/Hydrology(NRCS,2017)or indirectly from approximate analytic expressions given by Froehlich(2009).
Step 2:The time interval with the maximum rainfall increment,ΔP1,is located and extracted.Adjacent rainfall increments are sequentially extracted in the order of decreasing magnitude until the duration of the set of extracted increments is equal to the desired duration,td,i.e.,N increments are extracted where NΔt=td.The extracted rainfall increments are placed in the same sequence as in the 24-h rainfall distribution.
Step 3:The rainfall increments are adjusted by a constant factor to ensure that the total rainfall amount in the downscaled rainfall distribution is equal to P.The adjusted rainfall increments,ΔPn,are given by
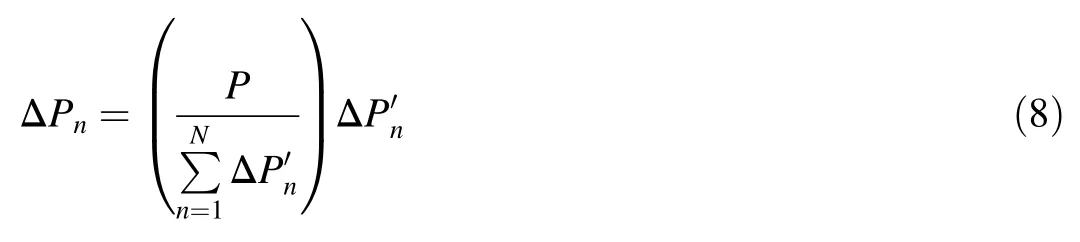
The downscaled rainfall distribution has the same nested IDF curve as the standard 24-h rainfall distribution.
3.3.Statistics of rainfall duration
The statistics of rainfall durations,td,across the United States have been reported by the United States Environmental Protection Agency(USEPA,1986),with other regional studies of rainfall duration also reported in the open technical literature(e.g.,Asquith et al.,2006).The meanand coefficient of variation(COV)of rainfall durations for the nine regions of the United States shown in Fig.3 are tabulated in Table 1.
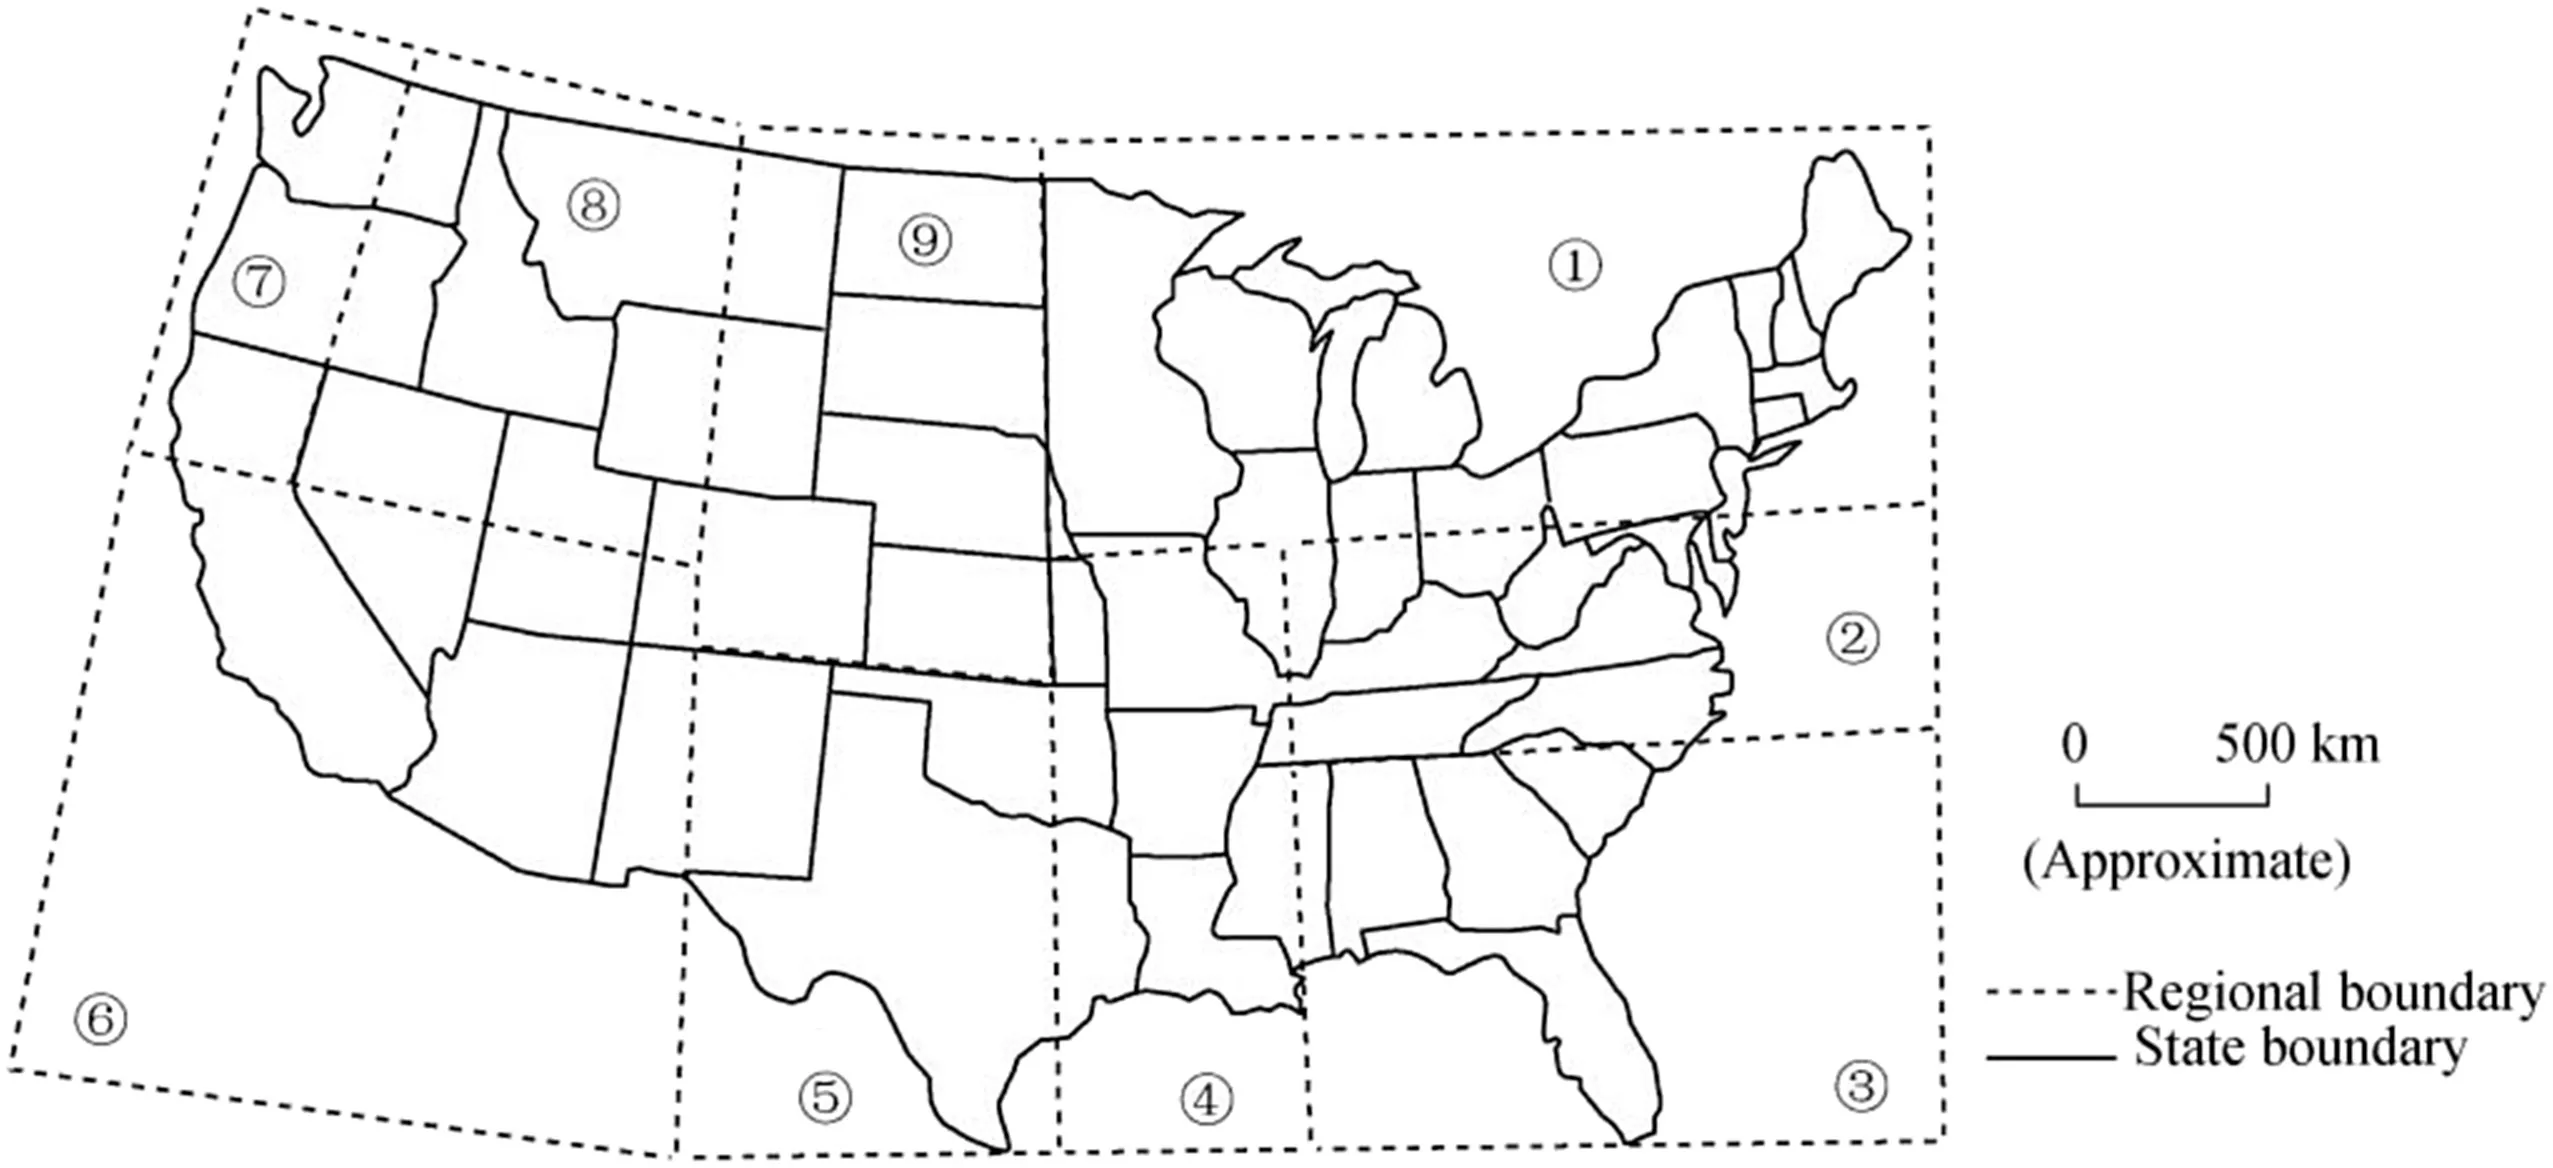
Fig.3.Regions used in rainfall duration analysis.
It is apparent from Table 1 that,with the exception of Region 7,the statistics of the rainfall duration,td,are fairly similar,with 3.6 h<<7.3 h and 0.92<COV<1.23.It has further been found that the frequency distribution of tdis best described by a gamma distribution(USEPA,1986),which yields the 10-,50-,and 90-percentile event durations(t10,t50,and t90)as shown in Table 1.Most of the United States can be characterized by Type II rainfall and,for the illustrative purpose of this study,the average statistics of regions 8 and 9 have been selected to approximately represent the typical statistics of Type II rainfall in the United States.Using the statistics shown in Table 1,the 10-,50-,and 90-percentile representative rainfall durations are considered approximately to be 0.5 h,3.0 h,and 10.5 h,respectively.
3.4.Statistics of rainfall depth
A review of the United States rainfall statistics(Hershfield,1961)shows that,in areas covered by Type II rainfall,3-h events with return periods of 25 years or less generally have rainfall amounts of less than 15 cm.Since it is unlikely that the rainfall events used in estimating curve numbers have return periods greater than 25 years,it will be assumed that rainfall amounts of less than 15 cm are used in calibrating and validating the curve number model.
3.5.Estimation of runoff
For any given synthetic rainfall distribution,the runoff obtained with the curve number model was estimated usingEq.(4),with the conventional specification of λ=0.2,and the runoff obtained with the φ-index model was estimated using Eq.(6).Each of these models generates a relationship between the storm-event runoff,Q,and the rainfall,P,for given values of tdand φ.

Table 1 Statistics of rainfall duration in nine regions of the United States.
4.Results and discussion
Based on the methodology described in the previous section,with a Type II rainfall distribution and a median stormevent duration of 3 h,the calculated relationship between Q and P for selected values of φ in the range of 0-23 cm/h is shown in Fig.4.
The rainfall amount,P,was limited to less than 15 cm(solid lines)to be consistent with that of a typical median event duration of 3 h.Comparing the Q versus P relationship in Fig.4 with the curve number model relationship shown in Fig.1,it is apparent that the one-parameter φ-index model replicates the key features of the Q versus P relationship.These key features are(1)the presence of an initial abstraction that must be fulfilled before any runoff occurs,and(2)the existence of different Q versus P curves that correspond to different catchment conditions.The capability of the φ-index model of replicating the key features of the curve number model is particularly important,since these key features are foundational to the validity of the curve number model.

Fig.4.Rainfall-runoff relationship given by φ-index model for event duration of 3 h.
4.1.Relationship between CN and φ
The relationship between CN and φ was investigated by selecting various values of φ and finding the corresponding value of CN that minimizes the root-mean-square difference(RMSD)in the Q versus P relationship.A median rainfall duration of 3 h and a Type II rainfall distribution were assumed.The best-fit relationships between CN and φ for maximum rainfall amounts(Pmax)of 7.6 cm and 15.0 cm are shown in Fig.5.
The agreement in the CN-φ relationships is fairly good,indicating a relatively low sensitivity of the CN-φ relationship to Pmaxin the range of 7.6-15.0 cm.It should be noted that for Pmax=7.6 cm and φ>17.0 cm/h,the runoff(Q)is equal to zero and hence the CN-φ relationship cannot be calculated in this range.It should further be kept in mind that the CN-φ relationship shown in Fig.5 is for a median event duration of 3 h,which is typical for most of the central United States.The results shown in Fig.5 are not intended to have universal application,but are presented to demonstrate that,for a given typical location in the United States,a catchment-averaged φ index can be directly mapped into CN.An interesting observation from Fig.5 is that the infiltration capacities,φ,corresponding to typical CN values are much greater than the infiltration capacities associated with the various soil groups.For example,handbook-described catchment areas with HSGs of B,C,and D soils typically have CN values in the ranges 62-77,70-84,and 77-88,respectively(Hawkins et al.,2009), and, using the curves corresponding to Pmax=7.6 cm and 15.0 cm,Fig.5 shows corresponding φ values of 4.0-9.3 cm/h,2.2-6.2 cm/h,and 1.0-4.0 cm/h,respectively.The defined infiltration capacities of B,C,and D soils are 0.38-0.76 cm/h,0.13-0.38 cm/h,and less than 0.13 cm/h,respectively.These results collectively indicate that catchment-averaged infiltration capacities can be expected to be much greater than those indicated by just considering the infiltration capacities of the soil groups,particularly in the cases of B,C,and D soils.In reality,the infiltration capacities shown in Fig.5 are more representative of field-measured infiltration capacities than those associated with the HSGs(Chin and Patterson,2005).

Fig.5.Relationship between φ and CN for event duration of 3 h.
4.2.Comparison with theory
The curve number model requires that the difference between rainfall and runoff,P-Q,closely approaches(1+λ)S as P → ∞,which means that P-Q is required to approach 1.2S for λ =0.2.In the φ-index model,P-Q approaches φtdas P → ∞.Equating the asymptotes of the curve number and φ-index models,and using the definition of CN given by Eq.(5),yields
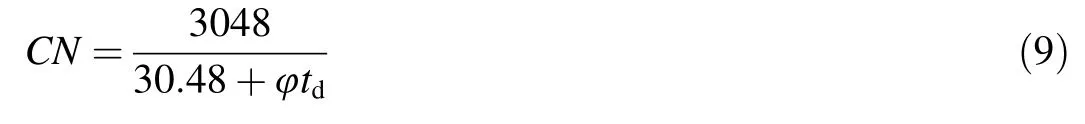
where φtdis in cm.The theoretical relationship given by Eq.(9)is contrasted with the calculated CN-φ relationship in Fig.5,where td=3 h,as is typical for most of the central United States.It is apparent from Fig.5 that the calculated and theoretical CN-φ relationships agree for φ < 2.5 cm/h and diverge for φ > 2.5 cm/h.The physical reason for the divergence for φ>2.5 cm/h is that for higher values of φ,the minimum rainfall amount P required for P-Q to approach φtdincreases beyond the range of practical rainfall amounts(0-15 cm)considered in this analysis.Important from a conceptual viewpoint is that Eq.(9)shows that the CN-φ relationship for any given rainfall event depends on the duration,td,of the rainfall event.Specifically,if φ is taken as the approximately fixed characteristic infiltration capacity of the catchment,then the associated curve number for any given rainfall event will be inversely proportional to the duration of the rainfall event.This result further reinforces the heuristic notion that the curve number of a catchment depends on the duration of the particular rainfall event under consideration.
4.3.Comparison with field measurements
Curve numbers derived from field measurements have been extensively analyzed by Hawkins(1993),with further discussion of these data by van Mullem et al.(2002).Curve numbers derived from field measurements generally depend on the amount of rainfall,P,for low rainfall amounts,and typically attain asymptotic values for higher rainfall amounts.To compare field data with theoretical results,the φ-index model was used to relate CN to P for fixed values of the catchment-averaged φ-index and for Type II rainfall events with a duration of 3 h.Field data originally presented by van Mullem et al.(2002)are compared with the φ-index model relationship in Fig.6.
The φ-index model results,represented by the solid lines in Fig.6,show that for a given average catchment infiltration capacity,quantified by the φ-index,the resulting runoff asymptotically converges to an approximately constant curve number,which supports the assertion that there is a direct relationship between the curve number and the φ index. It is important to note that for any given rainfall amount, P, the minimum curve number,CNmin,required to produce runoff is given by

Fig.6.Comparison of theory and measurements.

where P is in cm.This minimum curve number required to generate runoff is consistent with the CN-P relationship for different values of φ as shown in Fig.6.Hawkins(1993)identified three types of observed CN-P behavior:standard,violent,and complacent.The field data plotted in Fig.6,from van Mullem et al.(2002),show examples of these three types of behavior.Standard behavior was reflected in approximately 70%of the watersheds evaluated by Hawkins(1993),and it is estimated that approximately 80%of all small watersheds in the United States follow this pattern(Hawkins et al.,2009).The example of standard behavior shown in Fig.6 is from the W-TN Watershed in Georgia.These data indicate that CN gradually decreases to a constant value,and that the catchment area has an approximate φ index of 7 cm/h and a CN value of around 68.The example of violent behavior,from the Berea 6 Catchment in Kentucky,shows CN increasing rapidly and approaching a constant value,with the catchment area having an approximate φ index of 1 cm/h,and a CN value of around 88.The example of complacent behavior,from the Malheur NF Catchment in Oregon,shows CN gradually declining without approaching an asymptote.The φ-index model shows that complacent behavior is likely a result of the condition that the characteristic infiltration capacity of the catchment,as measured by the φ index,is sufficiently high and the CN of the catchment is sufficiently low that convergence to an asymptotic curve number does not occur within the range of rainfall amounts used in the determination of CN.Furthermore,the average infiltration capacity of the catchment area likely exceeds 14 cm/h.This physical explanation of complacent behavior has not previously been offered,but the physical reason for complacent behavior is quite clear when viewed in the context of the φ-index model.Collectively,the results presented here show that both the curve number model and the φ-index model are supported by field data,and the results shown in Fig.6 illustrate the relationship between CN and φ.Notably,the types of behavior shown in Fig.6 have also been observed at other sites around the world.For example,D'Asaro et al.(2014)observed the three types of CN versus P behavior in catchments in Sicily.
4.4.Effect of rainfall duration on runoff
In the conventional curve number model,the value of CN is typically assumed to predict the median value of the runoff,and the condition under which this occurs is referred to as antecedent runoff condition(ARC)II.The curve number under this condition is sometimes designated as CNII.The conditions that lead to the 10-and 90-percentile runoff amounts for the given value of P are defined as ARC I and ARC III,respectively,and the corresponding curve numbers are CNIand CNIII(Hawkins et al.,1985).To investigate the potential role of rainfall duration on runoff for fixed values of CNIIand φ,the Q versus P relationship for Type II rainfall distributions,with 10-and 90-percentile rainfall durations of 0.5 h and 10.5 h,respectively(typical of the central United States as shown in Table 1),was calculated and compared with the conventional Q versus P relationships under ARC I and ARC III conditions.These results are shown in Fig.7 for CNIIvalues of 95,80,65,and 50,which correspond to φ values of 0.51,2.8,7.6,and 15 cm/h,respectively.In accordance with the standard curve number model guidelines,the corresponding CNIvalues are 87,63,45,and 31,respectively,and the corresponding CNIIIvalues are 99,94,83,and 70,respectively.

Fig.7.Variability in runoff resulting from variations in rainfall duration.
The results shown in Fig.7 generally provide a strong indication that the range of runoff,Q,associated with any given storm-event rainfall,P,could be largely accounted for by variations in rainfall duration.This finding could have profound implications in hydrologic models that predict CN based on mapping moisture content and antecedent rainfall into an ARC.If the rainfall duration mechanism is indeed largely responsible for variations in runoff,Q,around a median value(for a given P),then moisture accounting and antecedent rainfall tracking would need to be supplemented by considerations of rainfall durations in predicting runoff using an ARC-adjusted curve number in the curve number model.In fact,the term antecedent runoff condition might be a misnomer,since the variation in runoff might be largely dependent on the variability in storm duration,which is not an antecedent condition.It should be kept in mind that the results presented here are based on synthetic rainfall distributions that are temporally downscaled from the conventional NRCS 24-h rainfall distributions.These results,although theoretical,strongly support further investigation using actual rainfall events and measured runoff to determine whether in fact rainfall duration is of comparable,or perhaps greater,importance than antecedent moisture content in accounting for deviations of the effective curve number from its median value in some circumstances.
5.Conclusions
The curve number model is firmly entrenched as an acceptable model(at least in the United States)for relating storm-event runoff to the corresponding rainfall.Using a NRCS Type II rainfall distribution along with a median rainfall duration of 3 h that is characteristic of areas represented by Type II rainfall,the relationship between Q and P predicted by the curve number model can be closely replicated by a φ-index model.These results provide a means for estimating the more abstract values of CN from more physical values of φ.Comparison of model results with field data show that observed relationships between CN and P generally approach the φindex model predictions after an initial period of transition following the initiation of runoff.The results presented here demonstrate that the minimum rainfall amount required for convergence to a constant curve number increases with increasing infiltration capacity of the catchment.This result is particularly important since attainment of a constant curve number is a basic requirement for the validity of the curve number model.Using synthetic rainfall distributions,this study has shown that the range of runoff amounts,Q,resulting from a given rainfall amount,P,can be largely explained by variations in storm duration.It is demonstrated that,for a given rainfall amount,the range of runoff corresponding to the 10-and 90-percentile rainfall durations are in fairly close agreement with the 10-and 90-percentile runoff amounts corresponding to the conventional antecedent runoff conditions I and III,respectively.Overall,the results presented in this paper provide a physical basis for the curve number model,improve understanding of the curve number model,provide a means for estimating the median CN from the more physically based φ index of a catchment,and provide a means for taking into account variable rainfall durations when applying the curve number model.Further investigation using actual rainfall hyetographs and runoff measurements under different climatic conditions are warranted to further validate the results reported in this paper,and to further assess the relative importance of rainfall duration and antecedent moisture in causing deviations from median curve numbers.
杂志排行

Water Science and Engineering的其它文章
- Application of a hybrid multiscalar indicator in drought identification in Beijing and Guangzhou,China
- Analysis of influence of observation operator on sequential data assimilation through soil temperature simulation with common land model
- Common effluent treatment plant(CETP):Reliability analysis and performance evaluation
- Disinfection of dairy wastewater effluent through solar photocatalysis processes
- Numerical study of hydrodynamic mechanism of dynamic tidal power
- Evaluation of numerical wave model for typhoon wave simulation in South China Sea