Material microstructures analyzed by using gray level Co-occurrence matrices∗
2017-08-30YansuHu胡延苏ZhijunWang王志军XiaoguangFan樊晓光JunjieLi李俊杰andAngGao高昂
Yansu Hu(胡延苏),Zhijun Wang(王志军),Xiaoguang Fan(樊晓光), Junjie Li(李俊杰),and Ang Gao(高昂)
1 School of Electronics and Control,Chang’an University,Xi’an 710064,China
2 School of Materials Science and Engineering,Northwestern Polytechnical University,Xi’an 710072,China
3 School of Electronics and Information,Northwestern Polytechnical University,Xi’an 710072,China
Material microstructures analyzed by using gray level Co-occurrence matrices∗
Yansu Hu(胡延苏)1,Zhijun Wang(王志军)2,†,Xiaoguang Fan(樊晓光)2, Junjie Li(李俊杰)2,and Ang Gao(高昂)3
1 School of Electronics and Control,Chang’an University,Xi’an 710064,China
2 School of Materials Science and Engineering,Northwestern Polytechnical University,Xi’an 710072,China
3 School of Electronics and Information,Northwestern Polytechnical University,Xi’an 710072,China
The mechanical properties of materials greatly depend on the microstructure morphology.The quantitative characterization of material microstructures is essential for the performance prediction and hence the material design.At present, the quantitative characterization methods mainly rely on the microstructure characterization of shape,size,distribution, and volume fraction,which related to the mechanical properties.These traditional methods have been applied for several decades and the subjectivity of human factors induces unavoidable errors.In this paper,we try to bypass the traditional operations and identify the relationship between the microstructures and the material properties by the texture of image itself directly.The statistical approach is based on gray level Co-occurrence matrix(GLCM),allowing an objective and repeatable study on material microstructures.We first present how to identify GLCM with the optimal parameters,and then apply the method on three systems with different microstructures.The results show that GLCM can reveal the interface information and microstructures complexity with less human impact.Naturally,there is a good correlation between GLCM and the mechanical properties.
microstructures,quantitative characterization,mechanical properties,gray level Co-occurrence matrix
1.Introduction
The mechanical properties greatly depend on the microstructure morphology.The performance,composition,microstructures,and processing technology which are interrelated with each other together compose the research framework of material science.[1]Among all these factors,microstructures play an important part in the material analysis and design.It is well known that there is a famous Hall–Petch formula to illustrate the relationship between the grain size and material strength for single-phase alloys.For duplexphase complex structures,such as hypereutectic structures and precipitated structures,the strength isrelated to two-phase volume fraction,morphology and micro-distribution.Regulating microstructures by improving the composition and technology to enhance the mechanical properties is an eternal theme in material science.
Quantitative characterization of material microstructures is the foundation of microstructures investigation.[2]As the computing power increases and the microscope technology (such as optical microscopy,electron microscope,transmission electron microscope,and atomic force microscope)develops over time,image analysis and processing have become more and more important for the microstructure characterization and performance prediction.[3,4]At present,digital image preprocessing including binaryzation,filtering,erosion,dilation,open-close operation,and so on has been widely used in the microstructure quantitative characterization.However,the images still need to be manually separated for the data reliability and repeatability.[5]After that,the information such as grain shape,size,distribution and volume fraction can be extracted to quantitatively characterize the microstructures and related to the mechanical properties.In the premise of huge statistics,the mechanical properties can be predicted by the quantitative information.Although the image acquisition technology and processing software are more and more advanced, the basic methods applied for the quantitative characterization have remained the same for several decades[2,6–9]and may induce appreciable error to the final results.For example,the phase volume fraction is usually measured by the area ratio of section,the percentage of interception of line segments or the percentage of point numbers observed,corresponding to area measurement method,intercept method,and point-count method,respectively.[10–14]Due to the easier realization on computer programming,the area method has become the most popular way to obtain the volume fraction.Even though it avoids the manual interception selection,the error still exists for the image quality,boundary segmentation,threshold value,and so on.
In summary,the traditional operations first detect the microstructure characterization(grain shape,size,distribution, and volume fraction)by image processing techniques and then establish the correlation to mechanical properties,which is time consuming and offers low repeatability due to the human errors and subjectivity.Despite lots of researches have tried to apply computer and digital image processing technology for material science,[15,16]the original methods to obtain the microstructure characterization still depend on the subjectivity of human factors which will induce unavoidable error,but these approaches demonstrate the potential of computer vision concepts in microstructures.
In this paper,we try to bypass the traditional operations and achieve the quantitative characterization of microstructures by a novel method which can be used to describe the relationship between the microstructures and the mechanical properties by the texture of image itself directly.The statistical approach is based on gray level Co-occurrence matrix (GLCM),allowing an objective and repeatable study on material microstructures.Three applications illustrate that the texture features reveal the intrinsic mechanism of microstructures and well reflect the mechanical properties.
2.Background of GLCM
GLCM,proposed by Haralick et al.in the 1970s[17–19]is an important feature extraction method in the domain of texture analysis.Since then,it has been widely used for image classification and segmentation in many applications,for example,remote sensing image retrieval,[20–22]medicine disease detection,[23,24]and so on.However,this method has been seldom applied in microstructures of material science.It is encouraging that the development of interdiscipline is breaking the subject diversity.Very recently,Renzetti et al.[25,26]used GLCMin duplex stainless steels.They pointed out that GLCM is quite effective to classify material textures especially when the structure is fairly homogeneous.However,the relationship between the texture features and the material properties is ignored,which is the main purpose of this paper.
GLCM provides a mature and effective statistical method for analyzing textures.Unlike histograms which carry no information regarding the relative position of pixels with respect to each other,GLCM considers not only the distribution of intensities,but also the relative positions of pixels in an image.
By supposing that an image to be analyzed is rectangular with Nxcolumns and Nyrows and the gray level appearing at each pixel is quantized to Nglevels,the imagefcan be represented as a function that assigns some gray levels in G to each pixel
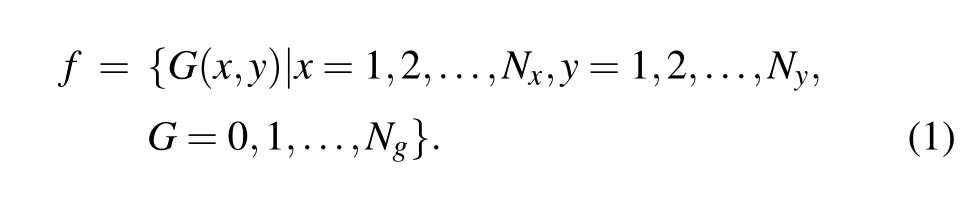
Take the gray image in Fig.1(a)as an example with 4×4 pixels.Each pixel has a gray level(G=0,1,...,7). The corresponding matrix of imagefis shown in Fig.1(b) (Nx=Ny=4).
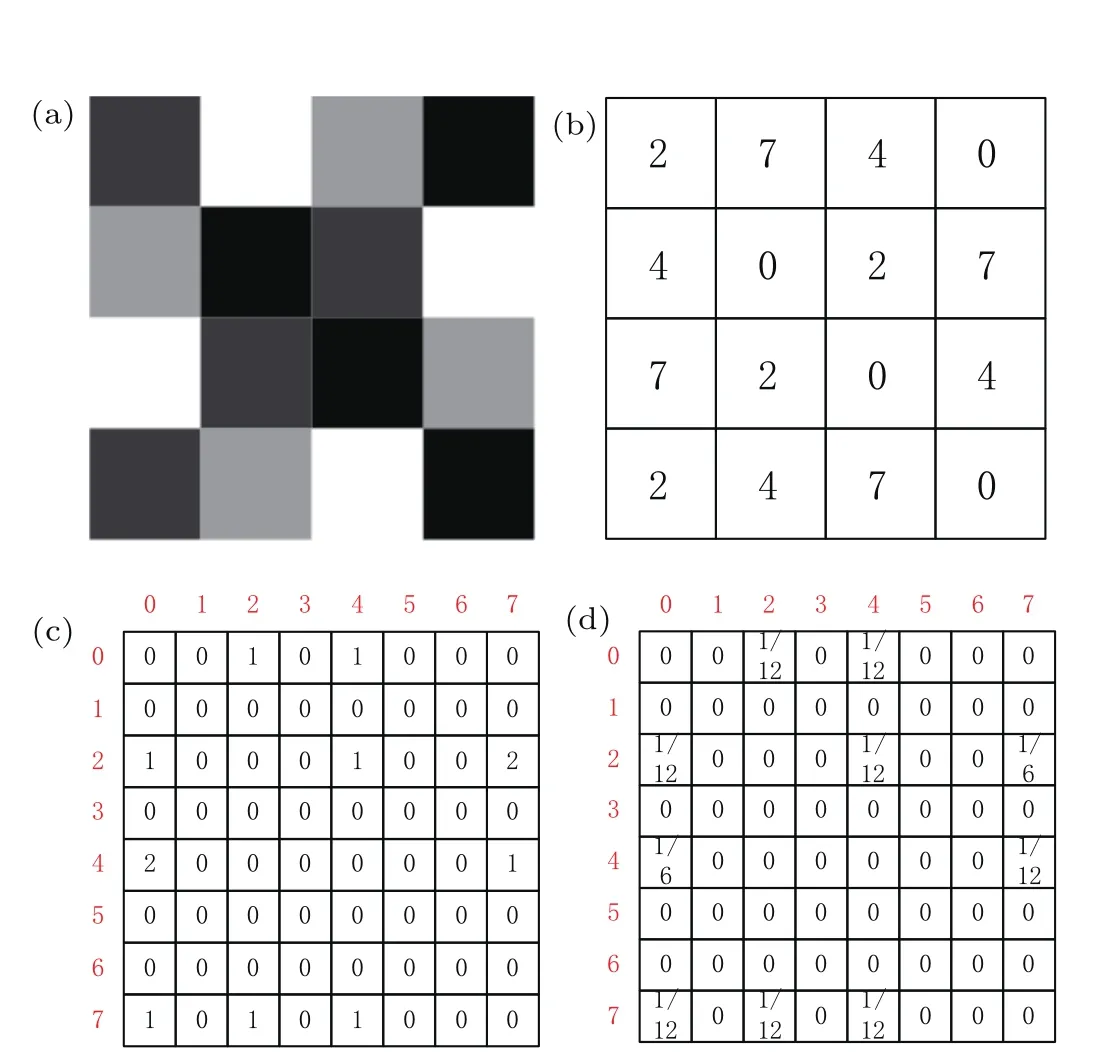
Fig.1.(color online)An example to show how to obtain GLCM from an image.(a)Original image f,(b)matrix of image f,(c)initial GLCM (d=1,θ=0°),and(d)normalized GLCM(d=1,θ=0°).
GLCM reflects the comprehensive information of the direction,adjacent interval,and amplitude variations of image gray levels.Hence,the texture-context information is specified by the matrix of relative frequencies P(i,j,d,θ)with two neighboring pixels separated by distance d and a specified angle θ occur on the image,one with gray leveliand the other with gray level j.[17]Because matrices of gray level cooccurrence frequencies are a function of d and θ between the neighboring pixels,the extraction of a single direction will induce the variation of texture features when the image rotates. Formally,for angles quantized to 45 intervals,the frequencies are defined in the following equations:


where Lx×Lyis the set of pixels,and then GLCM can be described as follows:

By supposing d=1 and θ=0°,the initial GLCM of imagefis shown in Fig.1(c).
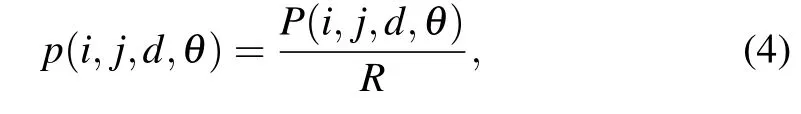
The next step to determine the texture features is to express GLCM’s terms as probabilities.Selected statistics are applied by iterating through the matrix.The probability describes how often one gray level will appear in a specified spatial relationship to another gray level on the image.The normalization equation is as follows:
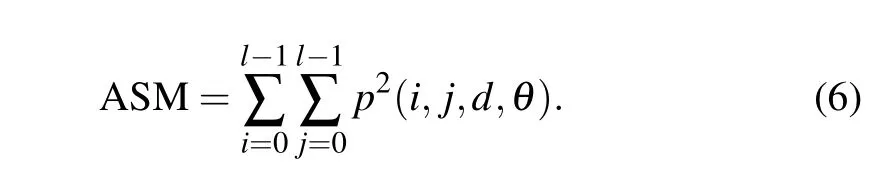
The properties of image texture cannot be obtained by GLCM directly.The texture features are secondary statistics defined in Haralick’s theory.[17–19]There are 14 different texture features,but only 4 of them are independent,[27]namely angular second moment(ASM),entropy(ENT),contrast(CON),and correlation(COR).
ENT[17,18,28]In image processing,ENT measures the disorder or complexity of an image,and reflects the randomness of grayscale distribution.Its largest value is found when all elements in GLCM are as equal as possible.The more dense the texture is,the more scattered the grayscale distribution,and the more small elements GLCM has.Hence,the entropy value is higher.ENT is strongly but inversely correlated to ASM

ASM[17,25]ASM is the squared sum of all the elements of GLCM,also called energy.ASM measures the texture uniformity or thickness and is the opposite of ENT.Its value achieves the smallest when all elements are almost equal.This is a measure of local homogeneity
CON[29,30]CON which is the moment of inertia of the matrix around its main diagonal is a measure of intensity contrast between a pixel and its neighbor over the entire image.A low value of CON is obtained when the image has almost constant gray levels;vice versa,this indicator presents high values for images of high contrast

COR[30,31]COR is a measure of gray level linear dependencies in an image.This also reflects the degree of the rows(or columns)of GLCM relative to each other.For example,when the number of the texture in horizontal direction is more than other directions,the value of the correlation feature is higher along this direction compared to the values for others

All the definitions above have no relationship with the real size of physical objects.Obviously,more pixels present better average texture features.However,in essence,the textural features of material microstructures should be coincident no matter what the amplification factor of the electron microscope sets or the size of image segmentation region selects.Hence,the unit statistics are used to characterize the texture features of one pixel corresponding to the real dimension. Take ENT as an example.The unit ENT value is as follows:

where d x(µm)and d y(µm)are the physical dimensions of one pixel in the material microstructures.
3.Benchmark of GLCM
Before using the texture features to describe the material microstructures,the effects of parameters(i.e.,pixels distance d,angular relationship θ,and gray level G)on the features of GLCM should be discussed firstly.The typical grain structure is used as a benchmark to identify the proper parameters.Figure 2 shows different grain sizes when the grain grows with the annealing time.This mainly refers to the numeric calculation, so we ignore the scale here.
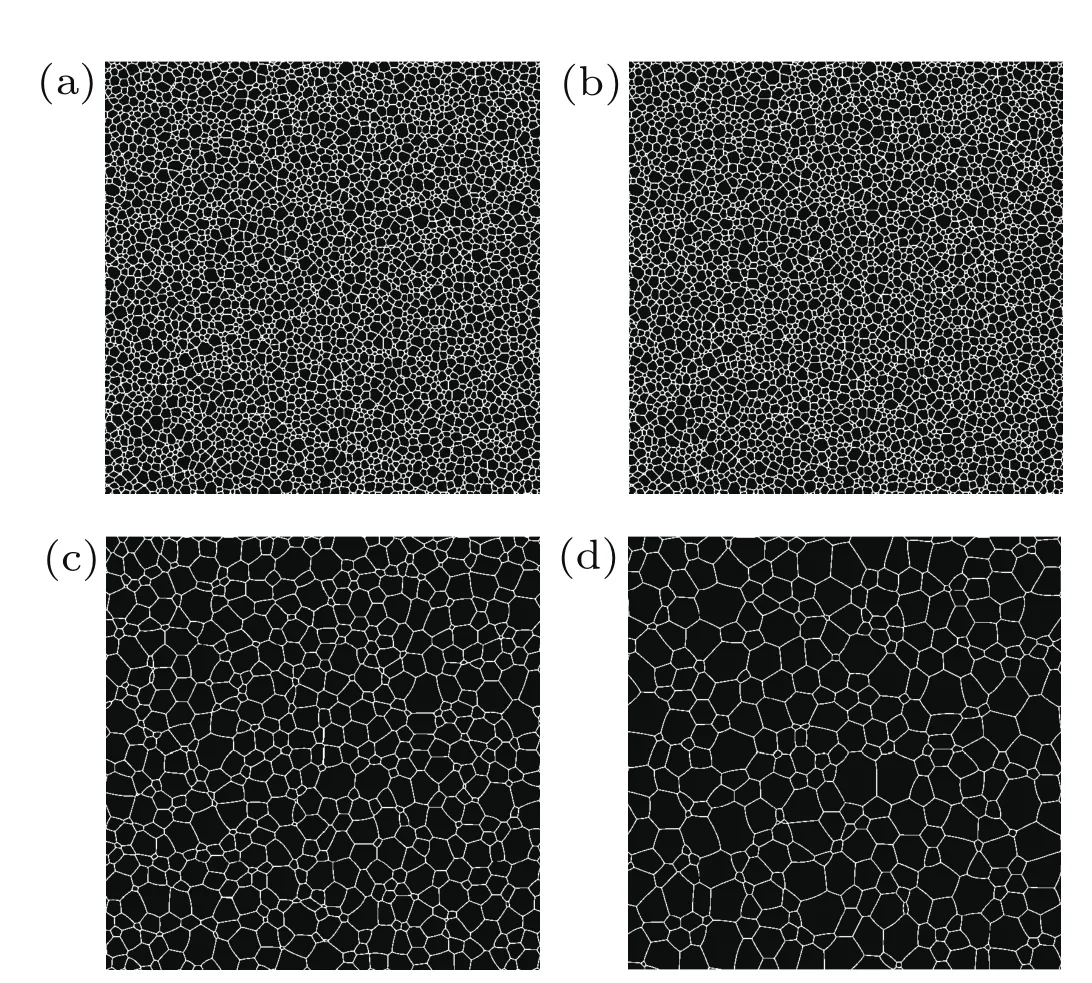
Fig.2.Evolution of grain size along with the annealing time(an-time). The results are from phase field simulation,where the dimensionless time is 10000d t(720×720 pixels).(a)An-time=2,(b)an-time=8,(c)antime=16,(d)an-time=30.
As discussed above,GLCM is the function of pixel distance d,angular relationship θ,and gray level G.To eliminate the influence of direction,the angular θ takes 0°,45°,90°, 135°,respectively and the mean value of the four directions is taken as the texture features.The effects of these parameters are evaluated to obtain the optimal GLCM.
Set G=16.Figure 3 shows the curves of texture features (ENT,ASM,CON,and COR)in different an-time when the distance varies.For the same distance,the value of ENT and CON decreases along with the annealing time while ASM and COR increase.That is because when the grain size increases with an-time,the texture becomes simple and sparse with less grain boundary.The value of texture features changes correspondingly which is coincident to the analysis above in Section 2.With the increase of distance,ENT,ASM,COR,and CON reach a constant value after a transient stage.When the distance d≥3,all the texture features tend to be stable and show a good dispersion for the grain images at different time. Considering that there may exist errors of texture features if the distance d is larger than a grain,d=3 will be the optimal choice for GLCM.
Next,we fix d=3 and discuss the impact of gray level on GLCM shown in Fig.4(G=2n,n=[3,4,...,8]).Considering the data dispersion and computation complexity,we take G=128 as the optimal gray level.Noted that although GLCM is a function of d,θ,and G,the texture features of ENT and ASM are convergent to a constant and coincident in the same variable environment.
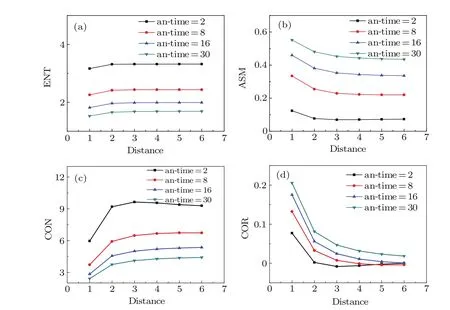
Fig.3.(color online)Variation curves of texture features along with distance.(a)ENT with an-time,(b)ASM with an-time,(c)CON with an-time,and(d)COR with an-time.

Fig.4.(color online)Variation of texture features along with the gray level G=2n,n=[3,4,...,8](d=3).(a)ENT with an-time, (b)ASM with an-time,(c)CON with an-time,and(d)COR with an-time.
4.Applications and results
Three applications are presented in this paper to illustrate how to use GLCM to analyze the material microstructures. Considering that CON is sensitive to the brightness contrast among one pixel and its neighboring pixels,it is effective for image segmentation but insignificant for images obtained by the electron microscope along with the microstructure evolution.Meanwhile,different from artificial textures,the texture direction of microstructures is random,which means that there is no principal direction as shown in Figs.3 and 4.Therefore, COR is negligible for the material textures analysis without dominant orientation.Consequently,we only take the strong factors ENT and ASM into consideration in this paper.
4.1.Grains in single phase
The grain growth is from the phase field simulation.In general,the average grain size has a power law relationship with the annealing time in single phase,i.e.,D=Kt1/2.Based on the Hall–Petch formula,the yield strength depends on the average grain size[1]
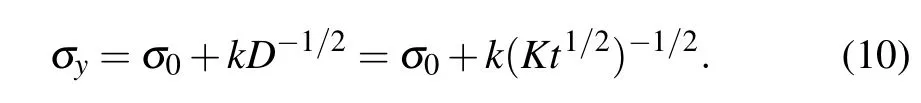
Using GLCM in Fig.2,we plot the ENT and ASM curves along with the annealing time as shown in Fig.5.The figures indicate that both ENT and ASM have a power law with the annealing time.Accordingly,the yield strength have a power law with ENT and ASM in the grain structure
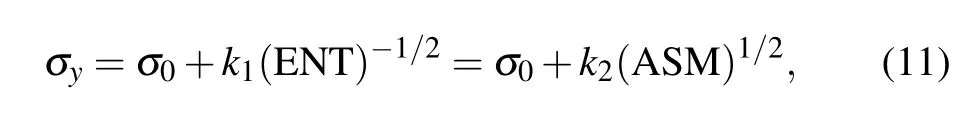
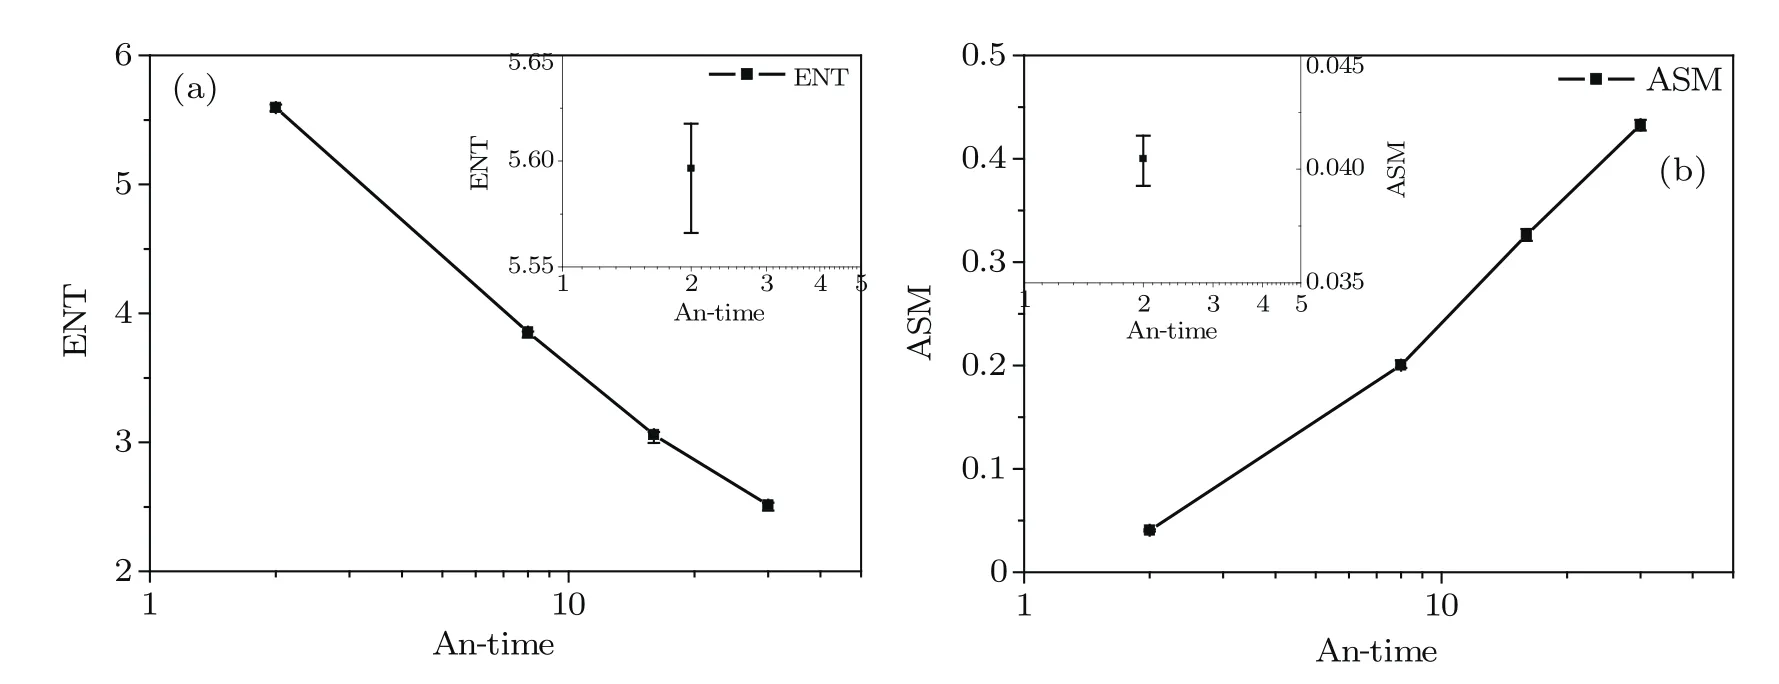
Fig.5.The power law relationship between texture features and annealing time of grain structure and the error bar by defining a detection window(540×540 pixels).(a)ENT with an-time and(b)ASM with an-time.
where k1and k2can be determined by the obtained GLCM. Then,the texture features can be directly related to the mechanical properties.The basic idea behind GLCM is that the interface(grain boundary)blocks the migration of dislocations while GLCM reveals the statistic information of the grain boundary.
4.2.Duplex phases
In the systems of duplex phases,there is no simple relationship between the microstructures and mechanical properties.The characterization of complex microstructures is one of the obstacles to find a quantitative relationship.Figure 6 presents the typical microstructures of duplex-phase titanium after heat treatment at different temperatures.It is difficult to quantitatively identify the microstructures,although there are some differences in these figures with a glance.By using GLCM,we have two parameters of ENT and ASM to quantitatively reveal the difference of these images after different heat treatment.Figure 7 indicates that the heat treatment around 940°C may show the optimal mechanical properties which are coincident with the practical situation.
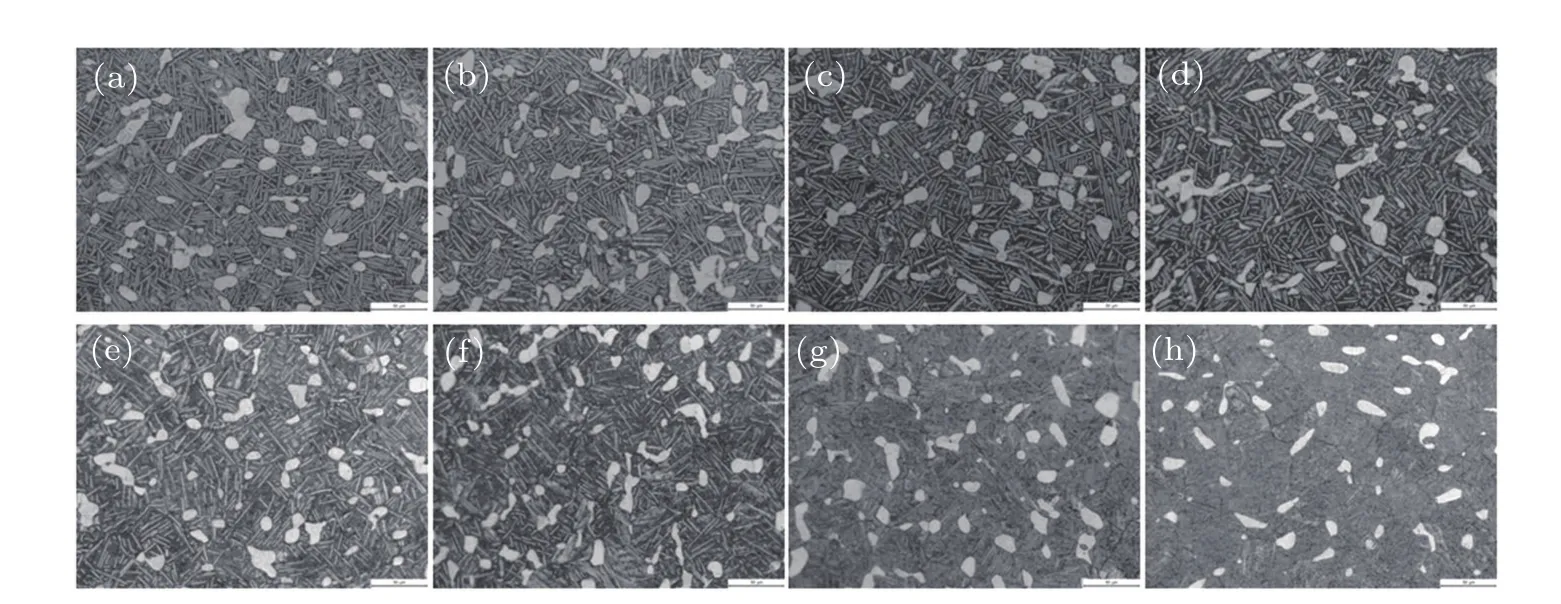
Fig.6.Microstructures of duplex-phase titanium after heat treatment at different temperatures(960×1280 pixels).(a)Temp=860°C, (b)Temp=910°C,(c)Temp=920°C,(d)Temp=930°C,(e)Temp=940°C,(f)Temp=950°C,(g)Temp=960°C,and(h)Temp=970°C.

Fig.7.Texture features at different temperatures of duplex-phase titanium and the error bar by defining a detection window(720×960 pixels). (a)Unit ENT with temperature and(b)unit ASM with temperature.
4.3.Eutectic microstructure
In the regular eutectic phase,the typical microstructure is a lamellar structure.The lamellar spacing and the volume fraction of the primary phase are usually measured to reveal the mechanical properties.Figure 8 shows the microstructures of eutectic high entropy alloys CoCrFeNiNbxwith different additions of element Nb.It has been reported that the hardness and compress strength increase but the compress elongation decreases with the increase of addition of Nb.[32]The variation of mechanical properties is attributed to the increase of volume fraction of the eutectic phase.The microstructure characterization is shown in Fig.9.Both ENT and ASM have a monotonic relation with the increase addition of Nb.The results show that ENT and ASM have a good relationship with the mechanical properties in the eutectic alloys.

Fig.8.Microstructures of eutectic high entropy alloys CoCrFeNiNb x(x=0.1,0.25,0.5,0.65)[29](960×1280 pixels).(a)Nb0.1,(b)Nb0.25, (c)Nb0.5,and(d)Nb0.65.
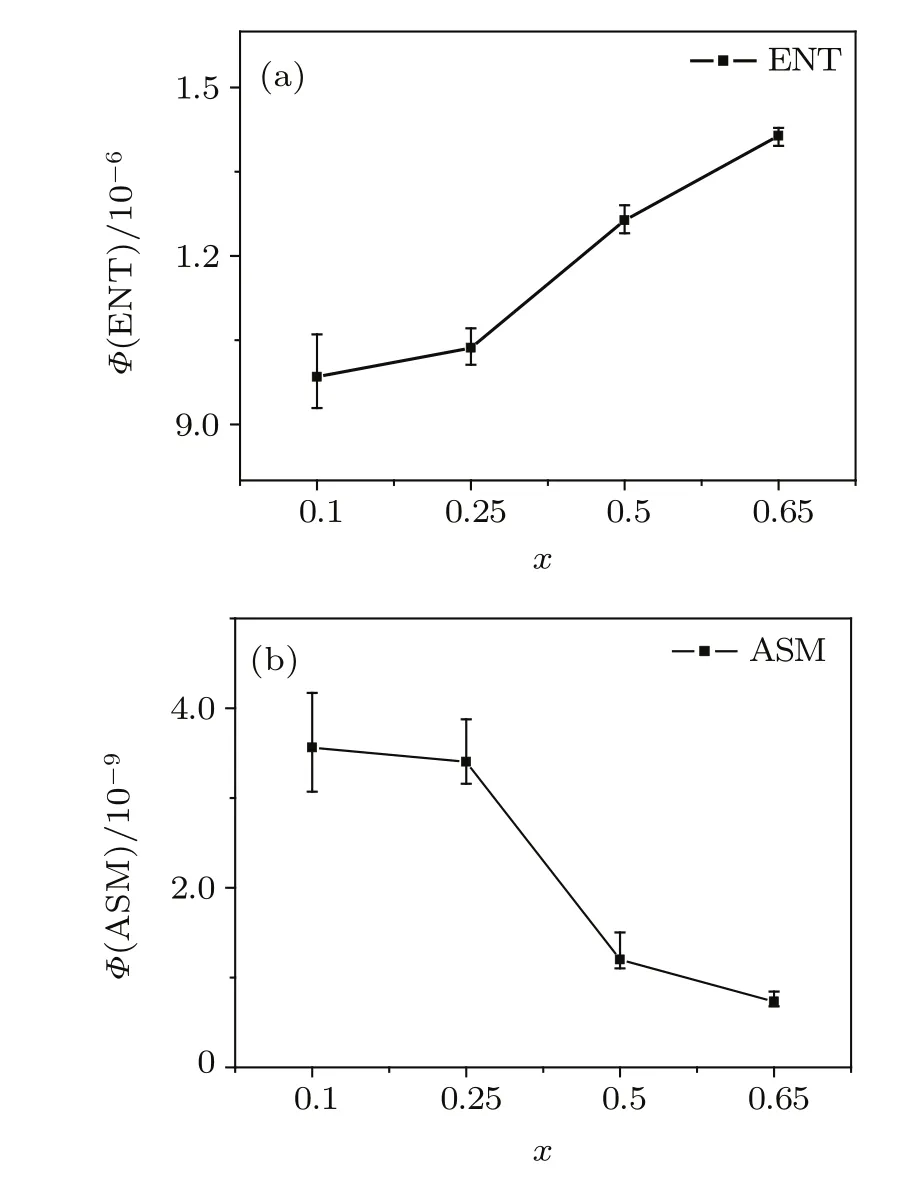
Fig.9.Texture features of eutectic high entropy alloys CoCrFeNiNb x (x=0.1,0.25,0.5,0.65)and the error bar by defining a detection window(720×960 pixels).(a)Unit ENT with Nb x and(b)unit ASM with Nb x.
5.Results analysis
Three applications of GLCM have been presented on the microstructure characterization.ENT and ASM show significant correlation with the mechanical properties.The intrinsic mechanism of the correlation depends on the description of interface in GLCM.For the mechanical properties,the interface including grain boundary in a single phase and interface between phases in duplex phases,will be the barrier of dislocation migration.In the microstructures,it is the interface again outlines the grains and phases.In previous microstructure characterization,the grains and phases were focused and the related information was statistically counted.Here,by GLCM,the interface gains more attentions,and the complexity of the microstructures is revealed.That is why GLCM can reveal the mechanical properties quantitatively.However,the properties are also determined by the property of phases and interface in different systems.Therefore,the correlation function of ENT or ASM and the mechanical properties may be different in different systems,where the function type or parameter may differ.
Meanwhile,figures 5,7,and 9 also show the error bars by GLCM calculations of different areas of the original figures.Take grains in the single phase(Fig.5)as an example. The areas are defined by a detection window smaller than the original one and 5 different positions for the texture features are calculated.Then,the error range and the average value are identified in the figures.The details are shown in the corner of the figure.It is obvious that the error is very small(no more than 2%)and the power law relationship keeps constant. There is similar phenomenon in both duplex phases(Fig.7) and duplex phases(Fig.8)applications.The reason is that the microstructures are uniform as while as the texture features are statistics,and the errors depend on the homogeneity of the microstructures.That is why the error is much smaller in single phase and the largest error appears for Fig.8(a).It also demonstrates that GLCM method is objective and repeatable.
As to the errors in relationship between the microstructures and the mechanical properties,the errors from GLCM analysis will be smaller than that in traditional analysis. Firstly,there are errors in the measurements of mechanical properties,which are inevitable.Secondly,the previous methods[10–14]have limitations in image segmentations and introduce errors from the subjectivity of human factors. GLCM is more powerful in characterizing the image with high precision.Therefore,the error range by using GLCM to predict the mechanical properties is smaller than previous methods.The exact error range depends on the homogeneity of the microstructures and the scatter of the material properties in specific processing.
6.Conclusion
In summary,the strategy of material microstructure analysis using GLCM is proposed.The mechanical properties mainly depend on the microstructures which can be well described by its texture features of the microscope image.This enables the idea that bypasses the traditional microstructure characterization methods and establishes the relationship between the mechanical properties and the image features itself be possible.Taking the typical grain structures as an example, we discuss the effect of different parameters,i.e.,the distance d and the gray level G on GLCM and present how to identify the proper value,and then the GLCM method is applied in three different microstructure systems.The results show that GLCM can reveal the interface information and the microstructures complexity.The parameters in GLCM can be used as fundamental parameters to establish models for the correlation of microstructures with the mechanical properties.
[1]Meyers M A and Chawla K K 2009 Mechanical Behavior of Materials (Cambridge:Cambridge University Press)pp.1–7
[2]Wojnar L 1988 Image Analysis:Applications in Materials Engineering (Crc Press)pp.3–8
[3]Xu L,Zhao W M,Ding H L,Ma Z Y,Xu J,Chen K J and Li W 2010 Chin.Phys.B 19 047308
[4]Zheng O,Ma J Y,Zhou J P,Jin L,Zhao D S and Wang R H 2009 Chin. Phys.B 18 4370
[5]Wang K X,Zeng W D,Shao Y T,Zhao Y Q and Zhou Y G 2009 Rare Metal.Mater.Eng.38 398
[6]Sampath S,Jiang X Y,Matejicek J,Leger A C and Vardelle A 1999 Mater.Sci.Eng.A 272 181
[7]Czerwinski F,Zielinska-Lipiec A,Pinet P J and Overbeeke J 2001 Acta Materialia 49 1225
[8]Abrams H 1971 Metallography 4 59
[9]Qin M H,Lin L,Li L,Jia X T and Liu J M 2015 Chin.Phys.B 24 037509
[10]Xu J L and Chen C 2004 Acta Metrologica Sin.4 369
[11]Zhang Y X,Wang J C,Yang Y J,Yang G C and Zhou Y H 2009 Chin. Phys.B 18 4407
[12]Lee J H,Moon H,Lee H W,Kim J,Kim J D and Yoon K H 2002 Solid State Ionics 148 15
[13]Dallair M and Furrer D 2004 Adv.Mater.Process.162 25
[14]Li G R,Wang F F,Wang H M,Zheng R,Xue F and Cheng J F 2017 Chin.Phys.B 26 046201
[15]Campbell A,Murray P,Yakushina E,Marshall S and Ion W 2016 Proceedings of the 4th International Conference Recent Trends in Structural Materials,November 9–11,2016,Czech Republic,p.012011
[16]DeCost B L and Holm E A 2015 Comput.Mater.Sci.110 126
[17]Haralick R M,Shanmugam K and Dinstein I 1973 IEEE Trans.Syst. Man Cybern.SMC-3 610
[18]Haralick R M 1979 Proc.IEEE 67 786
[19]Haralick R M and Shanmugam K 1973 IEEE Trans.Geosci.Electron. 11 171
[20]Champion I,Germain C,Da Costal J P,Alborini A and Dubois-Femandez P 2014 IEEE Geosci.Remote Sens.Lett.11 5
[21]Su H,Wang Y P,Xiao J and Li L L 2013 ISPRS J.Photogram.Remote Sens.85 13
[22]Eichkitz C G,Davies J,Amtmann J,Schreilechner M G and De Groot P 2015 First Break 33 71
[23]Hu S,Xu C,Guan W Q,Tang Y and Liu Y N 2014 Bio-medical Mater. Eng.24 129
[24]Tan T C,Ritter L J,Whitty A,Fernandez R C,Moran L J,Robertson S A,Thompson J G and Brown H M 2016 Mol.Reprod.Dev.83 701
[25]Renzetti F R and Zortea L 2011 Frattura ed Integrita Strutturale 16 43
[26]Renzetti F R and Zortea L 2010 Proceedings of the Youth Symposium on Experimental Solid Mechanics 2010,Trieste,Italy
[27]Ulaby F T,Kouyate F,Brisco B and Williams T L 1986 IEEE Trans. Geosci.Remote Sens.GE-24 235
[28]Ou X,Pan W and Xiao P 2014 Int.J.Pharmaceutics 460 28
[29]Gonzalez R C and Woods R E 2006 Digital Image Processing(Pearson Education)p.849
[30]Conners R W and Harlow C A 1980 IEEE Trans.Pattern Anal.Mach. Intell.PAMI-2 204
[31]Kekre H B,Thepade S D,Sarode T K and Suryawanshi V 2010 Int.J. Comput.Theory Eng.2 695
[32]He F,Wang Z J,Cheng P,Wang Q,Li J J,Dang Y Y,Wang J C and Liu C T 2016 J.Alloys Compd.656 284
1 April 2017;revised manuscript
5 June 2017;published online 27 July 2017)
10.1088/1674-1056/26/9/098104
∗Project supported by the National Natural Science Foundation of China(Grant Nos.5147113 and 51505037)and the Fundamental Research Funds for the Central Universities of Ministry of Education of China(Grant Nos.3102017zy029,310832163402,and 310832163403).
†Corresponding author.E-mail:zhjwang@nwpu.edu.cn
©2017 Chinese Physical Society and IOP Publishing Ltd http://iopscience.iop.org/cpb http://cpb.iphy.ac.cn
猜你喜欢
杂志排行

Chinese Physics B的其它文章
- Improved control for distributed parameter systems with time-dependent spatial domains utilizing mobile sensor actuator networks∗
- Geometry and thermodynamics of smeared Reissner–Nordström black holes in d-dimensional AdS spacetime
- Stochastic responses of tumor immune system with periodic treatment∗
- Invariants-based shortcuts for fast generating Greenberger-Horne-Zeilinger state among three superconducting qubits∗
- Cancelable remote quantum fingerprint templates protection scheme∗
- A high-fidelity memory scheme for quantum data buses∗