Origin of the low formation energy of oxygen vacancies in CeO2
2022-10-26HanXu许涵TongtongShang尚彤彤XuefengWang王雪锋AngGao高昂andLinGu谷林
Han Xu(许涵) Tongtong Shang(尚彤彤) Xuefeng Wang(王雪锋)Ang Gao(高昂) and Lin Gu(谷林)
1Beijing National Laboratory for Condensed Matter Physics,Institute of Physics,Chinese Academy of Sciences,Beijing 100190,China
2School of Physical Sciences,University of Chinese Academy of Sciences,Beijing 100049,China
3Songshan Lake Materials Laboratory,Dongguan 523808,China
Keywords: CeO2,oxygen vacancy,synchrotron x-ray diffraction,electron-density distribution
1. Introduction
CeO2has been extensively used as the active component of catalytic combustion to remove volatile organic compounds in virtue of its high efficiency and low operating temperature.[1,2]Bulk oxygen vacancies improve the flexibility and activity of lattice oxygen species,resulting in outstanding redox properties of CeO2.[3–5]Since the oxygen vacancy is one of the most important structural parameters and creates the catalytic properties of ceria-based catalysts, a large number of theoretical and experimental investigations have been focused on regulating the formation of oxygen vacancies and determining the corresponding catalytic activity.[6–8]Mapping of the oxygen vacancy using scanning tunneling microscopy has highlighted the critical role of oxygen vacancies in the redox properties of CeO2.[9]A previous study of oxygen vacancies on different exposed CeO2surfaces proposed that a high concentration of oxygen vacancies is beneficial to improve catalytic activity,especially at low temperatures.[10]Suet al.demonstrated that both surface and bulk vacancies promote the redox property in toluene catalytic combustion.[11]However, the direct relationship between the Ce–O bond interaction and the formation of oxygen vacancies remains elusive. The electron density of a functional material, one of the most information-rich observables, contains the complex deformation of valence electrons compared with independent atoms and the complicated chemical bonding interactions of bonded atoms.[12–15]Real-space electron density distribution plays a critical role in understanding properties of functional materials.[16,17]
Recent years, we have witnessed profound progress in x-ray diffraction (XRD) and its wide applications in measurements of electron-density distribution and bonding interactions.[13,18,19]Synchrotron radiation is also available with high energy and excellent monochromaticity. Wavelengths of 0.5 ˚A and 0.4 ˚A are widely available, which allows acquisition of high-order diffraction,thus increasing experimental resolution.[17,20–22]As a result, synchrotron XRD has become a routine technique to obtain the experimental electron density of crystal materials.[23,24]Synchrotron charge density of the trinuclear carboxylate complex determined thatd(xy) charge depletion is important for determining active versus trapped Fe-III sites.[25]Investigation of bonding types in Sc3TC4carbides (T=Fe, Co, Ni) by topological analysis showed that the bond in Sc3TC4was primarily covalent.[26]The high-quality diffraction data from the third-generation synchrotron radiation x-ray sources combined with multipole refinement allow for more accurate measurement of electron density in CeO2.
In this work,we investigate the atomic structure,electrondensity distribution, oxygen vacancy formation energy, and chemical bonding of CeO2using an integrated differential phase contrast scanning transmission electron microscope(iDPC-STEM),high-energy synchrotron XRD,first-principles calculations,and subsequent quantitative topological analysis.It is found that there is almost no electron overlap between Ce and O atoms. This indicates that the hybridization between Ce and O atoms is very weak. In addition,quantitative topological analysis based on the measured electron density is carried out to reveal the closed-shell interaction behavior of the Ce–O bond,proving weak interaction between Ce and O atoms. The oxygen vacancy formation energy of CeO2,TiO2,and Co3O4are calculated based on the density functional theory, which indicates that the oxygen vacancy formation energy of CeO2is the lowest among three redox catalysts. Thus,it is the relatively weak interaction between the bonded Ce and O atoms in CeO2that facilitates the formation of oxygen vacancies,making it superior to other catalysts.
2. Experimental and theoretical methods
CeO2polycrystalline powder with 99.5%purity was purchased from Sigma-Aldrich, USA. Atomic-resolution iDPCSTEM photographs of CeO2were collected via a scanning transmission electron microscope (STEM, FEI Titan Cubed Themis G2 300) equipped with a DCOR+ corrector. The acceleration voltage of the electron beam was 300 kV and the convergence semiangle was 10 mrad.[27]A high-pass filter was used to block the low frequency signal in atomicresolution photographs. A four-quadrant DF4 detector was used to obtain four images for two-dimensional integration.Synchrotron XRD data was collected at 100 K using a highprecision diffractometer at the BL19B2 beamline of SPring-8. During XRD data collection,the CeO2powder was sealed in a Lindeman glass tube with an inner diameter of 0.3 mm.The contribution of capillary diffraction was removed in subsequent refinements. The wavelength of the synchrotron radiation x-rays is 0.41334 ˚A,corresponding to energy of 30 keV.An imaging plate was used as a detector to cover a wide range of 2θ,up to 78.165°.
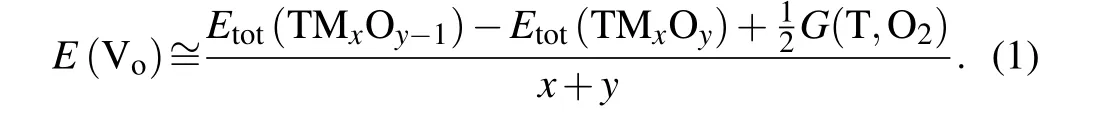
First-principles calculations were based on the density functional theory. The theoretical model was built through the Viennaab initiosimulation package (VASP).[28–31]In the parameterization of the Perdew–Burke–Ernzerhof pseudopotential,[32]the electronic exchange-correlation interactions and generalized gradient approximation functional were represented by projector augmented wave (PAW)potentials.[33]The wave function was represented as a plane wave with a 500-eV cutoff energy. Geometry adjustments were carried out using conjugate gradient minimization until all ion forces were less than 0.01 eV/˚A per atom. AK-point mesh with a spacing of~0.03 ˚A-1was used. The extended supercells Ce32O64(2a×2b×2c), Ti32O64(2a×2b×4c),and Co48O64(2a×1b×1c) were adopted for the prediction of oxygen vacancy formation energy with an oxygen vacancy.The following expression for oxygen vacancy formation energy was used in this calculation (at room temperature, the chemical potential of oxygen Vowas 8.99 eV/molecule[34]):
3. Results and discussion
The crystal structure of CeO2is fluorite and the structure of the unit cell is face-centered cubic(fcc)in the space groupFm¯3m. As shown in Fig. 1(a), the eight equivalent nearest oxygen ions are located at the eight corners of the cube centered on the cerium ion, and each oxygen ion is coordinated by four cerium ions forming a tetrahedron. Figure 1(b)is the structure projection of CeO2along the [100] zone axis. The iDPC-STEM image is linearly related to the electrostatic potential and the contrast is almost linearly dependent on the atomic number.[27]Therefore, iDPC-STEM enables simultaneous atomic-resolution imaging of light and heavy elements.The iDPC-STEM photograph of CeO2along the [110] axis shows exact projected position of each atom, as illustrated in Fig. 1(c), especially for the O elements. The atoms are arranged neatly,with uniform contrast,and no defects were detected. In the fast Fourier transform (FFT) image (Fig. 1(d))of Fig. 1(c), the (0¯46) plane provides an information transfer approximately equal to 0.75 ˚A.
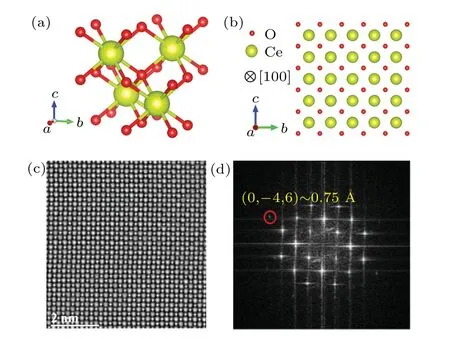
Fig. 1. Atomic structural characterization of CeO2: (a) crystal structures of the CeO2 cubic fluorite lattice(Fm¯3m);(b)projection of CeO2 along its[100]zone axis;(c)iDPC-STEM image along the[100]direction and(d)the corresponding FFT pattern.
By virtue of synchrotron powder XRD, we collected a diffraction pattern with plenty of higher-order diffraction (sinθ ·λ-1= 1.52 ˚A-1). This diffraction pattern met the requirements of multipole refinement for experimental data and guaranteed sufficient resolution in charge density distribution.[35]Rietveld refinement and multipole refinement of synchrotron radiation data were performed using Jana 2006.[36]In order to reduce the background noise of the XRD data, twelve Legendre expansions were used to fit the experimental background. Through Rietveld refinement, the structure factor of CeO2, which is the Fourier component of the charge density, was obtained. Then, information related to charge density distribution could be obtained by further multipole refinement.[23]
An experimental multipole model is used to refine electron densities from high-precision diffraction data. The multipole model used in this work was the Hansen–Coppens model:[20]

Here, the electron densityρis divided into three parts. The first two terms are the spherical core(ρc)and valence densities(ρv). The summation in the third term is the valence deformation.In addition,dlm±is the real part of the density normalized spherical harmonic function,similar to hydrogenic orbitals in polar coordinates;ρvand the radial function (Rl) are modified by the refinable parameters(κandκ′)to account for the expansion or contraction of the valence shell.The function expansion of O is truncated at the hexadecapolar level(lmax=4).Venturing into Ce with the 4f electron, it is necessary to use even higher functions (lmax=6). The aspherical features are modeled using the 6s,5d,and 4f electrons of Ce,while other orbitals of Ce are considered to be part of the core.
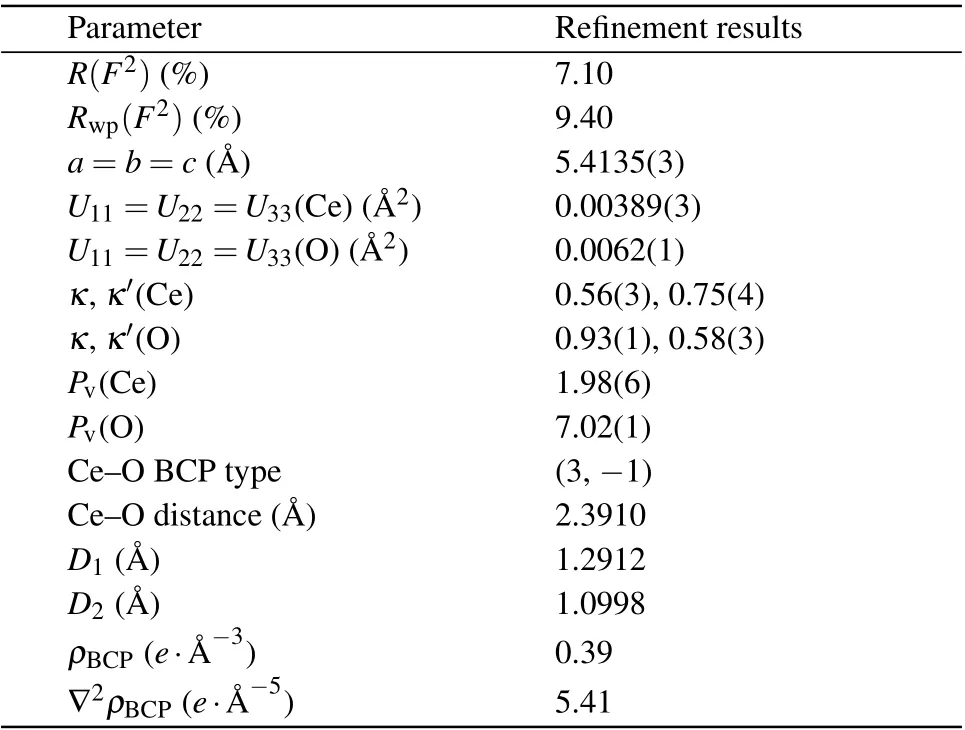
Table 1. Refinement results for CeO2.
Synchrotron radiation experiments were performed in the liquid nitrogen temperature region(100 K).The low temperature suppressed the thermal vibration of atoms in the crystal so that atomic displacement parameters(ADPs)in the sample had limited influence on the diffraction data. During refinement,it was found that the thermal vibration of oxygen and cerium atoms can be accurately reflected using second-order isotropic ADPs. TheRfactor, ADPs, and other parameters with their error ranges obtained by multipole refinement are listed in Table 1. SinceRp=7.10%andRwp=9.40%,credibility of the refinement results is confirmed. Figure 2 shows the experimental XRD data and fitting values of CeO2. In Fig. 2, the black-cross line representing the experimental data coincides well with the red line representing the calculated fitting value,which also indicates accurate multipole refinement results.

Fig.2. Experimental XRD data and fitting values of CeO2. The orange box highlights the local amplification of CeO2 high-order diffraction;black-cross,red,green,and blue lines indicate the synchrotron radiation experimental data,the calculated fitting value, the difference between experimental and calculated values,and the corresponding Bragg diffraction peaks,respectively.
The deformation electron density, residual electron density, and Laplacian maps in the (110) and (111) planes of CeO2are presented in Fig.3. The residual electron density is not accounted for during the multipole refinement, which reflects the accuracy of the obtained deformation electron density. The residual electron density is the difference between the experiment data and the multipole model; it is uniform and featureless [Figs. 3(b) and 3(e)] except near the nucleus where it accumulates, which indicates high-precision diffraction data and adequate modeling. The deformation densities are defined by the difference between the spherical atom and nonspherical multipole models, and typically show electrondensity accumulation in lone pair regions and bonds. The deformation density can be regarded as the valence electron distribution. It is clearly seen in Fig. 3(a) that there is a nearly spherical electron-density distribution around the Ce ions and a low electron density in the Ce–O interstitial region(ρBCP=0.39e·˚A-3). The Laplacian maps are the second partial derivative of the electron-density maps and more significantly indicate the electron-density trends. Figures 3(c) and 3(f) show that electron density is depleted in the interaction surface as a result of the contraction of electron density toward Ce and O.This indicates that the interaction between Ce and O is weak.[23]If there is a strong hybridization between Ce and O, the electron density overlap between these two atoms would be obvious.[37,38]However, no shared electron picture was observed between any pair of atoms in Figs.3(a)and 3(d),which is characteristic of covalent bonds. This approximately isotropic(or spherical)valence electron density indicates that the Ce–O interaction is weak, which is beneficial for the formation of oxygen vacancies in CeO2.
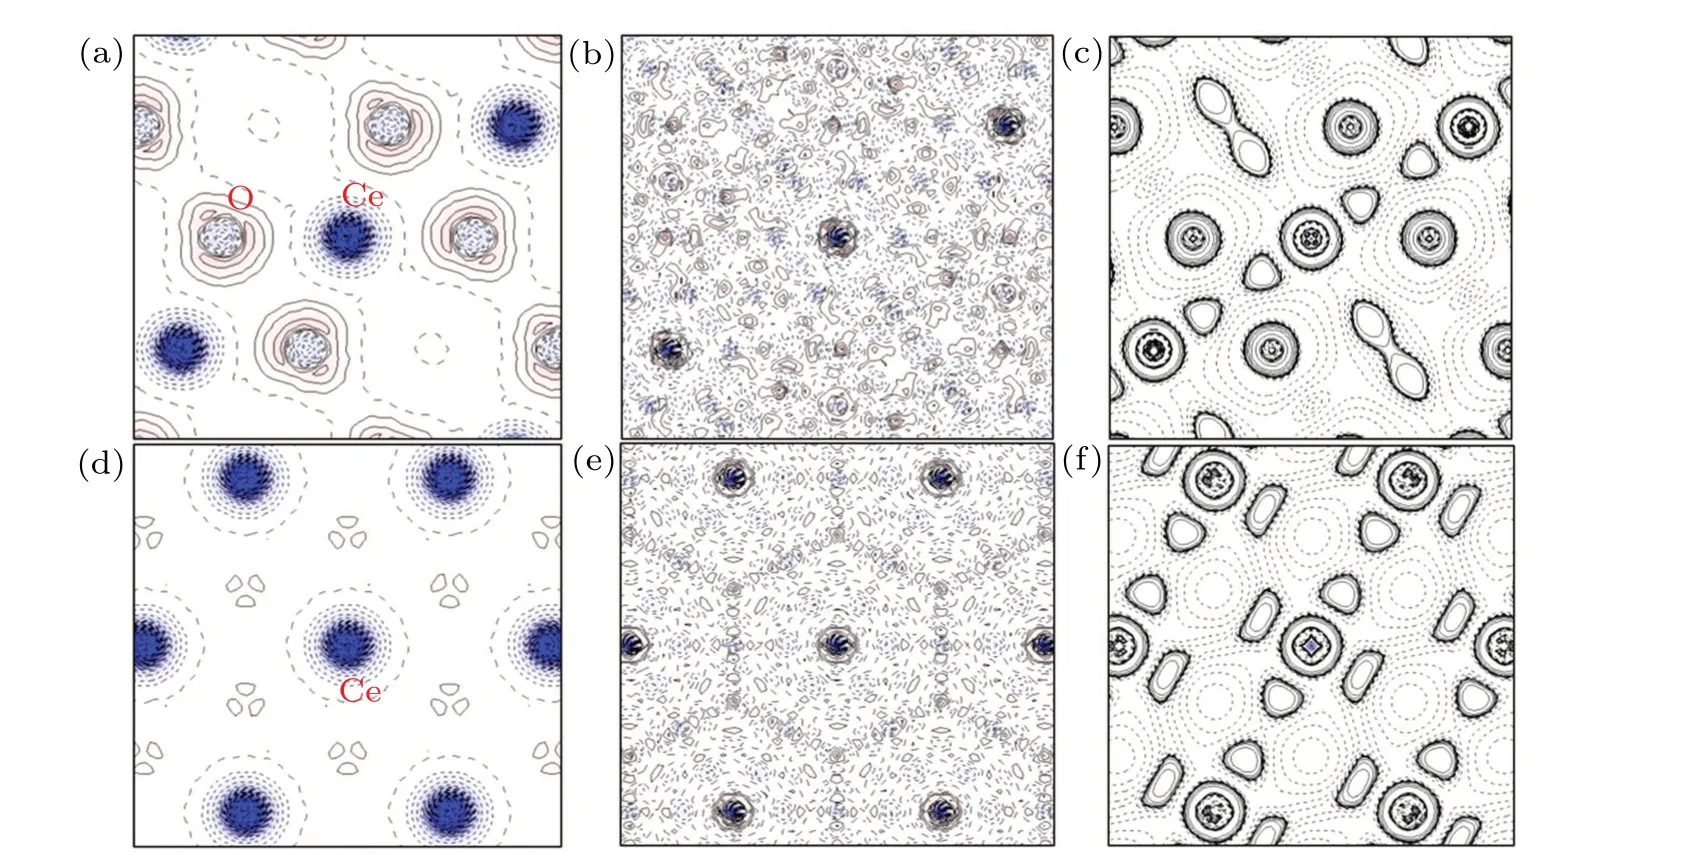
Fig.3. Deformation electron density,residual electron density,and Laplacian maps of CeO2. (a)and(d)Static multipole deformation density maps of CeO2 in the(110)and (111)planes, respectively. (b)and (e)The residual electron density maps in the(110) and(111) planes, respectively. Positive and negative areas are represented by red(solid contour line)and blue(dashed contour line),respectively. Contour line intervals in[(a),(b)]and[(d),(e)]are 0.1 e· ˚A-3. (c)and(f)Experimental contour maps of the Laplacian of the electron density,L(r)=-∇2ρ(r)with(c)being based on(a), and(f)being based on(c). Contours in(c)and(f)are drawn at±a·10n e· ˚A-5 with a=2,4,8 and n=±3,±2,±1,0(positive and negative values are represented by solid and dashed lines).
Quantitative topological analysis of electron density distribution provides a quantitative description of the interatomic interactions based on bond critical points (BCPs), i.e., the maximum or minimum electron densities between bonding atoms.[39,40]The topological properties of the Ce–O bond are shown in Table 1.The BCP of Ce–O is 1.2912 ˚A and 1.0998 ˚A away from the Ce and O atoms, respectively. The electron density (ρBCP) and the Laplacian (∇2ρBCP) at the BCP are 0.39e·˚A-3and 5.41e·˚A-5,respectively,indicating a closedshell interaction between bonded Ce and O atoms. This also proves a relatively weak interaction between bonded Ce and O atoms.[41]Based on the above findings,it could be deduced that the weak interaction of the Ce–O bond facilitates the formation of oxygen vacancies in CeO2, making it an excellent catalyst for redox reactions.is the reason for the low oxygen vacancy formation energy,which makes the redox performance and catalytic activity temperature of CeO2superior to the other two catalysts.
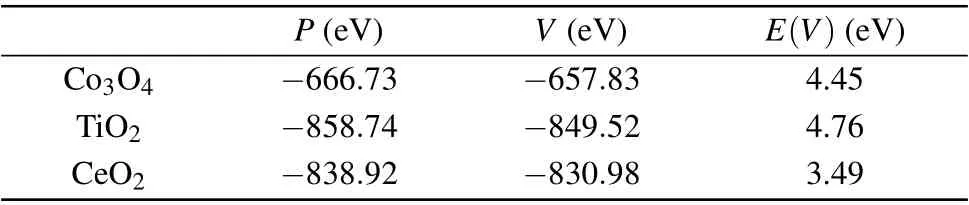
Table 2. Oxygen vacancy formation energy of CeO2 and two other redox catalysts.
To verify the above experimental results, first-principles calculations were performed to obtain the oxygen vacancy formation energy of CeO2and two other redox catalysts, as shown in Table 2. The space groups of TiO2and Co3O4used in the calculations areP42/mnmandFm¯3m,respectively.The oxygen vacancy formation energy of CeO2is obviously lower than those of the other two catalysts. A previous study of deformation charge density in TiO2indicated that there is obvious hybridization between bonded Ti and O atoms, which resulted in a stronger Ti–O bond.[14]Therefore, it can be inferred that the weak closed-shell interaction of Ce–O bond
4. Conclusions
In summary, we have investigated the atomic structure,electron-density distribution, oxygen vacancy formation energy, and chemical bonding of CeO2by iDPC-STEM, synchrotron powder XRD, and first-principles calculations. The structure of CeO2has been unraveled using iDPC-STEM via high-contrast imaging of light O atoms and its high resolution(~0.75 ˚A).Through multipole refinement of synchrotron powder XRD data, we model deformation density and negative Laplacian maps of CeO2. No obvious electron density between the Ce–O bond due to hybridization is observed. Based on quantitative topological analysis, we analyze the unique BCPs of the Ce–O bond to confirm that the electron concentration has a relatively small value (ρBCP=0.39e·˚A-3) and the electron density is depleted in the interaction surface between Ce and O atoms. The result of first-principles calculations proposes that the oxygen vacancy formation energy of CeO2is lower than those of two other redox catalysts (TiO2and Co3O4). These findings indicate that the strength of the Ce–O bond is relatively weak and it is this weak chemical bond strength that leads to its low oxygen vacancy formation energy. This subsequently low oxygen vacancy formation energy makes it easy to produce oxygen vacancies in CeO2, which subsequently provides superior catalytic activity. This work reveals the mechanism of oxygen vacancy formation from the point of view of electron density and provides new insight into controlling the formation of oxygen vacancies in catalytic materials through weakening the bonding strength of metal-oxygen bonds, such as through doping or interfacial construction.
Acknowledgements
This work was supported by the Beijing Natural Science Foundation(Grant No.Z190010),the National Key R&D Program of China(Grant No. 2019YFA0308500), the Strategic Priority Research Program of Chinese Academy of Sciences(Grant No.XDB07030200),the Key Research Projects of Frontier Science of Chinese Academy of Sciences (Grant No. QYZDB-SSW-JSC035), and the National Natural Science Foundation of China (Grant Nos. 51421002, 51672307,51991344,and 52025025).
杂志排行

Chinese Physics B的其它文章
- Formation of high-density cold molecules via electromagnetic trap
- Dynamics of molecular alignment steered by a few-cycle terahertz laser pulse
- Terahertz spectroscopy and lattice vibrational analysis of pararealgar and orpiment
- Molecule opacity study on low-lying states of CS
- Finite-time Mittag–Leffler synchronization of fractional-order complex-valued memristive neural networks with time delay
- Ultrafast Coulomb explosion imaging of molecules and molecular clusters