Analyzing hydro abrasive erosion in Kaplan turbine: A case study from India*
2016-12-06AnantKrRAIArunKUMAR
Anant Kr. RAI, Arun KUMAR
Alternate Hydro Energy Centre, IIT Roorkee, Roorkee, India, E-mail: anantkrai@gmail.com
Analyzing hydro abrasive erosion in Kaplan turbine: A case study from India*
Anant Kr. RAI, Arun KUMAR
Alternate Hydro Energy Centre, IIT Roorkee, Roorkee, India, E-mail: anantkrai@gmail.com
Sediment flow through hydro turbine causes erosion of hydraulic components resulting in drop of turbine efficiency, particularly in hydropower plants of the Himalayan region. The measurement of erosion and monitoring of sediment flow in turbine are major concerns in erosion study. Attempts have been made to study erosion mainly in Pelton and Francis turbines. In this study, a simple and effective method has been presented to measure erosion in a Kaplan turbine of a run-of-river scheme Chilla hydropower plant in foothills of Himalaya. Recent techniques were used to measure sediment parameters like concentration, size, shape and mineral content. A standard erosion model is applied to estimate the erosion in Kaplan turbine blade, runner chamber and draft tube cone. A calibration factor has been proposed to apply the erosion model for site specific conditions. It has been found that the outer trailing edges of the turbine blade and upper runner chamber are most erosion prone zones. Sediment analysis revealed that effective operation can reduce erosion in turbine components. The estimated erosion values from model are found to be consistent with measured values. Finally, suggestions for design improvements and effective operation of erosion affected hydropower plants are given.
turbine, sediment, erosion, measurement, IEC 62364, hydropower
Introduction
The sediment flow causes reduction in the active life of reservoirs, erosion of hydro-mechanical equipment and civil engineering structures. It is very difficult to remove all the silt before passing through hydro turbine especially in run-of-river hydropower plants. The silt in Himalayan region contains mainly quartz(65%-81%), an extremely hard mineral with hardness 7 on Mohs scale causing severe damage to hydraulic machinery[1-3]. This erosion of turbine parts abets cavitation, pressure pulsation, vibration, mechanical failures and associated frequent shut downs. The outcome of this is a gradual reduction of the output efficiency of the plant[3-6]. Increased global deployment of hydro,a renewable and sustainable energy, calls for the strong need for hydro-erosion related studies. The hydroabrasive erosion due to sediment laden water is a complex process and depends on many factors such as sediment characteristics, flow characteristics and properties of substrate materials (hardness, surface morphology, properties of the coating)[7-9]. Although the parameters for hydro-abrasive erosion have been identified, to which extent these parameters contribute to the hydro-abrasive erosion is not fully understood[6,7,10].
One of the major difficulties in erosion study is the measurement of erosion[11,12]. In laboratory set-ups,the specimens are small in size and flat in shape, which allow relatively easy measurement of erosion by weight loss, volume loss, surface roughness or deformation dimension methods[8,11]. However, erosion measurements in prototype plants are difficult due to largesized and non-flat components. The formation of erosion ripples makes the measurement of local thickness difficult. The thickness reduction is measured using general calipers during maintenance period of plants[11]. However, a major problem with this kind of erosion measurement is in locating the reference point for measurement. Moreover, higher accuracy of erosion data requires erosion measurement at more points on the profile. Recently, researchers have initiated and measured the erosion with optical 3-D scanners in prototype plants[4,5].
IEC 62364[13]outlines the information about the erosion study in hydro-turbines but does not provide the details of method of measurement for erosion though factors such as location, minimum number of erosion point measurements and number of turbine bladesto be inspected for Francis, Pelton and Kaplan turbine have been provided. Few terms used in the IEC 62364[13], like the flow coefficient (Kf) and exponent of RS ()p, are not prescribed for Kaplan turbine erosion. Several studies have produced estimates of erosion in prototype Francis[7,9,10]and Pelton turbines[3-5,14], but studies for Kaplan turbine are still insufficient. Monitoring suspended sediment properties like concentrations, size distributions, shape and mineral content along with erosion of turbine is still not common practice, which leads to inadequate information on erosion phenomenon[13].
In the present study, a run-of-river hydropower plant, located on Ganga river, India, is considered for erosion study. As per literature, the studies have focused mainly on the erosion of turbine blades rather than components of turbine i.e., runner chamber, draft tube etc. The objective of this case study is to present a simple approach to measure the erosion on the turbine blades, the runner chamber and the draft tube cone of a prototype Kaplan turbine unit. The content of this paper is composed of five parts. The first part deals with information of hydropower plant under study. The second part explains the methodology adopted for measuring erosion in different components of turbine unit, sediment properties measurement and process of estimation of erosion model parameters. The third part presents the results and explains the findings in context of literature. The fourth part explains the uncertainty involved in the study and the fifth concludes with steps to improve the erosion affected hydropower plants. The current study shall be useful for hydropower plant managers and researchers to measure erosion and develop a strategy for handling erosion issues effectively.
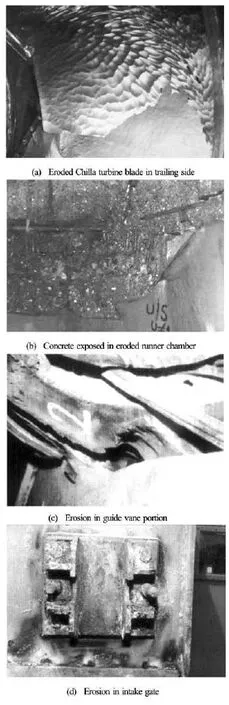
Fig.1 Eroded components of Chilla hydropower plant
1. Study area
The Chilla hydropower project is a run-of-river scheme on river Ganga located upstream of the city of Haridwar in the foothills of Himalayas and was commissioned in the year 1980-1981. There are 4 Kaplan vertical shaft turbines of 36 MW capacities each with design head of 32.5 m at 187.5 rpm. A diversion barrage with head regulator is located at Pashulok,5 km downstream of Rishikesh town, for diversion of water to a 14.3 km long, 565 m3/s capacity lined power channel. Since commissioning of the power plant, the turbine components faced severe erosion[15]. The high erosive silt from river Ganga caused extensive damage to the underwater parts of hydro turbine units, cooler tubes, drainage pump impellers and valve seat. In initial years of the power plant, the blades were found to be extremely eroded and cracked in trailing side after few monsoon seasons[15]. The runner chamber also observed extensive erosion requiring heavy maintenance after every few years. Figure 1 shows the eroded components of Chilla hydropower plant from maintenance records during initial days. However, the erosion scenario improved significantly in recent years[16]due to the enhanced hydrological regulation in upper basins owing to commissioning of 239.5 m high over river bed earth rock fill Tehri dam in the year 2006. The hydropower plant is owned and operated by state utili-ty Uttarakhand Jal Vidyut Nigam Ltd., which was incorporated from the Uttar Pradesh State Electricity board[17].
To minimize the entry of large size sediment in power channel, silt excluders have been provided in the river itself below the under sluice portion of the diversion barrage. Further, coarser sand from the diverted water is removed through a silt ejector constructed in the bed of the power channel 200 m downstream of the head regulator. The silt ejector has been designed to remove all sediment particle size greater than 0.5 mm[17].
2. Methodology
The erosion of Kaplan turbine blades as well as other parts of the turbine like runner chamber and draft tube cone were calculated from maintenance reports of the Chilla hydropower plant for the years 2007 and 2009[18]. The details of measurement procedures and various parameter calculations are provided in following paragraphs.
2.1Erosion measurement
During maintenance of turbine, an ultrasonic thickness measurement device operating on resonance principle was used to measure the thickness of turbine components before and after repair[18]. The ultrasonic thickness gauge was calibrated with step block of identical material. The surface profiles of the eroded zones were restored with the help of templates. The erosion depth is calculated using Eq.(1).

where Tafterrepairis the thickness of restored profile, Tbeforerepairis the thickness of profile before repair and TErosionis the erosion depth measured.

Fig.2 A turbine blade number 3 showing the grid lines
In order to create reference points for the measurements, all the six turbine blades of a unit were divided into grid cells drawn with paint before repair and then, the remaining grid lines after repair were connected to get the initial grid lines (Fig.2). Only half of the blade was marked on the pressure side towards trailing end due to erosion prevalent mainly in that portion. The distance between two adjacent grid lines was decided by the extent of erosion on blades. Figure 3 shows a simplified sketch of a blade with grid cells. A total of 4 readings of thickness were recorded in each 25 grid cells on pressure side surface of a blade, both before and after repair. The thickness measurements were performed on 6 turbine blades with 100 measuring points on each. The numbers of thickness measurement inside a grid cell were averaged to obtain a single value of erosion depth inside a grid cell. The erosion depth of a blade was obtained by averaging erosion depth of grid cells in two zones-trailing side(A1, B1, C1, D1 and E1 cells) and tip side (A2, A3,A4 and A5 cells).

Fig.3 Kaplan blade of Chilla turbine showing grid cells. Modified from Ref.[18]

Fig.4 Grid divisions and different parts of runner chamber and draft tube cone

Table 1 Erosion model associated parameters as per IEC-62364[13]
In runner chamber and draft tube cone, the vertical grid lines, which originated from each guide vane vertically downwards, were equidistant. A total of 24 vertical grid lines corresponding to 24 guide vanes, as shown in Fig.4, were drawn. For the purpose of measurement, 5 horizontal grid divisions were made in the runner chamber corresponding to 5 major parts of runner chamber, i.e., upper cone, middle cone, lower cone, mild steel (MS) cone and compensating cone as shown in Fig.4. Similarly, the draft tube cone was divided into 4 horizontal grid divisions, i.e., top, middle 1, middle 2 and bottom. The erosion depth in each grid cell of runner chamber and draft tube cone was obtained from averaging 4 measured points.
2.2Sediment properties measurement
In order to measure sediment concentration, manual samples were collected from downstream of silt ejector during the year 2007 and 2009 by the plant owner. The frequency of sampling was twice daily during monsoon period from mid-June to mid-October. However, the sampling frequency increased to three times daily during high sediment flow conditions to capture the variation in sediment concentration. The sediment after passing through the desilting arrangement of silt ejector was considered to be identical with the sediment inflow into the turbines, as no deposition of sediment was observed in entire power channel and forebay tank. The particle size distribution of a sediment sample was determined from sieve analysis of a dried sample of 100.5 gm through 5 different size sieves. The weights corresponding to each sieve class were used to calculate the median size50()d of sediment in the sample. Moreover, the sizes of particles were also re-affirmed visually from scanning electron microscope (SEM) photographs. Sediment mineral composition and content was determined from powdered X-ray diffraction (XRD) analysis. The sediment shape was determined from SEM photographs as recommended in IEC-62364[13].
2.3IEC parameters calculation
The IEC model of erosion is applied to calculate average loss of material from turbine blade and runner chamber zones for 2007 and 2009. The parameters of the model and their respective definitions are listed in Table 1.
The parametersfK and p are calibration factors for the IEC 62364[13]erosion model to fit site specific conditions for specific eroded component. However, IEC 62364[13]does not specify these values for components of Kaplan turbines. Moreover, for a specific hydropower plant, the factorsfK and p cannot be calculated separately for a particular component. This is because: RS remains the same for a hydropower plant component, so, a change in other variables such as S, PL, W andmK will always keep (K/RSp) factor intact. Hence, a new calibra
f tion factor (CF), combining fK and p is introduced for the model as given in Eq.(2).

The CF was calculated from erosion depth in 2007 and 2009 using equation in Table 1. The obtained CF value was used to calculate the erosion depth. The erosion depth obtained from model was then compared with measured erosion depth and the percentage of the difference between these values of erosion was calculated using Eq.(3).
The percentage of difference in

where TEstimatedis calculated erosion depth from IEC 62364 and TMeasuredis measured erosion depth. Table 2 shows relevant data for one turbine unit in Chilla hydropower plant.
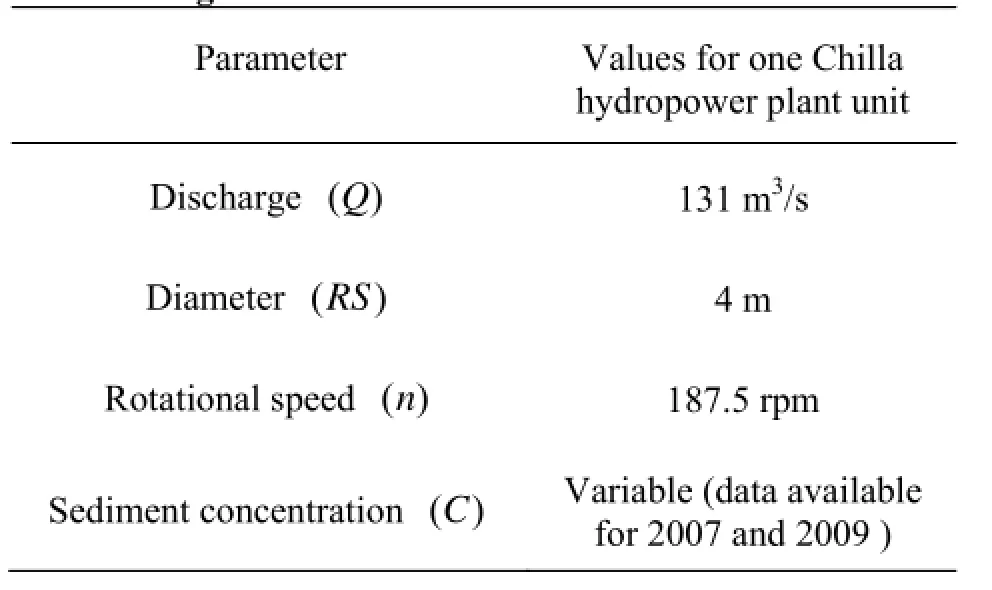
Table 2 Relevant data from Chilla HPP for erosion modelling
3. Results and discussion
The erosion of 6 different turbine blades of same unit encountered same erosion conditions over time. However, the amount of erosion depth of these blades varied considerably as shown in Table 2. It is apparent from this table that average erosion depth showed variation in time, i.e., 2007 and 2009. The maximum depth of erosion measured were 6.9 mm, 9.4 mm,9.4 mm, 18.2 mm, 2.5 mm and 12.8 mm on blade number 1-6 respectively in 2007. The corresponding values of maximum depth of erosion in the year 2009 were 13.8 mm, 11.1 mm, 10.1 mm, 11.5 mm, 6.5 mm and 10 mm. Further analysis of the erosion data revealed that the major erosion was found on the blade outlet cells, whereas minor erosion was observed on the blade radial end, i.e., blade tip. Figure 5 presents this pattern of erosion of turbine blade surface. Other cells of the turbine blade showed no erosion. This finding of the present study is consistent with the findings of Kumar and Tyagi[19].

Fig.5 Zones of erosion and shape of turbine blade. Adapted from Tyagi[15](I: Simple bending about trunnion in -Z direction, II: Torsion about nodal line (twist can be observed in viewing direction), III: Chord-wise bending with two nodal lines)
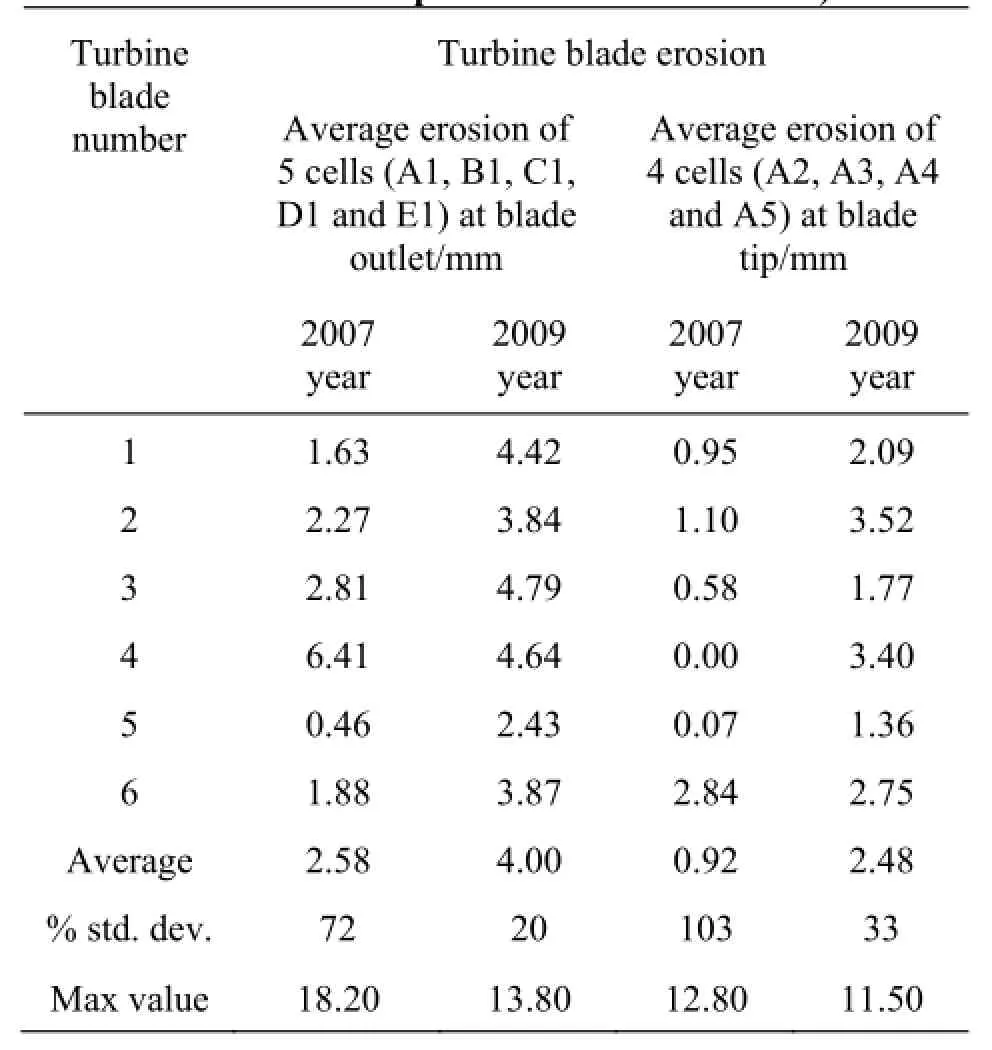
Table 3 Turbine blade erosion depth for 2007 and 2009(Source: Calculated from Chilla hydropower plant maintenance report for 2007 and 2009[18])
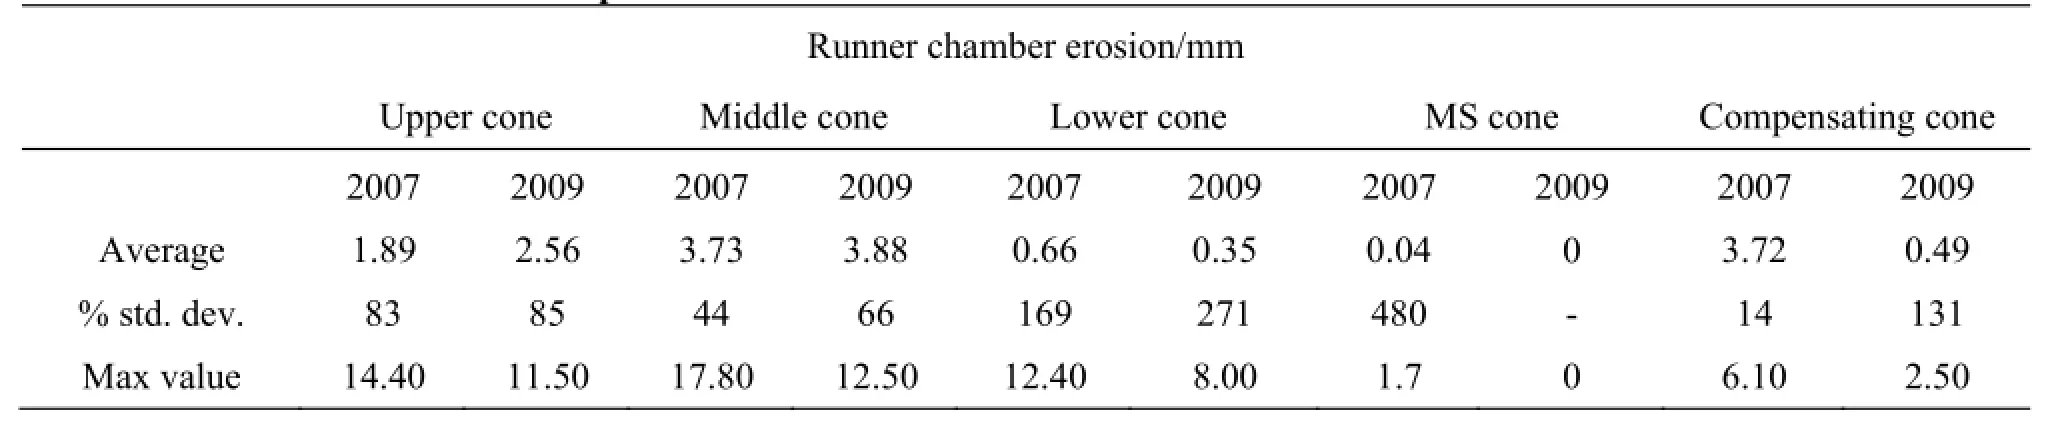
Table 4 Runner chamber erosion depth for 2007 and 2009[18]
For better understanding, the shape and respective orientation of the turbine blade apart from zones of erosion on the blade surfaces have been shown in Fig.5. To distinguish between these two erosion zones, i.e.,blade outlet and blade tip, their erosion analysis were considered separately in this study. Table 3 presents the average values of erosion in each blade outlet, i.e.,cells A1, B1, C1, D1 and E1, for years 2007 and 2009. Cell A1 was the most severely affected due to erosion. The past experience revealed that the cell A1 was even removed due to erosion and cracking as shown in Fig.1 at few occasions[19]. Table 3 also shows the average erosion of blade tip, i.e., cells A2, A3, A3 and A4.
The standard deviation of erosion depth of blade outlet was found to be 72% and 20% in years 2007 and 2009 respectively as shown in Table 3. The high values of standard deviation suggest the variation in erosion depth. The variation of blade radial outlet erosion in 2007 is as high as 103%, which can be explained in part by the localized cavity formation due to other processes like cavitation. This finding corroborates the finding of IEC 62364[13], which stated the deviation of erosion depth of the order of 40 % in the runner blade outlet of the Francis turbine. This variation in erosion values have been also explained in IEC 62364[13]with lack of erosion data. However, as per authors understanding, the data variation was more attributed to the nature of metal removal phenomenon rather than the availability of data. The removal of surface material might have taken place due to other activities like cavitation, corrosion or synergy effect of these processes with erosion. The other reason might be that there were minor geometrical differences of the blades after so many years of repairs. Such differences might be responsible for different flow distributions and accordingly different erosion. A similar variation in erosion depth values can be seen in parts of runner chamber as shown in Table 4. Due to erosion in a few cells in MS cone region, a very high value of standard deviation is observed, which can be neglected.
Table 4 shows the average, standard deviation in percent, the maximum and minimum values of erosion depth in different parts of runner chamber. It is evident from the Table 4 that the most severely affected parts of the runner chamber were the upper cone and middle cone, whereas the MS cone was least affected. A possible explanation for no erosion in MS cone might be that the MS cone zone has diverging shape,as given in Fig.6, which made it less prone to erosion. The convergent shape and proximity to turbine blades turbulence increased the erosion of middle cone. Other three zones, i.e., upper cone, lower cone and compensating cone were cylindrical in shape. The erosion in the upper cone was higher due to turbulence created by the nearby turbine blades. The lower cone shows minor erosion damage, though it is of the order of 10 mm at a few locations. The compensating cone with material mild steel is more eroded in the year 2007 but mildly eroded in 2009. It is difficult to explain this variation, but it might be related to operation of turbine unit in cavitation regime, which resulted in synergy effect of erosion-cavitation to yield higher values of erosion depth.
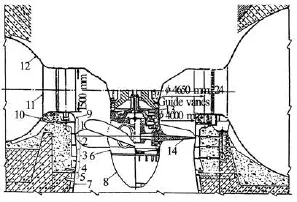
Fig.6 Salient features of the turbines installed in the Chilla hydropower plant. Adapted from Tyagi[15](Runner chamber: 1-Upper cone, 2-Middle cone, 3-Lower cone,4-MS cone, 5-Compensating cone. 6-Runner hub,7-Draft tube cone, 8-Runner cone, 9-Bottom ring,10-Stay ring, 11-Stay vanes, 12-Sprial casing,13-Runner servomotor, 14-Runner blade)
As per plant maintenance report, eroded runner chamber with erosion marks are shown as Fig.7. The erosion marks on this surface of runner chamber were around 450 with vertical grid lines as shown in Fig.7. The observed inclination of erosion marks could be attributed to the relative velocity of water flow with respect to runner chamber. The rotation of turbine blade and continuous flow of water in axial direction resulted in such relative velocity. The draft tube cone,the portion joining the draft tube with runner chamber,got negligible amount of erosion due to diverging shape as shown in Fig.6. The maximum depth in a few cells was found to be of the order of 1 mm whereas most of the cells observed no erosion at all. This is due to the fact that the erosion velocity in draft tube cone is reduced.

Fig.7 Eroded runner chamber with grid lines

Fig.8 SEM photograph of sediment sample from Chilla HPP
The measured sediment concentration values throughout the year revealed that a maximum concentration of 3.6 g/l and 5.3 g/l passed through turbine blades in 2007 and 2009 respectively., From the analysis of sediment concentration data recorded by the plant owner, it was found that 47% of the sediment load passed through only 20 days in 2007 in the study hydropower plant. The corresponding values in 2009 were even higher, i.e., 49.2% of the sediment load in just 12 d. It is encouraging to compare this figure with that found by Chakrapani and Saini[20]hat the annual sediment load of 70%-90% is transported during 14 d-24 d of the monsoon season in the Himalayan region. Rai[16]presented a detailed study of variation of sediment concentration in power channel with river discharge. The mean value50()d of particle size obtained from sieve analysis was 0.174 mm. In the sample, 98.6% the particles measured had particle size below 0.5 mm, the designed size exclusion limit of desilting arrangement of the study hydropower plant. However, 95.2% of particles were below 0.355 mm in size, which indicated proper functioning of silt ejectors. This also showed that mostly fine sand and silt particles had passed through turbine unit of the study hydropower plant. The XRD analysis is used to identify the main minerals and to calculate their respective percentage presence in the sediment sample. The main minerals found in the sample were quartz, feldspar,biotite, muscovite, calcite, rutile, pargasite and clay minerals, which were similar to the findings of Virmani and Tyagi[21]. 73% of minerals were found to be quartz which is harder than the turbine material. SEM image revealed that most of the particles are semi-angular in nature as shown in Fig.8.
Due to semi angular nature of sediment particles,the sediment shape factor given in IEC-62364[13]was chosen as 1.5. The concentration value was used with other relevant values to calculate PL and other parameters of IEC-62364[13]erosion model as shown in Table 5.
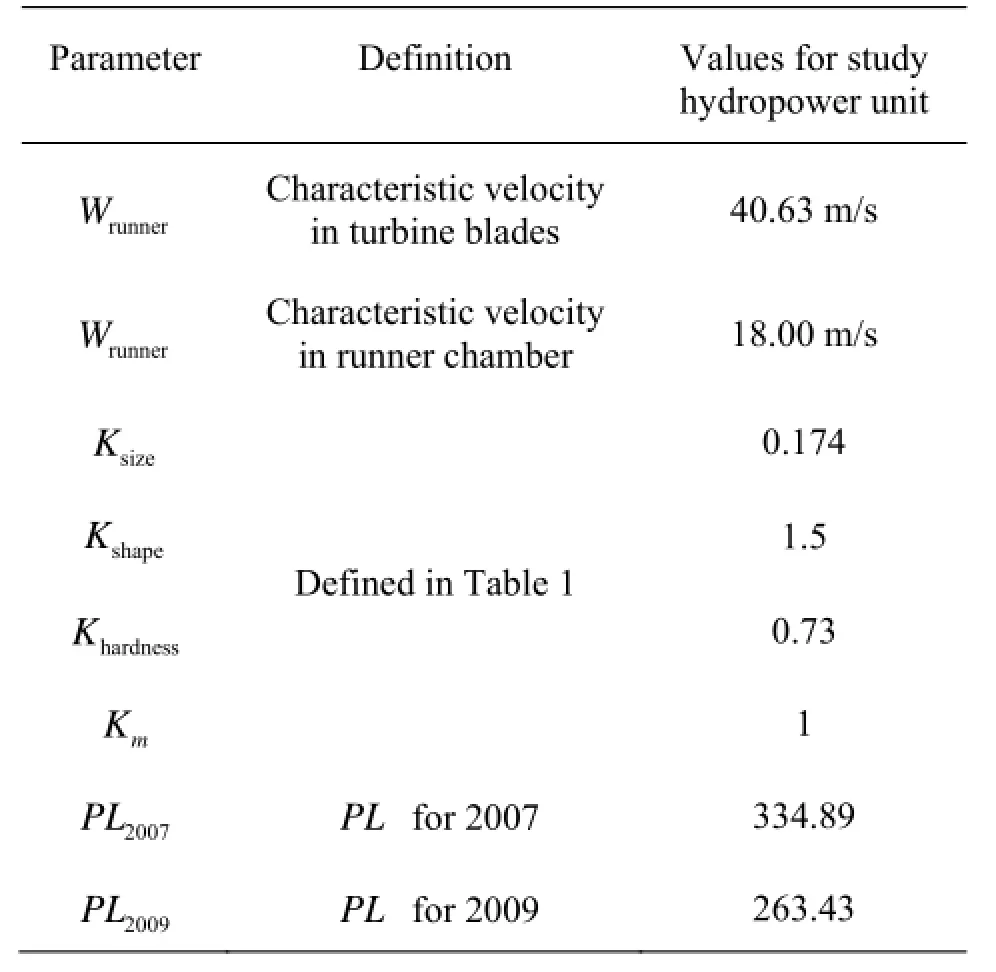
Table 5 Calculated values for Chilla HPP
The obtained CF values for different components are presented in Table 6. The estimates of erosion values as per IEC 62364[13]and respective % deviation were also provided in the Table 6. The deviations in erosion estimates were as high as 55 % for turbine blade tip and 14% for runner chamber middle cone. This variation might be caused due to many reasons such as unconsidered processes like cavitation, variation in microstructure of eroded surface, exposure of different erosion condition at micro-level and less frequent measurement of sediment properties. The deviation is expected to decrease with conducting more number of erosion studies. Similar deviations in obtaining flow coefficient are reported in IEC 62364[13].
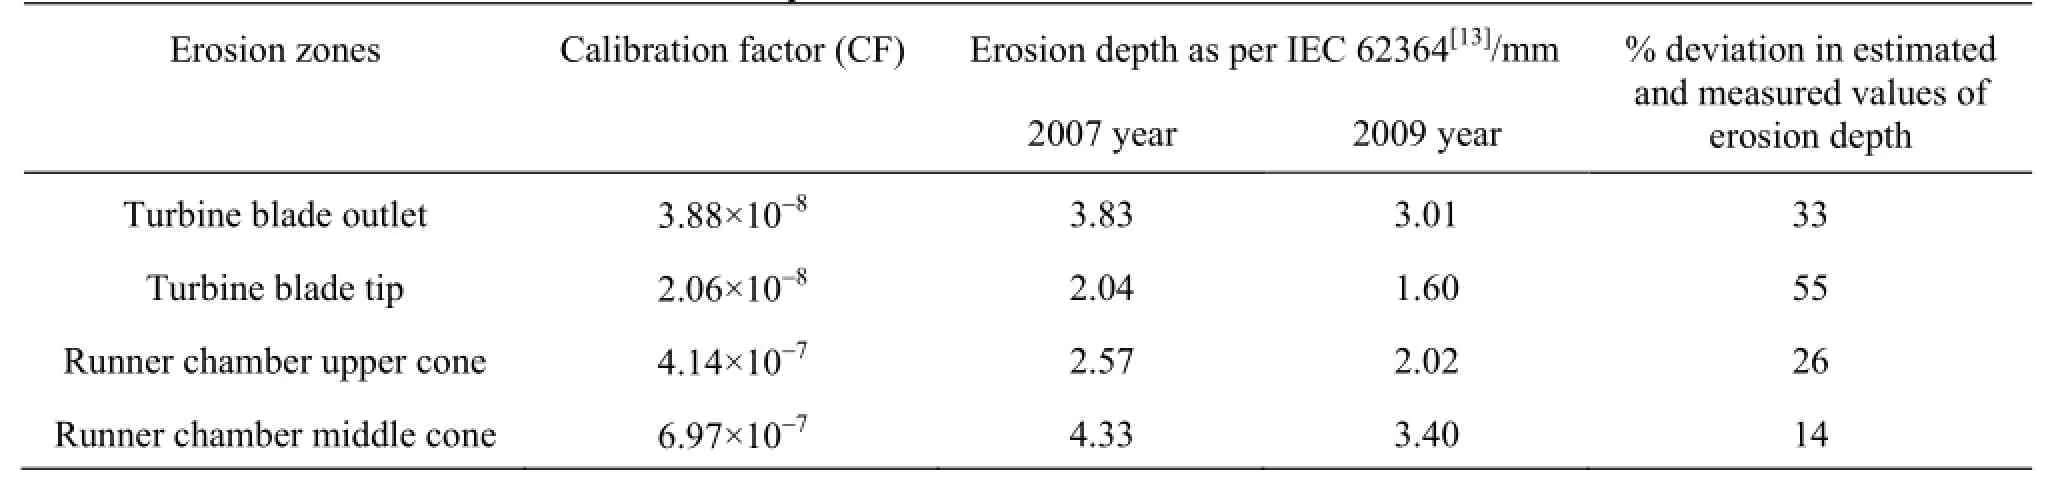
Table 6 Calculated value of erosion in different parts
The value of erosion depth varied considerably for different components like turbine blade and runner chamber for same year as well as different years. Even for the same component of turbine, the magnitude of erosion depth varied at different locations on the component surface. This variation is attributed to the nature of material removal. The erosion depends on many factors such as flow parameters, sediment parameters and surface properties. This dependence on many parameters involves inaccuracy to intrude in different ways. Some factors like microstructure of the component surface, operational variation during the year, cavitation, corrosion etc. are not considered in this study. Moreover, the size of the components is large and the amount of erosion is substantially less, like erosion depth of order of 4 mm for the runner diameter of 4 m.
The erosion phenomenon can be reduced with different approaches suggested by researchers like catchment area treatment, design modification of the hydraulic components, material improvement of the surfaces and settling of sediments before entry to turbine unit[8-11,19,22]. Here, a new approach for designing the turbine to reduce erosion in Kaplan turbine blade is discussed with following set of Eqs.(4)-(6).
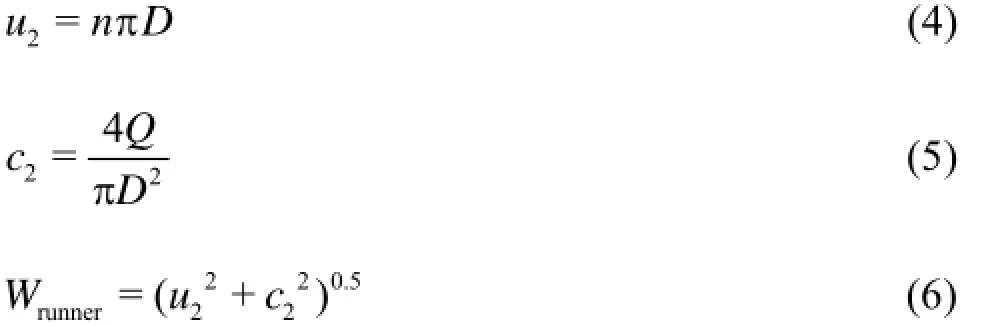
where2uis peripheral velocity and2c is axial velocity of water in turbine. The characteristics velocity(Wrunner) is very important parameter in calculation of erosion with exponent of 3.4. From Eq.(6), Wrunnerdepends on2u and2c values, which are obtained from design considerations for a site i.e., runner diameter()D and discharge ()Q of Kaplan turbine. As evident from Eq.(4) and Eq.(5),2u increases whereas c2decreases with increase of D. Hence, there will be an optimum value of D for which Wrunnerwill be minimized. For location with expected erosion issues minimizing Wrunnerwill enhance the erosion performance of the blades. Another approach to reduce erosion can be to stop plant operation for the days of high sediment flow. However, for this decision a cost/benefit analysis considering losses due to stoppage of plant against cost and time of repair has to be carried out.
4. Uncertainty analysis
The uncertainty in the study is computed with help of uncertainty analysis formulae given by Klein and Mcclintok[23], which estimates the uncertainty in a parameter as given below.

where Yδ is absolute uncertainty in measurement of Y, which is a function of independent variables1,X X2,X3,…Xn. The values δX1,δX2,δX3,…δXnare the uncertainties in measurement of basic independent variables X1,X2,X3,…Xn. The main parameters and calculated uncertainty in their measurement are as follows: average erosion = 3.37 %, sediment size = 1.92 %, sediment concentration = 2 %, sediment parameter PL= 2.77%.
The estimation of sediment properties like size,shape and mineral composition is based on a single sample. Due to non-availability of data during the erosion model fitting, it is assumed that sediment with similar properties flowed throughout the year. Morefrequent measurements of these sediment properties will increase the accuracy of model fitting.
5. Conclusions
This paper has presented a case study of erosion in Kaplan turbine of run-of-river hydropower plant on Himalayan river in India. The erosion of turbine components was measured by dividing the eroded portions of the turbine unit into smaller grid cells and by measuring the erosion thickness with an ultrasonic thickness gauge during maintenance. The results of this study showed high variation in erosion depth in the various turbine components, especially on each of the 6 blades. This study has showed that the trailing side of the turbine blade is most prone to erosion whereas furrows of erosion are caused in tip side. The other major finding is that the runner chamber portion near the turbine blade is susceptible to erosion, hence erosion resistant material must be used for this region. This method can be easily implemented at other power stations to measure erosion thickness, which will allow better data collection and hence better information for effective decision making in erosion issues. This type of erosion measurement is less costly and can be done along with in-situ repair of the turbine.
The measurements of another important parameter of erosion besides erosion thickness, i.e., sediment properties are also presented. The results suggested that high erosion producing sediment concentration have passed through within a few days of the year. The operation of plant can be adjusted during these days to reduce erosion. The erosion model proposed by IEC 62364[13]has been applied to the study hydropower plant. The erosion model has been found to work satisfactorily, however, deviations were observed between calculated and measure values of erosion depth due to availability of only 2 years of data. For precise erosion prediction, it is required to conduct more erosion studies which would enhance the knowledge of influencing parameters and their quantitative influence.
Acknowledgements
The authors would like to thank Ministry of Human Development Resource (MHRD), India for the financial support. Further, this study was made possible by help of Uttarakhand Jal Vidyut Nigam Ltd. and Chilla hydropower plant. We thank Mr. Adesh Tyagi,who provided insight and expertise that greatly assisted the research.
References
[1]DRAGANITS E., GIER S. and HOFMANN C. C. et al. Holocene versus modern catchment erosion rates at 300 MW Baspa II hydroelectric power plant (India, NW Himalaya)[J]. Journal of Asian Earth Sciences, 2014,90(4): 157-172.
[2]BAJRACHARYA T. R., ACHARYA B. and JOSHI C. B. et al. Sand erosion of Pelton turbine nozzles and buckets: A case study of Chilime Hydropower Plant[J]. Wear,2008, 264(3-4): 177-184.
[3]SINGH M., BANERJEE J. and PATEL P. L. et al. Effect of silt erosion on Francis turbine: A case study of Maneri Bhali Stage-II, Uttarakhand, India[J]. ISH Journal of Hydraulic Engineering, 2013, 19(1): 1-10.
[4]WINKLER K. Hydro-abrasive erosion: Problems and solutions[J]. IOP Conference Series: Earth and Environmental Science, 2014, 22(5): 052022.
[5]ABGOTTSPON A., STAUBLI T. and FELIX D. et al. Hydro-abrasive erosion of Pelton buckets and suspended sediment monitoring[C]. Proceedings of the Hydro Vision International. Denver, USA, 2013.
[6]ABGOTTSPON A., STERN P. and STAUBLI T. et al. Measuring turbine abrasion and efficiency decrease: First results of the case study at HPP fieschertal[C]. Hydro 2013. Innsbruck, Austria, 2013
[7]THAPA B. S., DAHLHAUG, O. G. and THAPA B. Sediment erosion in hydro turbines and its effect on the flow around guide vanes of Francis turbine[J]. Renewable and Sustainable Energy Reviews, 2015, 49: 1100-1113.
[8]RAI A. K., KUMAR A. and STAUBLI T. Developing a test rig to measure hydro-abrasive erosion in Pelton turbine[C]. International Conference on Hydropower for Sustainable Development. Dehradun, India, 2015.
[9]THAPA B. S., THAPA B. and DAHLHAUG O. G. Current research in hydraulic turbines for handling sediments[J]. Energy, 2012, 47(1): 62-69.
[10] THAPA B. S., THAPA B. and DAHLHAUG O. G. Empirical modelling of sediment erosion in Francis turbines[J]. Energy, 2012, 41(1): 386-391.
[11] THAPA B. Sand erosion in hydraulic machinery[D]. Doctoral Thesis, Trondheim, Norway: Norwegian University of Science and Technology, 2004.
[12] DUAN C. G., KARELIN V. Y. Abrasive erosion and corrosion of hydraulic machinery. Series on hydraulic machinery[M]. London, UK: Imperial College Press,2003.
[13] International Electrotechnical Commission (IEC). Hydraulic machines. Guide for dealing with hydro-abrasive erosion in Kaplan, Francis, and Pelton turbines[R]. International Electrotechnical Commission (IEC), 2013.
[14] BOES R. M. Real-time monitoring of suspended sediment concentration and particle size distribution in the headwater way of a high-head hydropower plant[C]. Proceedings of the 33rd International Association for Hydro-Environment Engineering and Research (IAHR) Congress. Vancouver, Canada, 2009, 4037-4044.
[15] TYAGI S. K. Operating experience of 4×36 MW Chilla power station[C]. BHEL-Hydro customers meet, 18th. Chandigarh, India, 1998.
[16] RAI A. K. A study of sediment transport and its impact on hydro-turbine in hydropower project[D]. Master Thesis, Roorkee, India: Indian Institute of Technology,2011.
[17] Uttarakhand Jal Vidyut Nigam Ltd. Short report of Chilla hydropower plant (4×36 MW)[R]. Dehradun, India: Uttarakhand Jal Vidyut Nigam Ltd., 2004.
[18] Chilla hydropower plant maintenance report. Job completion report-In situ repair of underwater parts of unit-4,Chilla hydropower plant[R]. 2007 and 2009.
[19] KUMAR A., TYAGI S. K. Problem of heavy damage to runner chamber of Chilla power station and remedial measures[C]. 55th Research and Development Session of Central Board of Irrigation and Power. Hyderabad, India, 1991.
[20] CHAKRAPANI G. J., SAINI R. K. Temporal and spatial variations in water discharge and sediment load in the Alaknanda and Bhagirathi Rivers in Himalaya, India[J]. Journal of Asian Earth Sciences, 2009, 35(6): 545-553.
[21] VIRMANI S. S., TYAGI S. K. Silting problem in hydropower stations in Uttar Pradesh: Case study of Chilla power station[C]. Workshop on silt damages to equipment in hydropower stations and remedial measures,CBI&P. New Delhi, India, 1996.
[22] NAIDU B. S. K. Silting problems in hydro power plants and their possible solutions[M]. London, UK: CRC Press,2004.
[23] KLINE S. J., MCCLINTOCK F. A. Describing uncertainties in single sample experiments[J]. Mechanical Engineering, 1953, 75(1): 3-8.
(August 13, 2015, Revised October 3, 2015)
* Biography: Anant Kr. RAI (1985-), Male, Ph. D. Candidate
杂志排行

水动力学研究与进展 B辑的其它文章
- Sharp interface direct forcing immersed boundary methods:A summary of some algorithms and applications*
- On the modeling of viscous incompressible flows with smoothed particle hydrodynamics*
- Flow characteristics of the wind-driven current with submerged and emergent flexible vegetations in shallow lakes*
- Reverse motion characteristics of water-vapor mixture in supercavitating flow around a hydrofoil*
- Study of fluid resonance between two side-by-side floating barges*
- Modelling of a non-buoyant vertical jet in waves and currents*