多孔与平面硅电极界面的电化学行为
2016-09-13吕京美程璇
吕京美 程璇
(1北京理工大学珠海学院化工与材料学院,广东珠海519088;2厦门大学材料学院材料科学与工程系,福建厦门361005;3福建省特种先进材料重点实验室,福建厦门361005)
多孔与平面硅电极界面的电化学行为
吕京美1程璇2,3,*
(1北京理工大学珠海学院化工与材料学院,广东珠海519088;2厦门大学材料学院材料科学与工程系,福建厦门361005;3福建省特种先进材料重点实验室,福建厦门361005)
研究了重掺杂n-型单晶硅(CSi)在氢氟酸体系中生成多孔硅(PSi)的电化学行为,根据线性极化曲线,选取不同的电流密度,采用恒电流阳极极化法,制备了一系列多孔硅层。利用扫描电子显微镜对其进行了表面和断面形貌的表征,通过线性扫描极化技术和计时电位法,比较了单晶硅电极和多孔硅电极的电化学行为,分析了多孔硅形成前后的塔菲尔曲线和计时电位曲线,给出了多孔硅形成过程中的重要电化学参数,如腐蚀电流、开路电位、塔菲尔斜率等。并对其进行深入分析,根据实验结果,提出了单晶硅电极/电解质界面和多孔硅电极/电解质界面的结构模型,并利用该模型讨论了两种电极界面的电化学特性。
多孔硅;硅电极界面;腐蚀速率;开路电位;极化曲线;界面电化学
Based on our former work11,12,this paper w as carried out to systemically investigate theelectrochemicalbehaviorsof CSiand PSi formedwith differentm icrostructures by anodic polarization in HFand ethanolsolutions.The potential-currentdensity(E-j) and potential-time(E-t)curvesweremeasured during the PSi formation.Morphology and surface species analysis,the electrochem ical responses of CSi electrode/electrolyte and PSi electrode/electrolyte interfaces are compared,and further discussed based on the interfacialmodelsproposed.
2 Experimental
The electrochemicalmeasurementswere done using a flat cell made of polytetrafluoroethy lene(PTFE)w ith a three-electrode system in 40%HF:ethanol(1:2 by volume)solutions on flat n(111)CSi(~25mΩ∙cm)as described previously12.Theworking, counter,and reference electrodeswere CSi,Pt foil,and saturated calomel electrode(SCE),respectively.The AutoLab electrochem icalworking station(Model PGSTAT 30from Metrohm AG, Switzerland)wasused to record theelectrochemicaldata.The PSi layerswere fabricated by constantly applying different current densities(jA)based on the polarization curves for 10m in.The polarization curvewasmeasured from-0.335to 5.665V,while Tafel curvesin thepotential rangeof±250mV versus open circuit potential(EOCP)before(CSielectrode)and after the PSi formation (PSielectrode).Themorphologiesof the PSi layerswereobserved by using the field em ission scanning electronm icroscope(SEM) (LEO 1530,Oxford instrument,Germany)w ithout surface coating.A ll the reagentsused in ourworkweremostly analytical reagent,except the HFsolutionwhichwasguarantee reagent.

Fig.1 Typicalpolarization curveof highly doped n(111)-Si(CSi) in 40%HF:ethanol(1:2 by volume)solutionsat50m V∙s-1The insetshows thepolarization behaviorofCSiat thepotentials<1.0V.
3 Results and discussion
A typical polarization curve of heavily doped n(111)-Si(referred to CSi)electrode in HF-ethanol solutions is presented in Fig.1.It is evident from Fig.1 that the current density initially increased very slow ly w ith the increase of potential,and then increased rapidly at the potentials>0.5V.Minor current oscillationswereobserved at the potentials>3.0V due perhaps to the hydrogen bubbles produced during the anodic polarization.No characteristic peak corresponding to PSi formation was found in Fig.1.
To further investigatew hether the PSi layerswere formed on the CSi surface during the anodic polarization,four current densities,1,10,20,and 30mA∙cm-2,were selected and applied to CSielectrodesw ith the etching time being fixed at10m in.The responded potentials(E)weremeasured asa function of time(t) and the E-t curves are given in Fig.2(a).The responding potentialsdecreased very sharply at the beginning of currentdensity applications,which is usually caused by the double layer discharge,and then reached a pseudo-steady state.However,the time to reach a pseudo-steady state(tps)variedw ith themagnitude of current density applied(jA).It required nearly 2 s to attain stable potential values at30mA∙cm-2,while approximately 50s at1 mA∙cm-2.A shorter tpsata higher jAgenerally indicatesa faster electrochem ical reaction at an electrode/electrolyte interface.A plotof the stabilized potentials(ES)against jAisshown in Fig.2(b). A linear increase in ESwith an increaseof jAwas clearly observed, show ing the rate-determ inate step being hole concentration in space charge layer(SCL)instead of electrolyte concentration.A larger jAvalue im pliesa higher hole concentration in n-type CSi, accordingly,causes a larger redox potential(ES).In addition, apparentoscillationswere observed at jA≥10mA∙cm-2,which m ightbe caused by the formation and evolution of the hydrogen gasoccurred during the polarization process.
The surfacemorphologies of the CSi sam ples obtained after different jAapplications are presented in Fig.3.A sponge-like structurew ith pore diameters ranging 10-20nm was observed and the porosity increased slightly w ith an increase of jAwhich led tomoreuniformed pore distributions.The thicknessof a PSi layer (LPSi)could be roughly determined by the cross-sectional SEMimages(asshow in Fig.4(a,b)),and isplotted against jAin Fig.4(c).Itseemed that the LPSiincreased linearlywith jA,implying thatthe grow th rate of PSi layer strongly depended on themagnitude of jA.
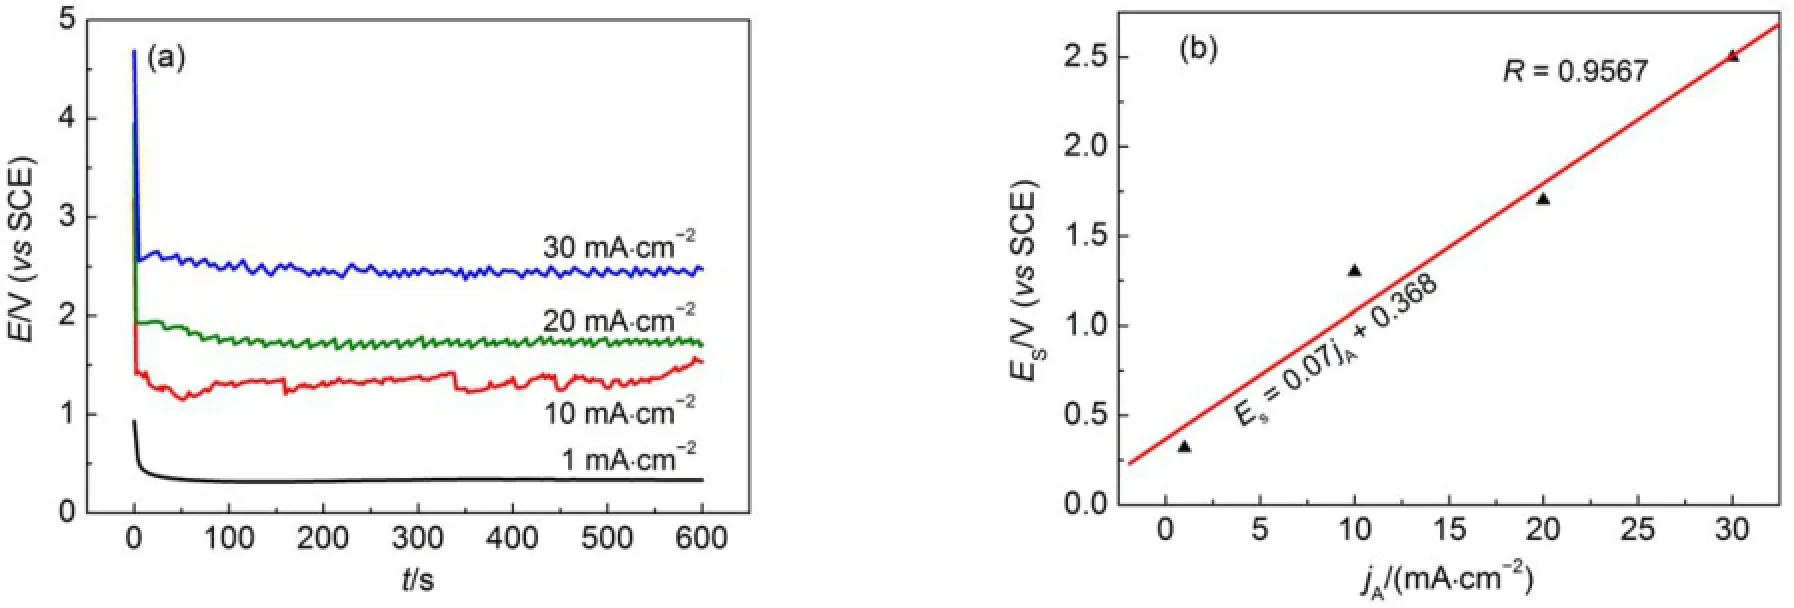
Fig.2 Chronoam peromogram s recorded during the PSi formation(a)and variation of stabilized potentialw ith d ifferent app lied cu rrent densities(b)
In order to obtain kinetic information of charge-transfer reactions occurred on anodic and catholic sitesw ithout introducing any remarked changes into the Si surface,Tafel curves were measured with the Sielectrode before and after theapplications of jAin HF-ethanol solution in the range of±250mV(vs EOCP). The results are shown in Fig.5(a).It is obvious that the Tafel curvesobtainedw ith Sielectrode before jA(representing CSi)were well reproduciblewith the identical EOCPof-0.3V(dashed lines in Fig.5(a)),certified a relatively stable and repeatableelectrode surface state of CSi.How ever,the Tafel curvesobtained after jA(representing PSi)shifted tomore negative potentialsand larger currentdensitiesas jAincreased(solid lines in Fig.5(a)),suggesting that the electrochem ical reactions took place at the electrode surface,leading to PSiformation.
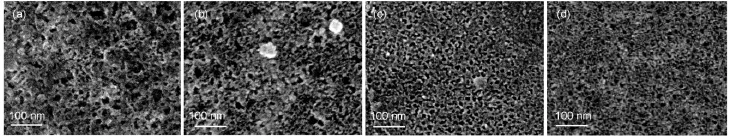
Fig.3 Sur facem orphologies of PSim icrostructures form ed on n(111)-Siw ith the app lied cur rent densitiesof (a)1m A∙cm-2,(b)10m A∙cm-2,(c)20m A∙cm-2,and(d)30m A∙cm-2for 10min

Fig.4Cross-sectionalSEMimagesof PSim icrostructures formed on n(111)-Siw ith theapplied currentdensitiesof(a)10m A∙cm-2, (b)20m A∙cm-2;(c)theobserved th icknessof PSi layers LPSifabricated atdifferent jAvalues for 10m in asa function ofapp lied currentdensity
When the electrode/electrolyte interface is controlled by the activation,the kinetics can be described by the Bulter-Volmer equation.When theoverpotential(η)is largeenough,the Bulter-Volmerequation can be simplified to

where a and b are Tafel constant and Tafel slope,respectively,and can be calculated by the following equations for anodic polarization.
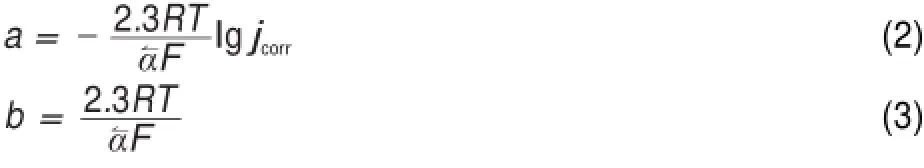
where R is thegas constant,T is the temperature,α↼is the transfer coefficient formultiple electron electrode reaction,which was usually used to estimate the influence of the potential for the electrode reaction activation energy,F is the Faraday constant,and jcorris the corrosion current density.The Tafel slopes includingcathode branch(bc)and anodic branch(ba)were determ ined by fitting the linear regions in Tafel plot,as illustrated in Fig.5(b). The jcorrcan be expressed in terms of the corrosion rate of Siaccording to

where d N/d t represents the changesof Siatom numbers in aunit area and a unit time(atom∙cm-2∙s-1),and NAis the Avogadro′s constant(6.022×10²³mol-1).The important kinetic parameters obtained are summarized in Table1.Evidently,the values of bcand bafor both CSiand PSielectrodeswere approximately the same(ba≈bc)upon each jA,show ing theexcellentsymmetry in the anodic and catholic branches.The relative bigger valuesof bcand ba(0.17-0.38V∙dec-1)observed both for CSiand PSielectrodes indicted that the corrosion rateof Siwasnotcontrolled by the rate of charge transfer in SCL alone,which had a typicalslop of 0.06V∙dec-1for a heavily doped Si13.Thus,the steeper slopswere caused by thepotentialdrop in Helmholtz layer.The typicalvalues of theα↼averaged 0.30for CSi,however,reduced apparently to 0.16for PSi.The Ecorrbecamemore negative,w hile jcorrlowered w ith the increasesof jA.
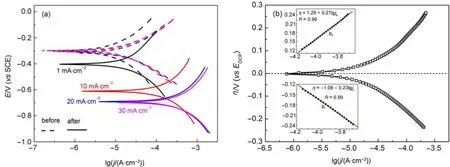
Fig.5(a)Polarization curvesobtained before and after the PSiformation;(b)a Tafelplot for typical n(111)-SielectrodeThe Tafelslopes including cathodebranch(bc)and anodic branch(ba)(insets)weredeterm inedby fitting the linear regions in Tafelplot,as illustrated in Fig.5(b).
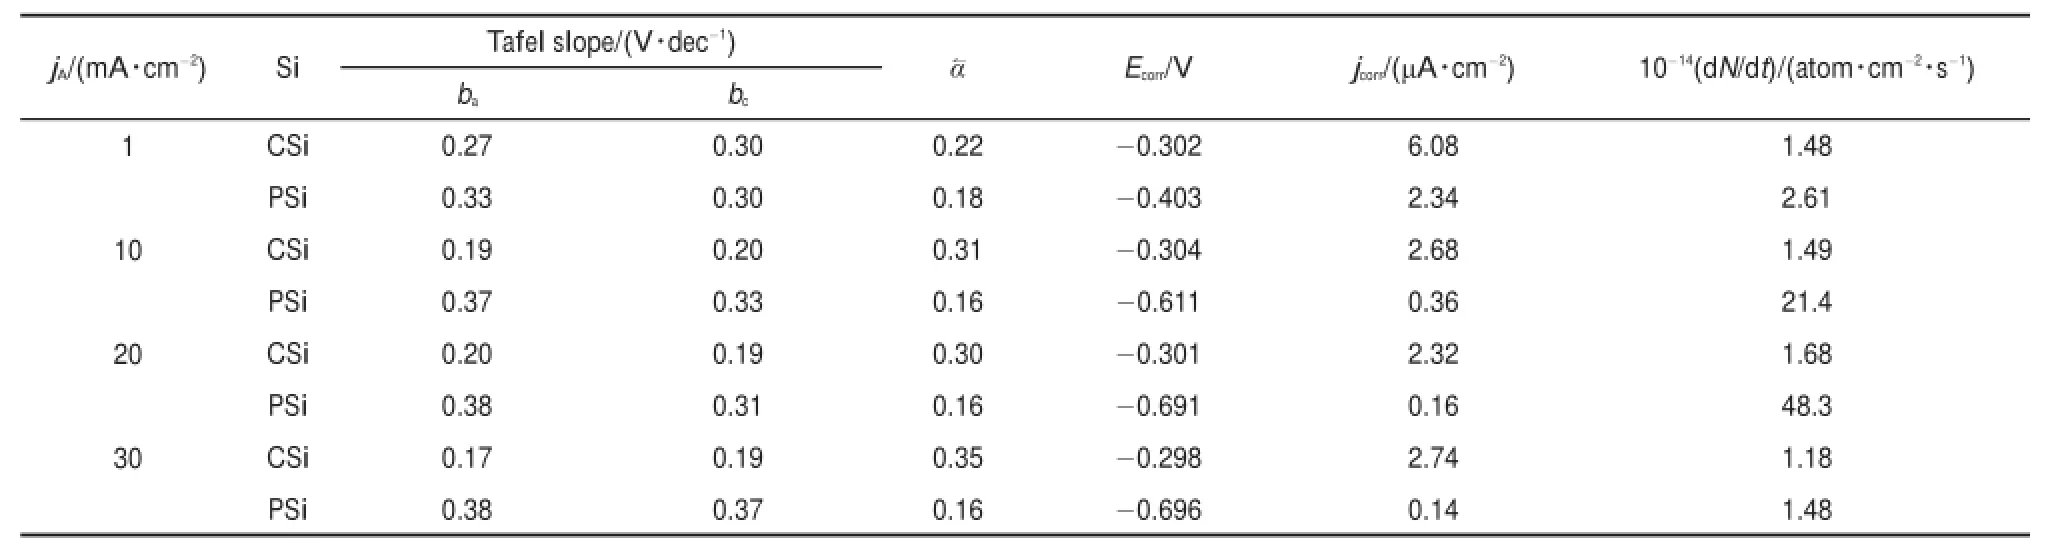
Table1 Fitting parametersof Tafel curvesduring the PSi formation
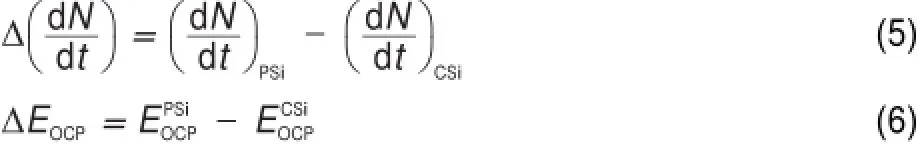
The differences in the kinetic parametersobtained w ith CSiand PSielectrodessuggested theapparentalterationsat theelectrode/ electrolyte interface.The abridgedmodel for n-type CSiand PSi electrode/electrolyte interface is proposed and schematically illustrated in Fig.6.As can be seen in Fig.6(a),fora CSielectrode, when equilibrium between electrodeand electrolyte is reached,the SCL of CSielectrode is in the state of electron depletion w ith few holes left,thus,negative ionsare adsorbed on the interfacewhich results in negative EOCP.While fora PSielectrode,thenano-sized particles observed in Fig.2 result in a higher potential barrier, holesmove to the pore bottom but cannot reach the pore wall according to the quantum confinementmodel14,which would change the charge carriers distribution both in SCL and Helmholtz layeras depicted in Fig.6(b).Comparingwith the CSielectrode, the formation of PSi layer isequivalent to the extended thickness of Helmholtz layer,the interfacial thickness increased with larger jA,in particular,from 3.2μm at5mA∙cm-2to27.4μm at30mA∙cm-2,12which would result inmore electrons adsorbed on the interface and thusmore negative EOCP(Fig.6(c)).The potential drop at the Helmholtz layerwould be increased when the nanostructures formedw ithin the PSi layersby changing jAfrom 1 to 30mA∙cm-2.
In order to quantitatively characterize the difference between the PSiand CSielectrodes,the follow ing parametersare defined:
where N is the numberof Siatoms,t is the time,and EOCPis the open circuit potential.Themagnitude ofΔ(d N/d t)indicates the corrosion rate of Si,whileΔEOCPthe degree of potential shiftafterthe PSi formation.The calculatedΔ(d N/d t)andΔEOCPare plotted against ESin Fig.7.The differences betw een CSi and PSimay reflect indirectly the different structures of electrode and the variations of surface state.Evidently,Δ(d N/d t)increased linearly w ith ES,meaning that the electrochem ical reaction rate ata PSi/ electrolyte interface is faster than thatataCSi/electrolyte interface and closely related to the linearly increased thicknessof PSi layer (Fig.4)because of the larger active surface areas resulted.Furthermore,the amounts of hydrogenous surface species were thought to accelerate the corrosion rate of PSi in solution by inducing lotsof surface state,which can be taken as theelectronic energy level for the exchange of charge carriers.During the PSi formation by jA,all Si―H and Si―O species including Si3SiH, Si2SiH2,Si(O)SiH3,O2SiH2,O3SiH were identified from the FTIR spectra12.The absorption area under the FTIR spectrum(S)can be obtained by integration of the curve.Therefore,the S values represent sem i-quantitatively the amounts of those species.As evident in Fig.7,similar to the corrosion rateΔ(d N/d t),the S also increased linearly w ith ES.On the other hand,theΔEOCPvalues becamemore negative and strongly dependentupon ES,which can be fittedwellwith the Boltzmann function shown below.

The negative shift in EOCPfor n-type CSi is caused by the electrochem ical reaction at CSielectrode in HF solution which depletes holes and leads to accumulation of negative charges,as illustrated in Fig.6(b).The depletion of holes in the pore wall resulted in large amounts of negative charges which w ould be increased with the thicker PSi layer.However for the PSi fabricated at high jA,the accumulation of negative charges at the interface became slow er because of the linear increase of the reaction ratew ith ES.Themost reasonable interpretation is faster consumption of holesundera larger jAwhich lessensaccumulation of thenegative chargeand less influencesΔEOCP.
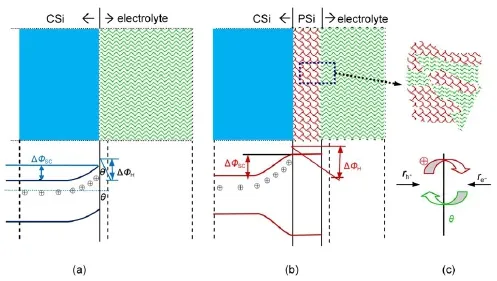
Fig.6Proposedmodel for n-type Sibefore(a)and after(b)the PSi formation at theelectrode/electrolyte inter face w ith a schem atic sketch of reaction ratesat the in ter face(c)tand for the exchange rates for holesand electrons,respectively.
Fig.7 Variations of param etersw ith responding poten tials determ ined from Fig.2(b)
4Conclusions
The PSi layerswith nanosized poreswere formed in a broaden rangebetween 1 and 30mA∙cm-2on heavily doped n(111)-Si.The reaction rate occurred at the Si/electrolyte interface was determ ined by the concentration of holes.The thickness of PSi layer, the difference in reaction rate between CSiand PSi,Δ(d N/d t),as wellas the totalamountsof Si―H and Si―O species increased linearly w ith jA.The variation inΔEOCPfollow ed the Boltzmann equation.Compared to the flatCSielectrode,the formation of PSi layers increased the thicknessof Helmholtz layerand changed the potential distribution,accordingly,the electrochemical reaction at the PSi/electrolyte interface slightly changed.
References
(1)Zhang,X.G.Electrochemistry ofSilicon and ItsOxide; KluwerAcademic/Plenum:New York,2001;pp 5-98.
(2)Lemann,V.Electrochemistry ofSilicon:Instrumentation, Science,Materialsand Applications;Wiley-VCH:New York, 2002;pp 10-103.
(3)Yang,H.B.;Hu,M.;Liang,J.R.;Zhang,X.R.;Liu,Z.G.Acta Phys.-Chim.Sin.2008,24,1017.[杨海波,胡明,梁继然,张绪瑞,刘志刚.物理化学学报,2008,24,1017.]doi: 10.3866/PKU.WHXB20080618
(4)Tian,J.;Zheng,D.;Zhang,X.G.;Zhang,B.H.;Xia,B.J.; Yang,H.Acta Phys.-Chim.Sin.2007,23,68.[田娟,郑丹,张熙贵,张宝宏,夏保佳,杨辉.物理化学学报,2007, 23,68.]doi:10.3866/PKU.WHXB20070114
(5)Parkhutik,V.P.;Glinenko,L.K.;Labunov,V.A.Surf.Technol. 1983,20,265.doi:10.1016/0376-4583(83)90009-2
(6)Sailor,M.J.Fundamentalsof PorousSilicon Preparation.In Porous Silicon in Practice;W iley-VCH Verlag GmbH&Co. KGaA:Weinheim,Germany,2011;pp 1-42.
(7)Bertagna,V.;Plougonven,C.;Rouelle,F.;Chem la,M. J.Electroanal.Chem.1997,422,115.doi:10.1016/S0022-0728(96)04902-9
(8)deMierry,P.;Etcheberry,A.;Rizk,R.;Etchegoin,P.; Aucouturier,M.J.Electrochem.Soc.1994,141,1539.doi: 10.1149/1.2054959
(9)A llongue,P.;Henry de Villeneuve,C.;Pinsard,L.;Bernard,M. C.Appl.Phys.Lett.1995,67,941.doi:10.1063/1.114702
(10)Parkhutik,V.;Andrade Ibarra,E.Mat.Sci.Eng.B 1999,58, 95.doi:10.1016/S0921-5107(98)00297-9
(11)Lu,J.M.;Cheng,X.Adv.Mater.Res.2013,650,34.doi: 10.4028/www.scientific.net/AMR.650
(12)Lu,J.M.;Cheng,X.;Zhang,Y.;Zhu,X.F.Electrochim.Acta 2010,55,5084.doi:10.1016/j.electacta.2010.03.100
(13)Zhang,X.G.;Collins,S.D.;Smith,R.L.J.Electrochem.Soc. 1989,136,1561.doi:10.1149/1.2096961
(14)Lehmann,V.;Gösele,U.Adv.Mater.1992,4,114.doi: 10.1002/adma.19920040212
Electrochemical Behavior of Porous and Flat Silicon Electrode Interfaces
LÜJing-Mei1CHENG Xuan2,3,*
(1College ofChemical Engineering and Materials Science,Beijing Institute ofTechnology,Zhuhai519088,Guangdong Province, P.R.China;2DepartmentofMaterials Science and Engineering,Co llege ofMaterials,Xiamen University,Xiamen 361005, Fujian Province,P.R.China;3Fujian Key Laboratory ofAdvanced Materials,Xiamen 361005,Fujian Province,P.R.China)
The e lectrochem ical responses of heavily doped n-type single-crysta lsilicon(CSi)during the formation ofporous silicon(PSi)layers in hydrofluoric acid-based electrolyteswere investigated.A series of PSi layers were fabricated by constantly app lying differentanodic currentdensities,which w ere selected according to the linear polarization curve.The surface and cross-sectionalmorphologies of the PSilayerswere studied by scanning electronm icroscopy.The electrochem ica lbehaviorofCSiand PSie lectrodeswas compared by linear sweep po larization and chronopotentiometry techniques.The importantparameters associated with the electrochem ical reactions at the electrodeswere evaluated by analyzing the Tafelplots and chronopotentiograms obtained before and after the PSi formation.Structuralmodels of the CSielectrode/electrolyte and PSielectrode/ electrolyte interfaceswere suggested based on the experimentaldata.Accordingly,the interfacialcharacteristics of CSiand PSie lectrodeswere discussed.
Porous silicon;Silicon electrode interface;Corrosion rate;Open circuitpotential; Pola riza tion curve;Inte rface e lectrochem istry
1 Introduction
Poroussilicon(PSi)w ith differentm icrostructures can beobtained from flat signal crystal silicon(CSi)electrode in hydrofluoric acid(HF)contained solutions w ith the electrochem icalreactions taking placeat the interfaceof Sielectrode/electrolyte1-4. For a typical sem iconductor,an interface of electrode and electrolyte includes space charge layer in solid electrode side and Helmholtz layer in solution side.However,the distribution and transfer of charge carriers(electrons and holes)at the interface could become complex and different typesof potential-time curves were obtained during the PSi formation5,6.The kinetics of electrochemical corrosion of CSielectrode in dilute HFsolutionshave been previously studied by exam ining open circuit potential, polarization resistance,corrosion current density,and reaction rate7.However,tillnow,mostworks focused on the interface of flat Si electrode/electrolyte.Few have been reported at the PSi electrode/electrolyte interfacewhich should be important for the application and the formation mechanism of the PSi.It was pointed out that PSielectrode possesses larger surfacearea leading tomoreadsorbed specieswhich would change the distribution of carriers such as silicon-hydrogen species8-10.Meanwhile,the formation of nanopore structure would change the charge distribution in space charge layerof Sielectrode.
October9,2015;Revised:December22,2015;Published onWeb:December24,2015.
O646
10.3866/PKU.WHXB201512242
*Corresponding author.Email:xcheng@xmu.edu.cn;Tel:+86-592-2185599;Fax:+86-592-2183937.
The projectwas supported by the National Natural Science Foundation of China(11372263).
国家自然科学基金(11372263)资助项目©Editorialofficeof Acta Physico-Chim ica Sinica
