A Comprehensive Review on RNA-seq Data Analysis
2016-09-05ZhangLiLiuXuejun
Zhang Li, Liu Xuejun
College of Computer Science and Technology, Nanjing University of Aeronautics and Astronautics,Nanjing 211106, P.R. China
(Received 7 July 2015; revised 15 October 2015; accepted 21 October 2015)
A Comprehensive Review on RNA-seq Data Analysis
Zhang Li, Liu Xuejun*
College of Computer Science and Technology, Nanjing University of Aeronautics and Astronautics,Nanjing 211106, P.R. China
(Received 7 July 2015; revised 15 October 2015; accepted 21 October 2015)
RNA-sequencing (RNA-seq), based on next-generation sequencing technologies, has rapidly become a standard and popular technology for transcriptome analysis. However, serious challenges still exist in analyzing and interpreting the RNA-seq data. With the development of high-throughput sequencing technology, the sequencing depth of RNA-seq data increases explosively. The intricate biological process of transcriptome is more complicated and diversified beyond our imagination. Moreover, most of the remaining organisms still have no available reference genome or have only incomplete genome annotations. Therefore, a large number of bioinformatics methods for various transcriptomics studies are proposed to effectively settle these challenges. This review comprehensively summarizes the various studies in RNA-seq data analysis and their corresponding analysis methods, including genome annotation, quality control and pre-processing of reads, read alignment,transcriptome assembly, gene and isoform expression quantification, differential expression analysis, data visualization and other analyses.
transcriptome analysis; high-throughput sequencing; RNA-seq data analysis; analysis pipeline
0 Introduction
In the past two decades, microarray technology had dominated the transcriptome analysis and led to a number of monumental accomplishments. However, the limitations of microarray showed a need for new and improved technologies for sequencing variousorganism genomes. In recent years, the next-generation sequencing technology has become as an attractive alternative to microarray[1-3]. The next-generation sequencing technology is now being exploited not only to analyze static genome, but also dynamic transcriptome in an approach termed as RNA-seq. In general, a population of RNA is converted to a library of cDNA fragments with adaptors attached to one or both ends. Each molecule with amplification is then sequenced in a high-throughput manner to obtain short sequences from one end (single-end sequencing)or both ends (paired-end sequencing). Several sequencing platforms, including Roche/454, Illumina/Solexa, ABI/SOLiD and Ion Torrent, are commercially available, and Illumina/Solexa platform is the most widely used. Compared to microarray, RNA-seq does not depend on the existing gene information and can obtain almost all expressed transcripts for an RNA-seq experiment, while microarrays need the prior gene information to design the probes and consequently microarrays cannot detect novel alternative splicing variants, novel genes and transcripts. In addition, RNA-seq has low background noise, a broader dynamic range of expression level, increased specificity and sensitivity[4-6].
Currently, RNA-seq has rapidly become a standard and widely-used technology for transcriptome analysis, such as calculating gene and isoform expression level[7], detecting differential expression[8-9], detecting gene fusions[10], detecting differential splicing[11-12], finding novel transcripts[13]and revealing small noncoding RNAs[14], etc. Due to the tremendous benefits from RNA-seq technology, these studies have made a great progress and obtained unprecedented achievements[15]. However, some challenges still exist in RNA-seq data analysis. In detail, many biases in RNA-seq data, arising from the library preparation step in the RNA-seq experiments, can affect the downstream analyses, e.g. gene and isoform expression quantification[16]. Most remaining organisms still have no available reference genome or have only incomplete genome annotations. This leads to inaccurate estimation and reconstruction of expressed transcripts[13, 17]. Moreover, with the development of the high-throughput technology, the sequencing depth of RNA-seq data explosively increases. For example, the newest Illumina platform can produce 2.5—5 billion reads in per run. Therefore, the rapidly increased sequencing depth requires more powerful computing platform and higher computational efficiency of the algorithms[18]. A large number of methods and tools have been proposed to overcome these challenges for various transcriptomics studies[19-21].
Once the millions of reads are obtained from an RNA-seq experiment, the RNA-seq data analysis is subsequently conducted for biological discovery. The comprehensive analysis procedure of RNA-seq data is shown in Fig.1. Before aligning reads, quality control and pre-processing of reads are necessary to clean the raw reads, such as low-complexity sequences and untrimmed adapters, etc. Then the cleaned reads are aligned to reference genome sequences, which are crucial for accurate downstream RNA-seq studies. According to the availability of reference genome sequences, the procedures of RNA-seq data analysis are usually divided into two strategies. For those organisms, such as human, rat, mouse, etc., which have high-quality reference genomes and refined genome annotations, reads can be aligned to the reference and various RNA-seq studies can be performed without genome-guided transcriptome assembly. If the annotations are incomplete or the experiment goal is to find novel transcripts, the genome-guided transcriptome assembly is required before conducting other studies. However, most of the remaining organisms do not have reference genome sequences. Even if the genomes of some organisms have been sequenced, the reference genomes are still not available because long gaps or ambiguous bases lose a lot of genome information. Therefore, de novo transcriptome assembly needs to be carried out before various downstream studies can be conducted based on different research goals. Among these studies, data visualization can help to show results in a genomic context. Finally, the analysis results need to be interpreted in term of biological significance.
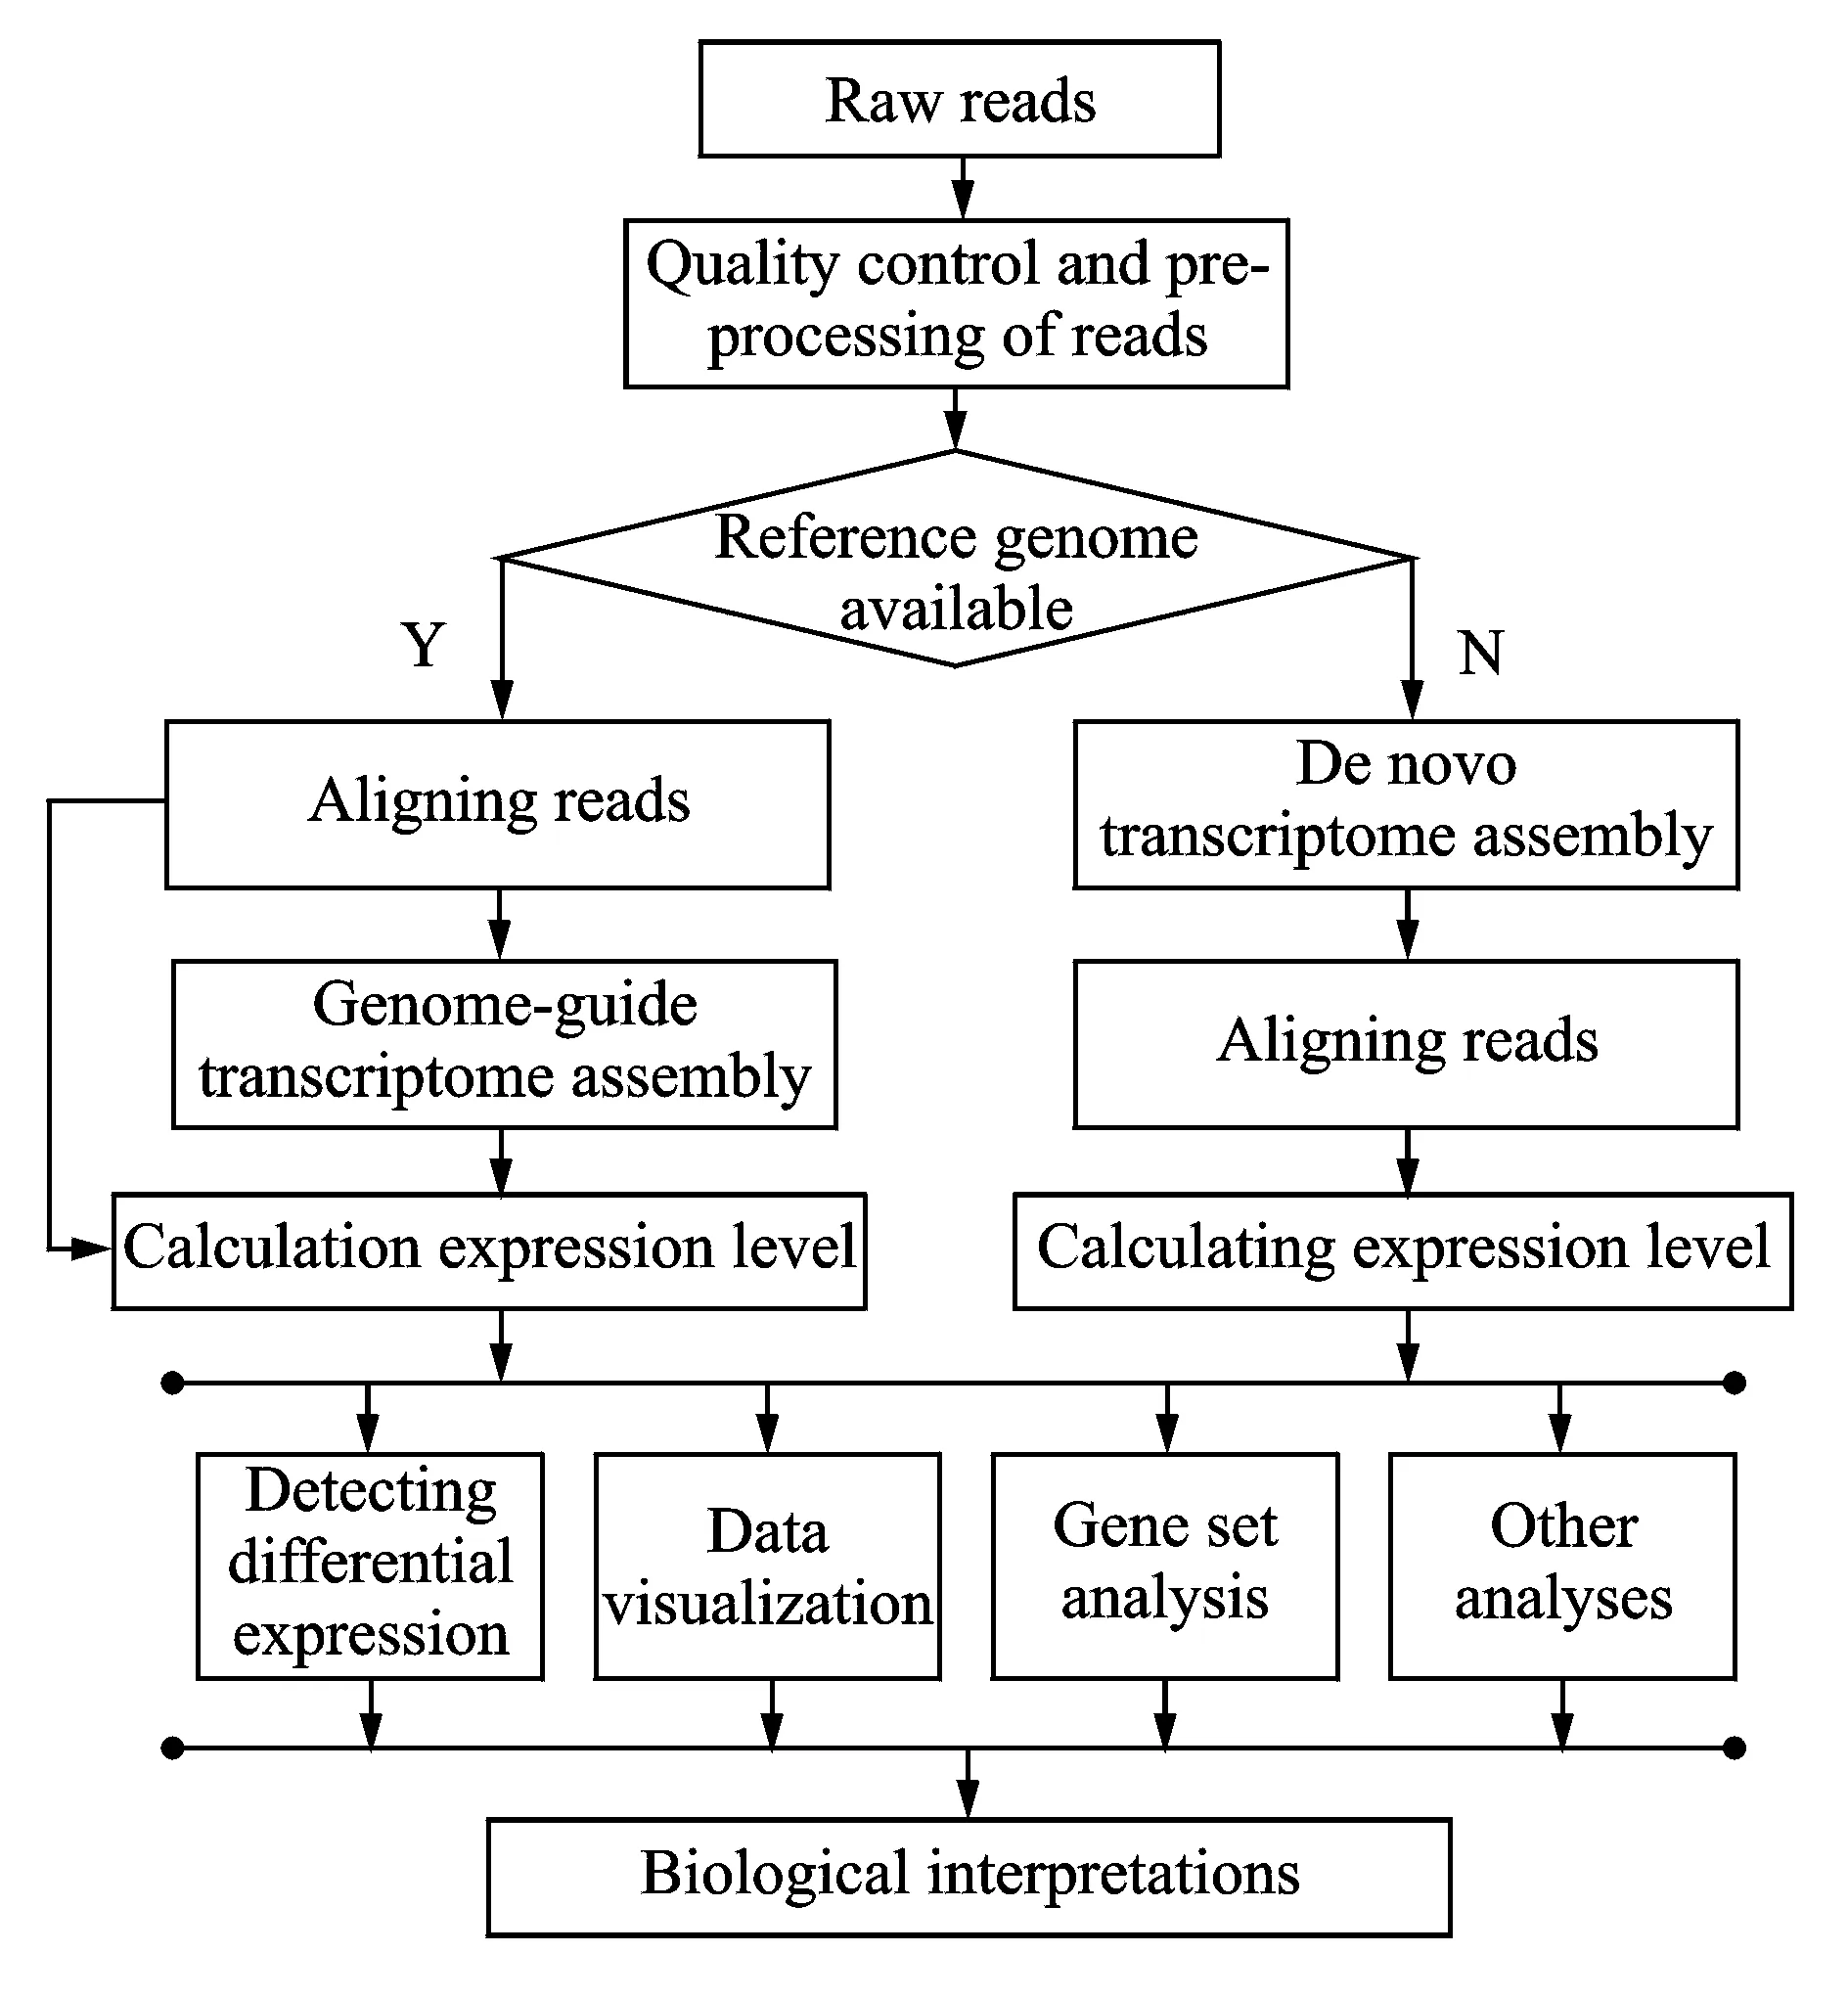
Fig.1 Comprehensive analysis procedure of RNA-seq data
In this review, we firstly introduce the genome annotation, which directly affects the downstream analyses. Then we present a comprehensive review of current methods that are used to conduct various transcriptomics studies using RNA-seq data, including quality control and pre-processing of reads, read alignment, gene and isoform expression quantification, differential expression analysis, transcriptome assembly, visualization tools and other analyses. The comparison results for some typical analysis steps based on our analysis are also provided for guiding the selection of tools.
1 RNA-seq Data Analysis
1.1Genome annotation
Genome annotation refers to the process of identifying and locating genes and other genomic elements, such as transcripts, exons and intronic structures, etc. Moreover, it attaches some functional notions in the form of controlled vocabularies, such as gene ontology (GO), or the metabolic pathways. The genome annotation is widely applied to various RNA-seq studies. In the phase of the read alignment, the annotation is used to assign the reads to the annotated genes or transcripts. After calculating expression level or detecting differential expression, the annotations can provide the functional information to explain the biological meaning from the analysis results. Therefore, genome annotation is a crucial component of RNA-seq data analysis.
Up until now, many public genome annotations from various databases and projects are created as shown in Table 1. Because of variations, characteristics of these annotations differ in annotation strategies and information sources. RefSeq database built by the National Center for Biotechnology Information (NCBI), provides only a single record for each natural biological molecule for major organisms ranging from viruses to eukaryotes[22]. The UCSC Known Gene database constructed by the University of California Santa Cruz (UCSC) serves as a foundation for the UCSC Genome Browser. This database is based on protein data from Swiss-Prot/TrEMBL(UniProt) and the associated mRNA data from GeneBank[23]. Vertebrate and Genome Annotation(Vega) database manually curates transcripts produced by the HAVANA group at the Welcome Trust Sanger Institute (WTSI) and has been merged into Ensembl[24]. Ensembl database led by EMBL-EBL and WTSI, contains both automated genome annotation and manual curation[25], while the gene set of GENCODE corresponds to Ensembl annotation[26]. H-Invitational database (H-InvDB ) based on the Genome Information Integration Project, assigns a standardized functional annotation by manual curation[27]. The Consensus Coding Sequence (CCDS) project is a collaborative effort to maintain a dataset, which includes the consistently annotated protein-coding regions and high-quality human and mouse reference genome assembliers[28]. AceView led by NCBI provides a curated, comprehensive and non-redundant sequence representation of all public mRNA sequences[29].
Among all the above genome annotations, RefSeq, UCSC and Ensembl, are well supported for many organisms and broadly used because of regular and automatic update. The choice of genome annotations has a dramatic effect on the RNA-seq data analysis[30]. The complexity of genome annotations is defined by the numbers of genes, transcripts and exons. When conducting a study that emphasizes the estimation of the reproducible and accurate expression levels, a less complex genome annotation may be preferred, such as RefSeq and UCSC Known Gene. However, simpler genome annotations may limit the opportunities for identifying or characterizing novel transcriptional or regulatory mechanisms. When carrying out research that aims to be more exploratory, a more complex genome annotation may be suggested, such as Ensembl[31]. More complex genome annotation obtains more alignments, which can help to identify more novel discoveries.
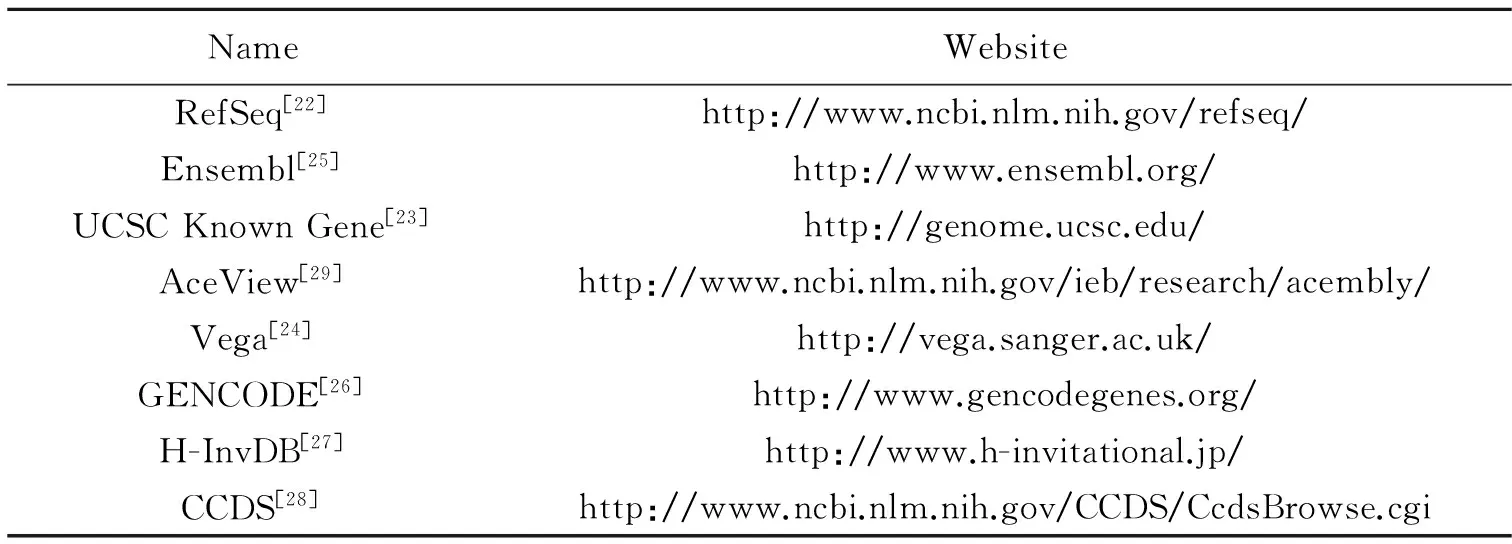
Table 1 List of various public genome annotations
1.2Quality control and pre-processing of reads
Quality problems typically arise from sequencing itself or library preparation. They include low-confidence bases, low-complexity sequences, sequence-specific bias, positional bias, untrimmed adapters, polymerase chain reaction (PCR) artifacts, sequence contamination, etc. These problems can seriously affect the downstream analysis[32]. Quality control (QC) and pre-processing is usually the first step in the RNA-seq data analysis. Many tools are available as shown in Table 2, and can be divided into two categories i.e.,″Raw″ and ″Aligned″. The ″Raw″ methods directly deal with the raw RNA-seq data and have similar features. The quality control step includes the investigation of read length, GC content, quality score, sequence complexity distributions, sequence duplication, sequence contamination, artifacts and the number of ambiguous bases. In the pre-processing step, the sequence ends should be trimmed and unwanted sequences should be filtered. FastQC[33]and PRINSEQ[34]inspect several metrics and provide reports with information visualizations. PRINSEQ also offers filtering and trimming functionality. HTQC uses different strategies to remove low quality reads[35]. Trimmomatic can remove adapters and trim reads in different ways based on quality[36]. These methods, except for FastQC and FASTX[37], allow fast parallel processing of large amount of raw reads[38-39]. Once raw reads have been aligned to the reference genome, the aligned data open up the new quality problems. Quality scores that can be measured only with aligned reads include saturation of sequencing depth, read distribution between different genomic feature types and coverage uniformity along transcripts. The ″Aligned″ methods for aligned data report many overlapping quality measures, and also have their individual features. RNA-SeQC provides a particularly detailed coverage metric report and can also compare different samples[40]. Qualimap offers elegant plots for saturation and biotype distribution[41]and RseQC calculates saturation status for splice junctions in addition to genes[42].
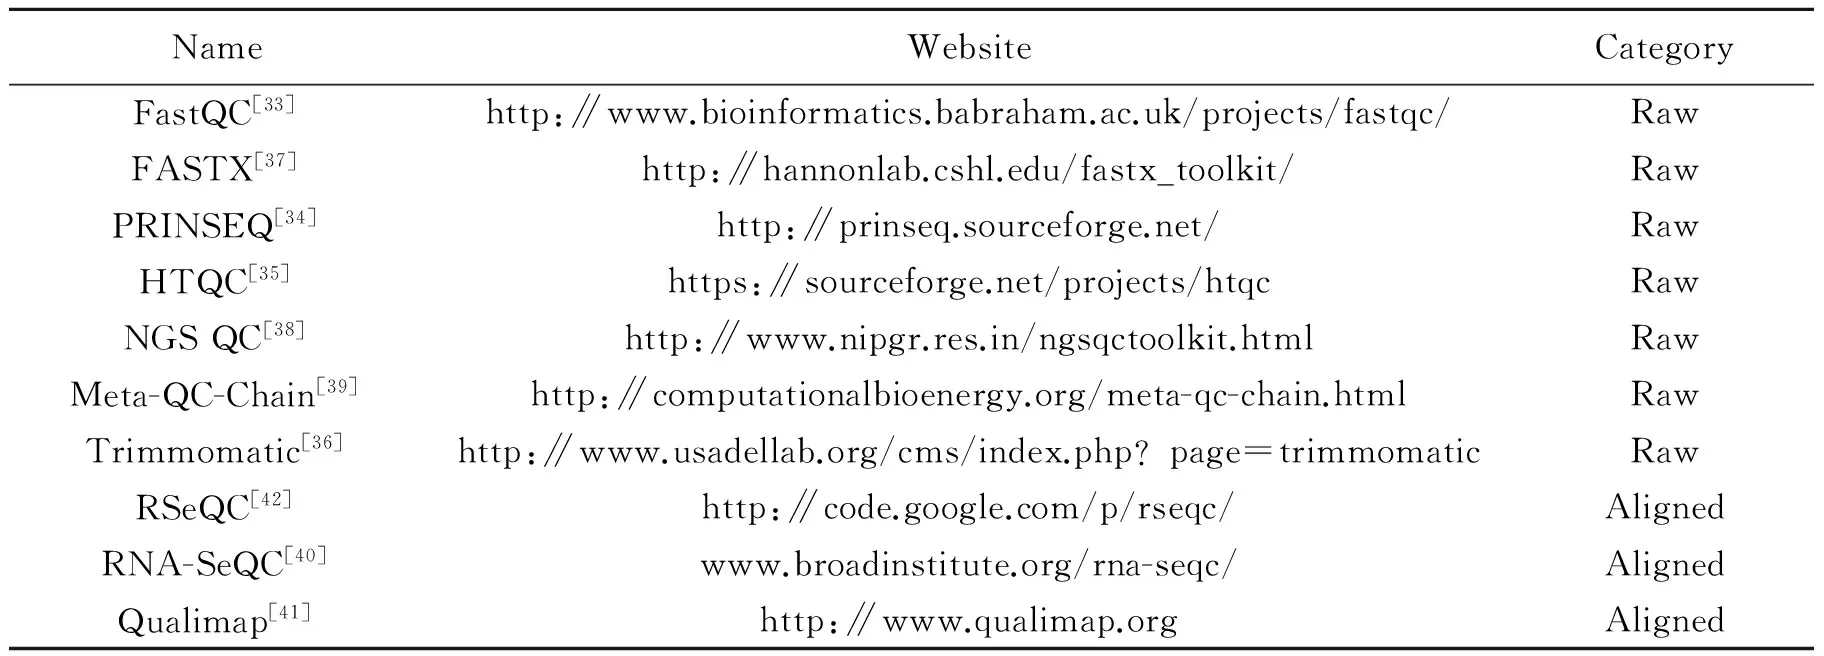
Table 2 List of sequencing quality control and pre-processing tools
″Raw″ presents the tools handling the raw RNA-seq reads and ″Aligned″ presents the tools handling the aligned reads.
Generally speaking, adapters and sequence contamination need to be removed and base quality issues can be more subtle. In addition, quality requirements depend on the subsequent research goals. For example, aligners have differential abilities to cope with erroneous bases. Trimming low-quality bases can improve de novo transcriptome assembly. Thus, users need to choose the appropriate quality control tools to process the raw or aligned reads according to research goals.
1.3Read Alignment
The read alignment is the basic and crucial step for aligning-first analysis methods. Aligned reads provide the genomic location information and allow to estimate where reads originate from. Two factors, the complexity of reference genome and the read length, directly influence the accuracy of read alignment. For mammalian, due to repetitive and homologous sequences, short reads are aligned to many genomic locations resulting in the multi-mapping problem. Moreover, reads from the splice junctions need to be split into several segments across the introns and then aligned to the reference genome sequences. But locating the exon-intron boundaries takes much computational time because exons and introns have different length. Furthermore, too short reads aggravate the multi-mapping problem. However, too long reads, which contain more sequencing errors, decrease read alignment accuracy and computational efficiency. Therefore, aligning short reads rapidly and accurately is pivotal for RNA-seq data to accomplish various downstream analyses.
Many read aligners are proposed and can be divided into unspliced and spliced aligners[21]. Fig.2 shows mapping reads to different reference sequences using unspliced and spliced aligners. We found that unspliced aligners using reference genome sequences discard some reads which contain gaps of splice junctions. Therefore, unspliced aligners can avoid the spliced reads and are thus suitable for aligning reads to reference transcript sequences. Basically, unspliced aligners have two categories as shown in Table 3, namely, Hash-based aligners and Burrows-Wheeler-Transform (BWT) -based aligners[43]. Hash-based methods use hash tables to build upon quick seeding of alignment candidates and can be further divided into two classes based on the types of indexing, the read indexing and the reference indexing. The read indexing splits and stores the sequencing reads in the hash table and the memory usage depends on the size of reads and the read length, such as SeqMap[44]and MAQ[45]. The reference indexing handles the reference sequences and the memory relies on the size of reference sequences and the seed length, such as MOSAIK[46], GNUMAP[47], SHRiMP[48], RazerS3[49]and Stampy[50]. BWT-based methods align the entire reads instead of the seeds of reads against the substrings sampled from the reference genome. To enable rapid read searching and reduce memory usage, BWT-based methods use BWT, which is a reversible data compression algorithm, to reorder the reference genome sequences for data structure compression, and then retrieve the whole BWT-based suffix array for reads aligning. Thus, these methods can significantly reduce the memory usage and improve the alignment speed, such as Bowtie2[51], BWA[52]and SOAP2[53]. Both strategies can be applied to aligned reads, but they have significant difference in performance. In practice, BWT-based methods are obviously faster than Hash-based methods and can reduce memory usage. However, the Hash-based methods are more sensitive and can generate more accurate aligned reads[54]. Table 4 shows the comparison results of SeqMap and Bowtie2 demonstrating the different performance of approaches from the two categories.
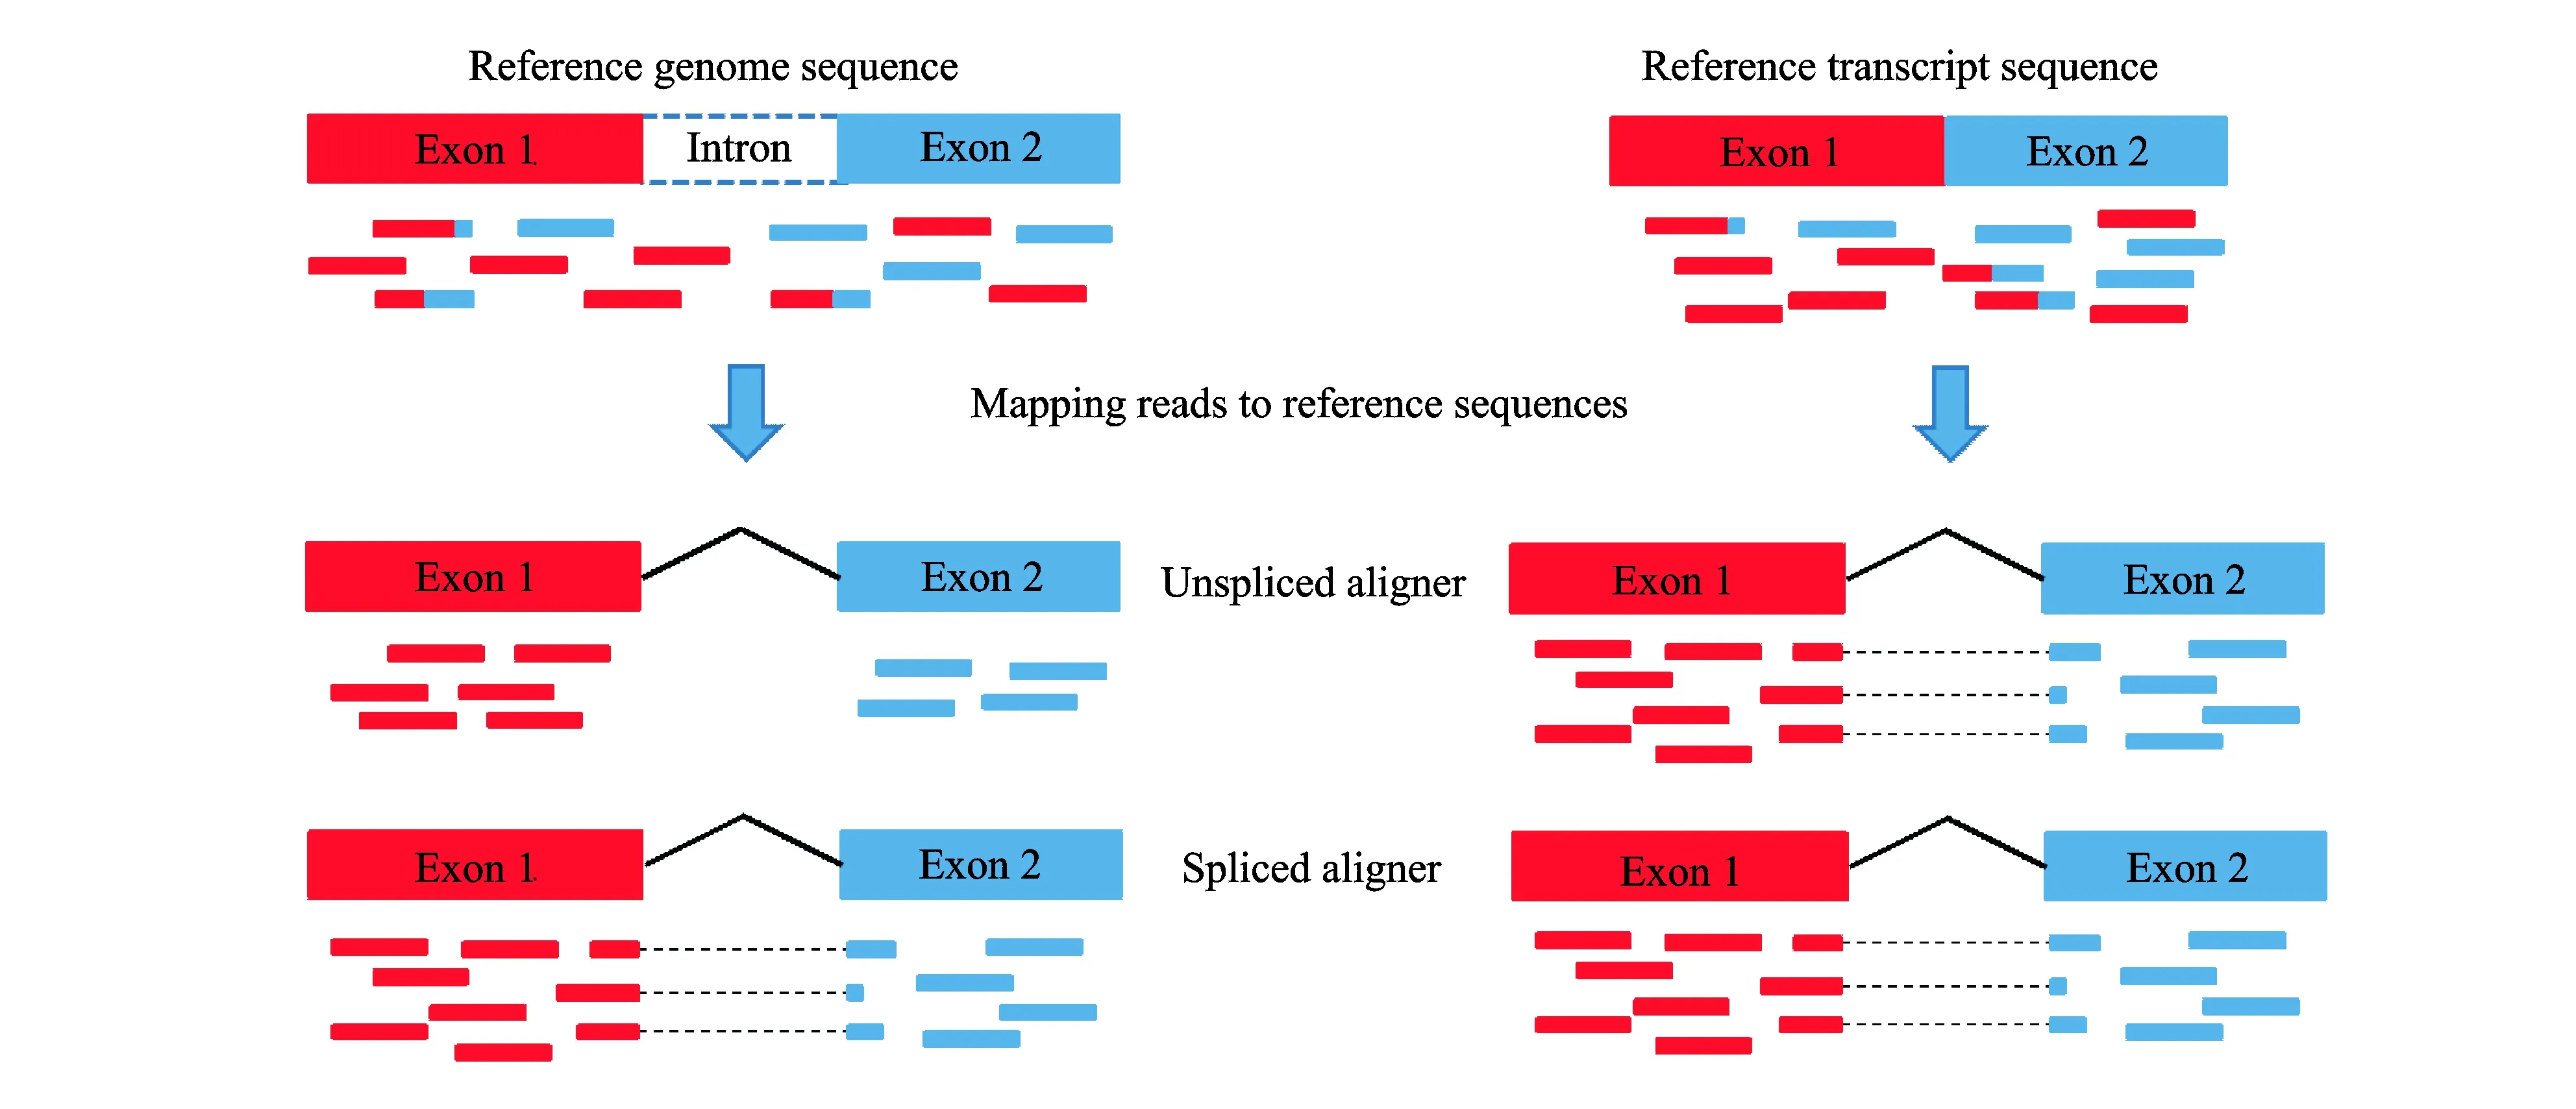
Fig.2 Illustration of mapping reads to different reference sequences using unspliced and spliced aligners
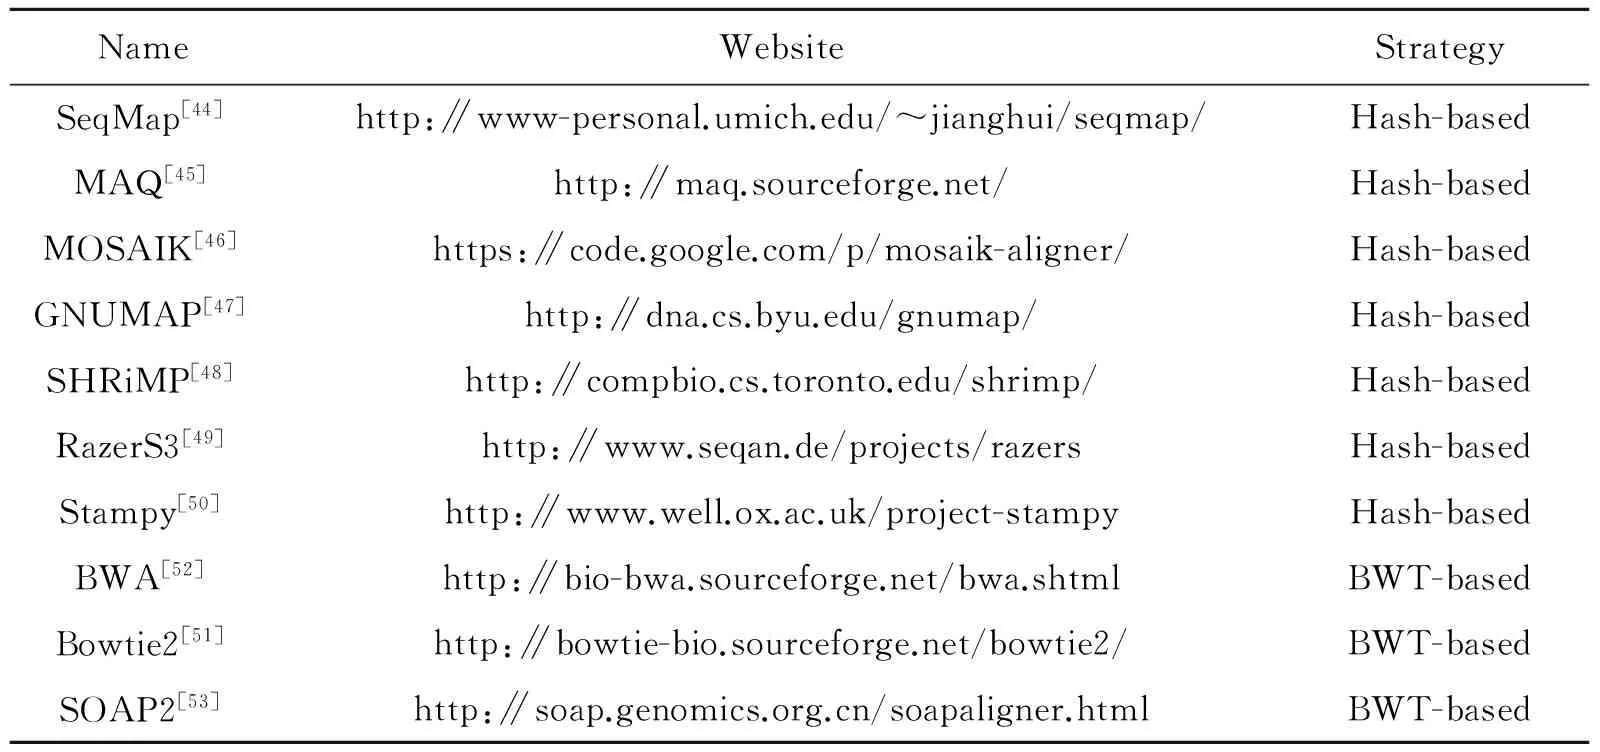
Table 3 List of unspliced aligners
″Hash-based″ represents the corresponding methods based on hash table algorithm and ″BWT-based″ represents
the corresponding methods based on BWT algorithm.
Many reads span exon-exon junctions and cannot be directly aligned by unspliced aligners. However, these reads contain the most discriminable information for further inferring of isoform expression and novel transcripts. Currently, spliced aligners are proposed as shown in Table 5. These methods usually employ unspliced aligners to align firstly unspliced reads and then use various strategies to align the rest reads containing spliced regions. According to whether to use genome annotations, the existing methods are classified into two categories, ″Annotated″ and ″De novo″[20]. The ″Annotated″ spliced aligners detect the splice junctions based on known junctions from genome annotations, such as RUM[55], OSA[56]and JAGuaR[57], but cannot identify new splice junctions. The ″De novo″ spliced aligners allow the detection of new junctions without known genome annotations, such as
GSNAP[58], OLEgo[59], SpliceMap[60]and SOAPSplice[61]. This type of aligners predicts the exon-intron boundaries using the ″GT-AG″ ″GC-AG″ and ″AT-AC″ patterns within introns. Some ″De novo″ spliced aligners also provide the option of using known genome annotations, such as Tophat[62-63], STAR[64]and GEM[65], and can be deemed as a particular category, ″Both″. In practice, because of optionality, the ″Both″ spliced aligners are most widely used for detecting exon-exon junctions[66]. In general, the ″Annotated″ splice aligners are more accurate, faster and use less memory. But ″De novo″ spliced aligners is the unique choice for organisms without reference genomes. In Table 4, the results of Tophat show that the ″De novo″ algorithm needs more time and memory to predict the exon-intron boundaries and the ″Annotated″ one obtains more accurate results.

Table 4 Accuracy, speed and memory of various aligners
The data is from SRX016359 dataset[67], which contains 11 712 885 single-end reads. Bowtie2 and SeqMap use reference transcriptome sequences, and Tophat uses reference genome sequences with two options, ″Annotated″ and ″De novo″. The execution time is measured using CPU time on the same platform (4 Intel Xeon 3.2 GHz CPUs and 16 GB RAM).
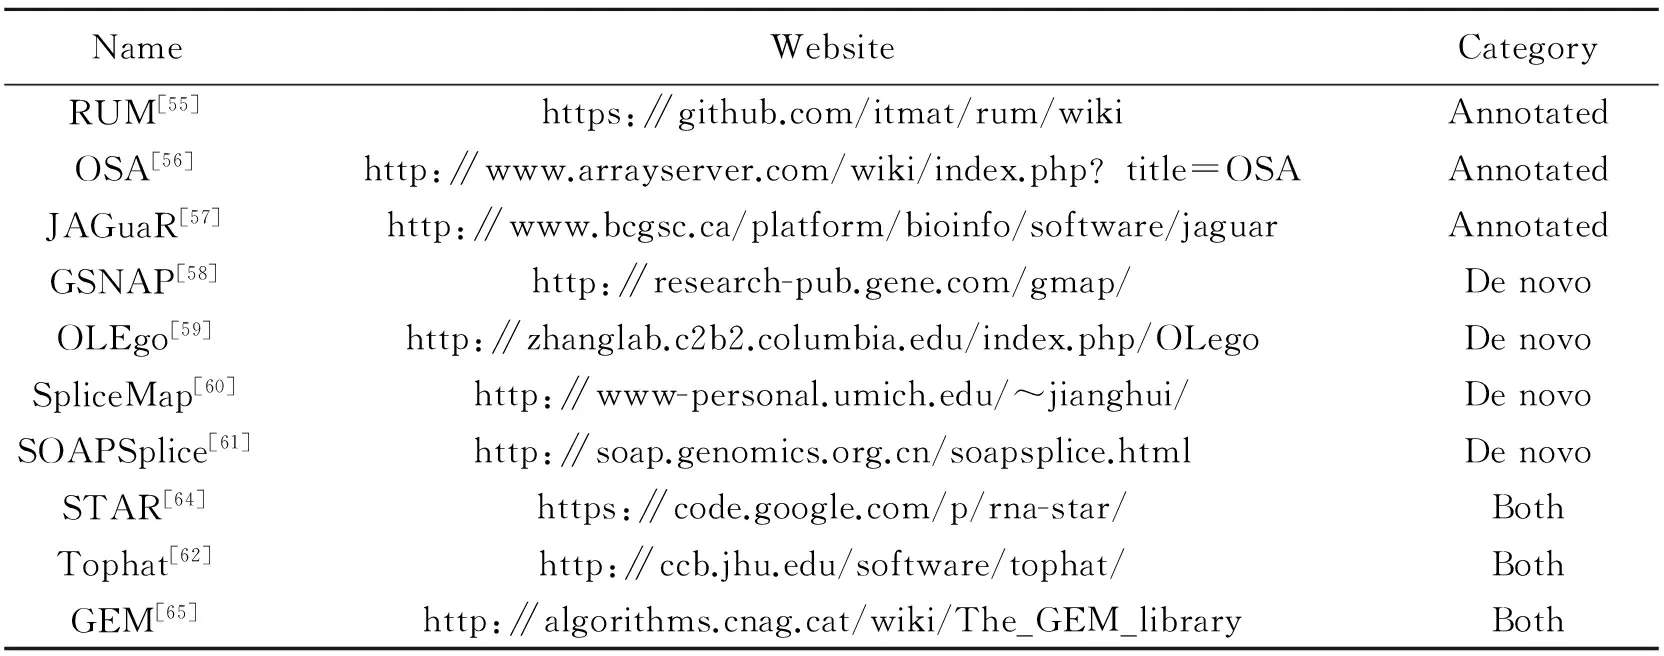
Table 5 List of spliced aligners
″Annotated″ represents the corresponding aligners using the known genome annotation and ″De novo″ represents the de novo spliced aligner. ″Both″ represents some de novo spliced aligners which also provide the option of using known genome annotation.
When aligning reads, the selection of aligners depends mainly on the type of reference sequences and research goals. For well-annotated organisms, such as human, rat and mouse, etc., the unspliced aligners can be chosen to align the reads to reference transcriptome sequences for estimating the expression of known gene or isoform. When the genome annotations are incomplete or the study is to detect novel transcripts, it is necessary to use the splice aligners to align the reads to reference genome sequences. As an example, Table 4 shows the different accuracy, computational efficiency and memory usage of typical aligners. This can help users to select a suitable aligner. However, if the reference genome sequences are not available, the RNA-seq data analysis needs to reconstruct the transcriptome before aligning reads.
1.4Transcriptome assembly
RNA-seq is a practical choice to obtain the whole transcriptome of various organisms. Many methods are proposed to reconstruct the full-length transcripts from the RNA-seq reads, as shown in Table 6. These methods adopt two different strategies for reconstructing transcriptome, ″Genome-guided″ and ″Genome-independent″[68]. In Fig.3, a simple example is used to show the principles of the two strategies of transcriptome assembly methods. The ″Genome-guided″ methods use reference genome sequences to align the reads and assemble the aligned reads into transcripts. They naturally describe a gene as a directed graph and the possible isoforms can be represented by the paths of the graph. In the graph, the node represents an exon or a sequence segment, and the connection represents an exon-exon splicing junction[69]. Characteristics of the″Genome-guided″ methods differ in the candidate transcript construction and algorithm optimization. For example, IsoLasso and iReckon enumerate all possible transcripts, while IsoLasso adopts L1-norm and iReckon proposes a particular sparse constraint to select the candidate transcripts[70]. The ″Genome-guided″ methods depend on a relatively complete and high-quality reference genome that are available for the organisms of interest, such as human, rat and mouse, etc. In the other group of ″Genome-independent″ methods, the reads are broken into k-mer seeds and arranged into a de Bruijin graph structure. Then the graph is parsed to identify transcript sequences, which are aligned to the genome to create gene annotations. At last, various algorithms are applied to extract the possible isoforms, which are needed to explain all reads[13].
In practice, whether a ″Genome-guided″ or ″Genome-independent″ method is selected mainly replies on completeness of the reference genome for the investigated organisms. If an or ganism has a relatively complete and high-quality reference genome, the ″Genome-guided″ method is a sensible choice for expression quantification and differential expression analysis. However, when organisms have no available reference genome, the ″Genome-independent″ method is the best choice to reconstruct the transcripts.

Fig.3 Transcriptome assembly methods[21] (Reads originating from two different isoforms of the same gene are colored black and gray. The left column of the figure is the workflow of ″Genome-guided″ method. The right column is ″Genome-independent″ method.)
Moreover, the read lengths from RNA-seq experiments are usually from 50 bp to 500 bp (base pair).These short reads are major challenges for transcriptome assemblers, especially for the ″Genome-independent″ methods. More long reads can obtain more accuracy for the transcriptome assembly, but they simultaneously bring the lower read quality. When the technology is getting mature to allow sequencing a full-length transcript in one read, many challenges of transcriptome as-semblers will be disappeared.
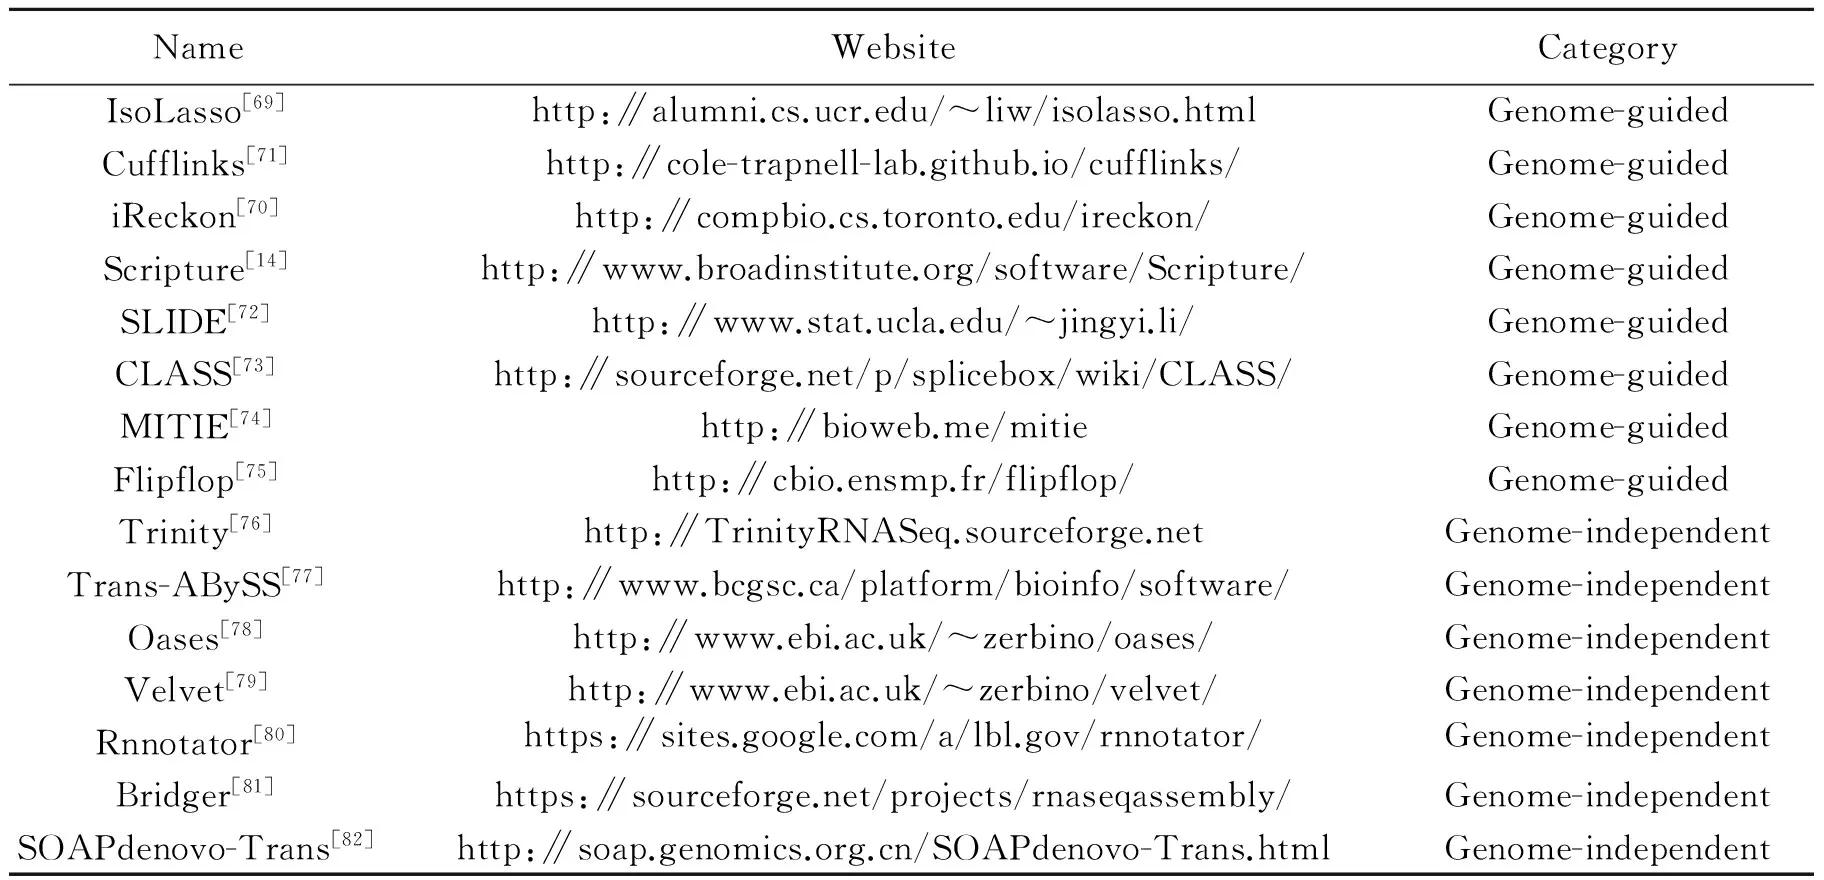
Table 6 List of transcriptome assemblers
1.5Gene and isoform expression quantification
RNA-seq technology directly sequences the reads from the transcriptome and the gene and isoform expression levels can be estimated from the sequenced reads. Although RNA-seq has many advantages in expression measurement compared to microarray, this task still poses challenges. Firstly, the alternatively spliced genes have more than one isoforms which usually overlap, and a short read may be mapped to the overlap region. It is universally recognized that the number of isoforms related to a gene decides on the difficulty of predicting isoform expression. Secondly, the technological limitation of RNA-seq inlibrary preparation causes non-uniformly distributed cDNA fragments within the transcripts of interest. Various biases, including the 5′and 3′ end biases, local nucleotide composition effect, such as priming or GCbias, or other technical biases[16], lead to the non-uniform distribution of the reads along expressed transcripts.
Up until now, many approaches are available for expression estimation, as shown in Table 7. These methods can be simply divided into two categories: the Poisson-based methods and the generative statistic methods[7]. The Poisson-based methods commonly use the Poisson distribution to model the distribution of reads, and the generative statistic methods simulate the stochastic process of read sequencing. Various bias correction strategies are proposed to compensate the effect of diverse biases as mentioned above. For example, NURD adopts a global bias curve for all genes and a local bias curve which are estimated using non-parametric models to correct the non-uniformity of read distribution[83]. Poisson mixed effects (POME) considers the base-specific variation and between-base dependence,which affect read coverage profile throughout the transcript[84]. Sequgio uses a random variable to represent the transcript-specific non-uniformity effect, and then performs the joint estimation of isoform expression and isoform-specific read distribution[85]. Our work, PGSeq, uses a Poisson-Gamma model to account for the exon-specific bias for each gene[86]. Our approach applies Poisson distribution to model the read counts and uses Gamma distributed latent variables to capture the overall exon-specific read bias for each gene[86]. Except for PGSeq, the other Poisson-based methods only concern limited types of biases. However, the generative statistic methods usually consider more complex biases. Cufflinks uses a variable length Markov model to learn the sequence-specific bias on the surrounding sequences and calculates the positional bias accordingthe relative position of fragments in the transcript sequences[87]. BitSeq uses the same bias correction strategy as Cufflinks[88]. Both methods use the bias weight to select a fragment of a specific lengthgiven a transcript. RSEM uses empirical read start position distribution to represent the non-uniformread distribution, which depends on the fraction along the length of transcript in a givenstart position[89]. Fig. 4 shows that the accuracy and computational efficiency from six popular methods. Generally speaking, the generative statistic methods usually obtain more accurate results while the Poisson-based methods present higher computational efficiency. But the Poisson-based method, PGSeq, can simultaneously obtain the most precise results and higher computational efficiency.
The accuracy of gene and isoform expression quantification is also affected by read alignment. Reference genome sequences usually have many repetitive and homologous sequences, which causes mapping ambiguities for a portion of reads[19]. Furthermore, it is difficult to correctly align the reads spanning the splice junctions to the reference genome sequences. Thus, in order to obtain accurate gene and isoform expression level, it is recommended to directly align the reads to reference transcriptome sequences[88, 90]. This is suitable for investigating the known transcripts and genes. However, if the research goals are to detect the novel genes and transcripts, it is inevitable to align reads to the reference genome sequences. In addition, some ″Genome-guided″ transcript assemblers, such as IsoLasso and Scripture, can identify and quantify isoforms simultaneously. But these methods focus on identifying novel isoforms and do not consider the sequencing biases. Alternatively, if the reference genome is not available, the ″Genome-independent″ transcript assemblers (Fig.1) should first be used to reconstruct the transcriptome information before expression quantification.
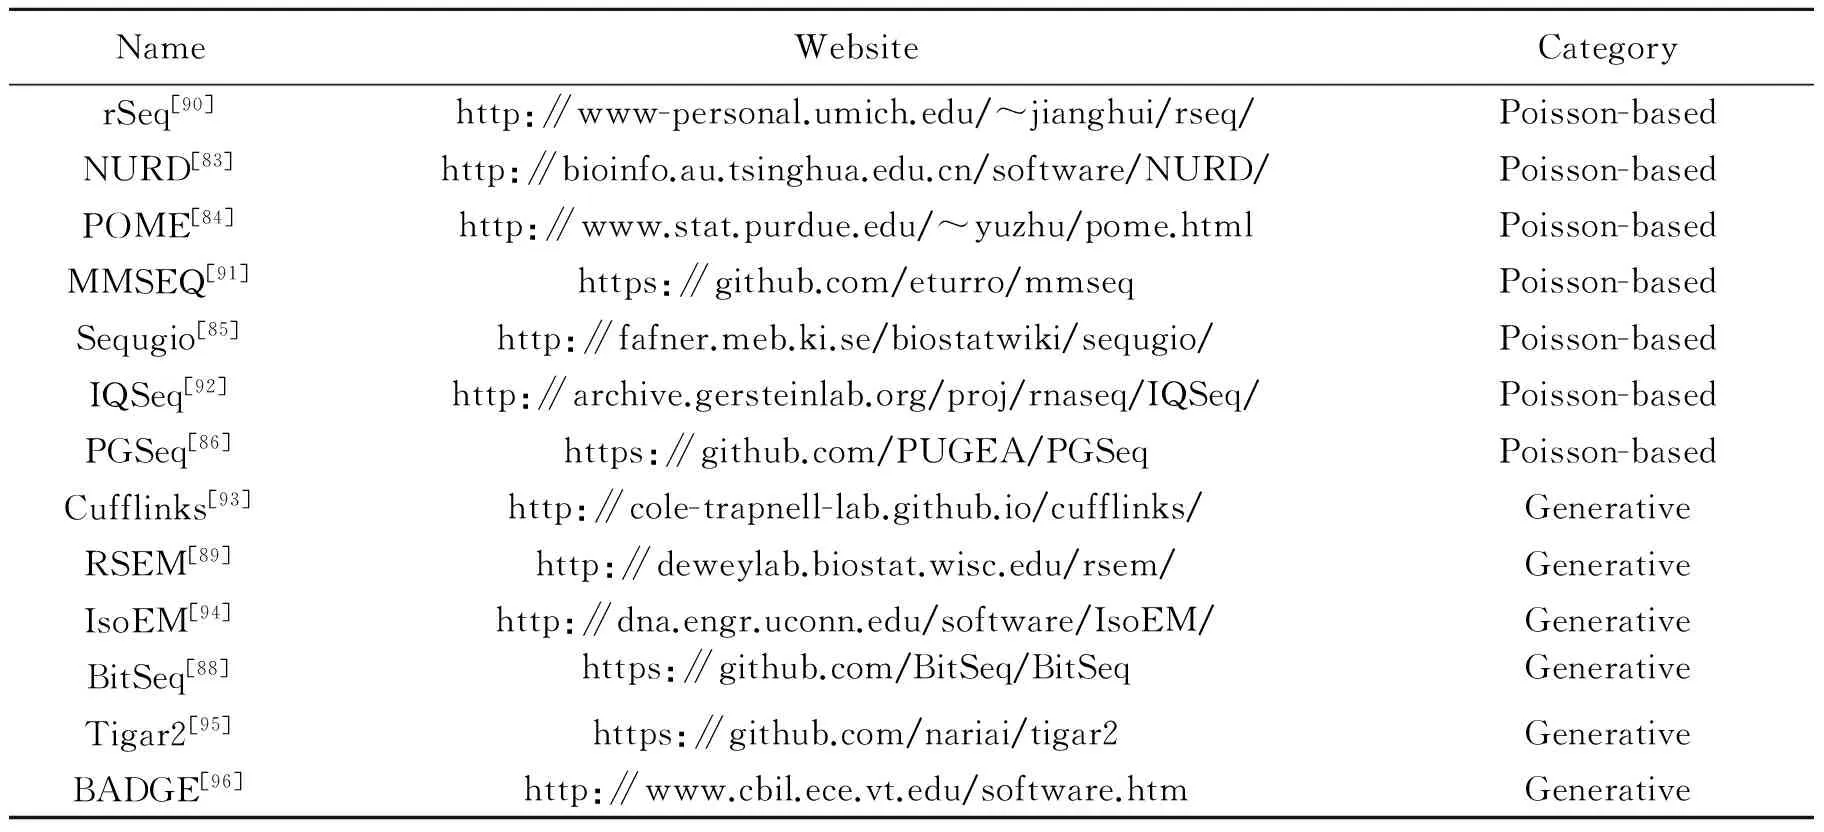
Table 7 List of methods for gene and isoform expression quantification

Fig.4 Accuracy and computational efficiency of various expression quantification methods (The dataset is from MAQC project, which provides about 1 000 qRT-PCR validated genes as benchmark and two conditions, HBR and UHR, are used in this comparison. The Pearson correlation coefficients between the estimated logarithmic gene expressions and the qRT-PCR values are used to evaluate the accuracy. The execution time is measured using CPU time on the same platform (4 Intel Xeon 3.07 GHz CPUs and 24 GB RAM))
1.6Differential expression analysis
Differential expression (DE) analysis is the fundamental objective in the RNA-seq data analysis. For RNA-seq experiments, the sequencing noise from the sampling process is inevitable, and often the variability between technical replicates can be largely described by Poisson distribution. However, the high variability between biological replicates can cause the overdispersion problem. Therefore, most count-based methods, as shown in Table 8, commonly use the negative binomial distribution to address this problem[97], such as DESeq[98], baySeq[99], edgeR[100]and sSeq. In addition, Voom estimates the mean-variance relationship and applies the normal linearmodel to fit read counts[101]. Non-parametric methods, such as SAMSeq[102]and NOISeq[103], do not assume any form of the distribution, but rather rank the genes based on their expression. These count-based methods are suitable for detecting DE genes. However, when the research goal is to find DE isoforms, due to the read mapping ambiguity caused by sharing exons and sequence homology, it is inappropriate to directly use count-based methods for detecting DE isoforms. Therefore, a number of approaches are proposed to detect DE isoforms and labeled as ″Two-step″ methods as shown in Table 8. These methods usually are implemented in two steps. At the first step, gene and isoform expression is calculated. Then the obtained expression is used to detect differential expression in the second step. For example, our previous work, BDSeq[104], using the expression level obtained from GamSeq[105], adopts a Bayesian framework to simultaneously detect DE genes and isoforms with the consideration of the expression measurement uncertainty, which can account for both read mapping ambiguity and sequencing biases. The two-step methods usually suggest using the recommended expression estimation methods, e.g. Cufflinks recommended by Cuffdiff2[106], MMSEQ by MMDiff[107]and RSEM by EBSeq[108]. The receiver operating characteristic (ROC) curves of eight methods in detecting DE genes for a benchmark are shown in Fig. 3. MMDiff and BDSeq consider the expression measurement uncertainty, thus obtaining relatively higher area under the curve (AUC) values as well as count-based methods. Although the other three two-step methods obtain lower AUC values, they still benefit from the ability to detect DE isoforms.

Table 8 List of software for differential expression analysis

Fig.5 ROC curves of various DE analysis methods (The data is from MAQC project and 305 qRT-PCR validated DE genes with high confidence are selected as the benchmark[111]. The AUC value of each method is displayed in the legend.)
In the RNA-seq data analysis, the choice of the differential expression methods largely depends on research goals. If identifying DE isoforms is of interest, the two-step method is an appropriate choice.However, the comparison in Fig.5 has shown that the count-based methods perform as well as the two-step methods on detecting DE genes[104]. Also, these methods directly process the read counts and are computationally more efficient than two-step approaches. Thus, if DE genes are concerned, the count-based methods are a sensible choice. Moreover, the number of biological replicates also affects the choice of DE methods. For a fair number of biological replicates (at least more than five replicates per condition), it is beneficial to use the nonparametric methods, such SAMSeq and NOISeq, which do not make assumption on the form of the distribution of the observed data. However, the current RNA-seq data generally contain few biological replicates (e.g. two or three replicates). The parametric methods which assume a certain form of the distribution from empirical RNA-seq data are suitable choices, such as most count-based methods which assume the negative binomial distribution of reads. Therefore, users can choose the appropriate methods to carry out the DE analysis based on research goals and the size of RNA-seq data.
1.7Data visualization
Data visualization is an essential component of RNA-seq data analysis and receives more and more attention. For the complexity of the RNA-seq data, visualization can help the researchers to intuitively analyze and interpret the intrinsic transcriptome. Many genome browsers are designed for this purpose and can be divided into web-based browsers and stand-alone browsers[112]as shown in Table 9. These browsers can provide interactive visualization of sequences, genome annotation, multiple alignments, syntenic mappings, short read alignments and more. Many standard file formats are supported, such as GTF, GFF, SAM/BAM and BED, etc.
Due to the data quality and flexible accessibility, the web-based genome browsers are useful in promoting biological research. First, the browsers use the high-quality annotation data, which is collected and integrated by many public organizations. Second, researchers can use the web-based browsers anywhere via the network and a standard web browser, and avoid the software installation in the local servers or desktops[112]. Moreover, the web-based genome browsers contain some species-specific genome browsers, which can provide more detailed annotations for a particular species. For example, the Flybase genome browser focuses on Drosophila Genes & Genomes[113]. The stand-alone genome browsers are suitable for the visualization of the large locally-stored datasets, if web upload is prohibitive. Currently, integrative genomics viewer (IGV) is the most popular stand-alone genome browser. A keycharacteristic of IGV is its focus on the integrative nature of genomic studies, with the support for both array-basedand next-generation sequencing data, and the integration of clinical and phenotypic data[114]. Fig. 6 shows an example of using IGV to show the gene structure and the read coverage of gene ″C1orf63″ between two conditions.
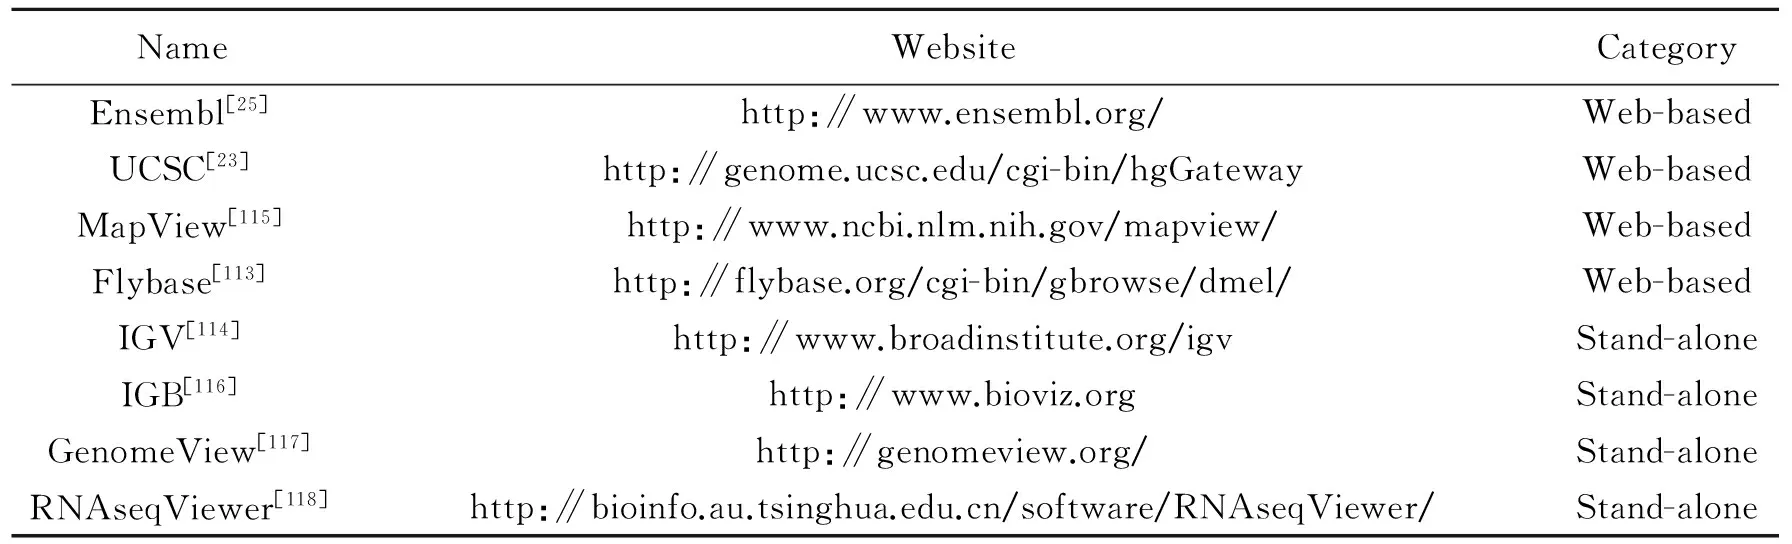
Table 9 List of genome browsers for RNA-seq data
Beside the above genome browsers, many R/Bioconductor packages also provide powerful tools to visualize the genomic annotations and alignments. The core of the Bioconductor infrastructure includes three packages i.e., IRanges, GenomicRanges, and GenomicFeatures. These packages provide scalable data structures for representing annotated ranges on the genome, with special support for transcript structures, read alignments and coverage vectors[119]. Moreover, two packages, seqplot[120]and Sushi[121], are also able to visualize RNA-seq data. For results of various RNA-seq studies, the R language can generate a multitude of different figures to display the results, such as heatmap, Volcano plot[122], MA plot and Venn diagram. For example, the Venn diagram can show the common DE genes detected by different DE methods[123]. In addition, CummeRbund is a particular R package that is designed to aid and simplify the task of analyzing Cufflinks output[124].

Fig.6 IGV example of gene ″C1orf63″ (The data is from MAQC project and gene annotation is from RefSeq database)
1.8Other analyses
The RNA-seq data analysis typically yields a list of DE genes or isoforms which may play important roles in a given phenomenon or phenotype. However, this list often fails to provide mechanistic insights into the underlying biology of the conditions being studied[125]. Therefore,the gene set analysis groups a long list of individual genes into smaller sets of related genes or isoforms according to biological knowledge databases, such as gene ontology(GO)[126]and Kyoto Encyclopedia of Genes and Genomes (KEGG)[127]. Many methods for gene set analysis are proposed, as shown in Table 10. GSEA[128]and GAGE[129]are primitively designed to analyze the microarray data, while they are easily extended to deal with the RNA-seq data. Pahview workflow uses the output from the major RNA-seq analysis tools and then uses GAGE to carry out the pathway analysis[130]. Due to the over-detection of differential expression for long and highly expressed genes in RNA-seq data, GOseq[131]and GSAseq[132]account for the effect of isoform length bias. Moreover, SeqGSEA integrates differential splicing into the gene set enrichment analysis[133]. In general, the gene set analysis or pathway analysis mainly depends on the accuracy of differential expression analysis from RNA-seq data.
Beside the gene set analysis, the network analysis is also an important research field in the high level analysis. The variation for the complex phenotypes is usually caused by a set of interacted genes which are often constructed by different types of biological networks[136]. The co-expression networks can help researchers to gain new insights into the function of genes, biological processes,the global structures of the transcriptome and the mechanism of complex diseases. Lancu et al. first proposes the RNA-seq de novo co-expression network, which is constructed by the Weighted Gene Co-expression Network Analysis approach[137]. However, this method is designed for microarray data and losses some useful information contained in RNA-seq data. To fully use the comprehensive information of the RNA-seq data, canonical correlation analysis (CCA) is used to construct the co-expression networks[138]. CCA measures the co-expression between two genes using various strategies according to the different data combination. Compared with microarray, the co-expression networks of RNA-seq data allow better estimation of network properties, such as network density, connectively, centralization and heterogeneity. The network analysis uses the gene or isoform expression level to construct the co-expression networks. Therefore, the read ambiguities and sequence biases directly influence the expression quantification and indirectly affect the co-expression network analysis.

Table 10 List of methods for gene set analysis
*This method is named GSAseq by us.
The high level analysis of RNA-seq data includes gene set analysis, pathway analysis and network analysis, etc. These analyses usually use the results of the upstream analysis, such as a list of DE genes or isoforms, and gene and isoform expression level. Therefore, the problems in the upstream analysis, such as read ambiguities, sequence biases and reference genome, etc., will indirectly influence the high level analyses. It is very crucial that a suitable method is chosen to obtain more accurate results of the upstream analysis.Moreover, a larger number of tools have been proposed for the microarray analysis and some of them can be simply extended for RNA-seq data analysis, but researchers need to consider the discriminable characters of the RNA-seq data, such as splicing junctions, isoform expression levels, and bias caused by isoform lengths.
In addition, other analyses or research tasks, such as identifying fusion genes[139], detecting allele-specific expression[140]and discovering small noncoding RNAs[141], can help researchers to further understand the intrinsic biological mechanism.
2 Applications
With the rapid development of RNA-seq technology in recent years, this technology has been widely applied to diverse research fields, such as disease studies, drug discovery and development, bacterial transcriptome, etc.
2.1Application to disease studies
The availability of the human genome sequence has allowed identification of disease-causing mutations in many complex diseases. However, finding the causative variations for most of the common diseases remains a complex and difficult task. RNA-Seq has been fruitfully applied to the study of cancer and host-pathogens interactions, and it is taking first steps for studying neurodegenerative diseases (ND) as well as neuropsychiatric diseases[142].Many RNA-Seq studies have suggested that detrimental fusion transcripts and alternative splicing may be involved in the carcinogenesis of different tissues and organs, such as breast[143], prostate[144], soft tissue[144],melanocytes[145]and lymphoid tissues andorgans[146]. Most of them have discovered a considerable fraction of fusion transcripts which may alter cell′s functionality and cause cancers. However, the pathogenesis of ND remains mostly unknown. Some published works use the RNA-seq on the Alzheimer′s disease[147], Parkinson[148], Down Syndrome[149]and cardiovascular disease[150], etc. These works revealed the great potential of using RNA-seq for human genetic diseases.
2.2Application to drug discovery and development
RNA-seq technology has been successfully applied to drug discovery and development and is able to identify drug-related genes, microRNAs and fusion proteins[151-152]. For drug discovery, identifying the potential drug target genes is a great challenge. RNA-seq is a powerful technology for investigating the drug-induced genome-wide gene expression. Thus, many recent studies have shown the applications of RNA-seq to identify drug-induced genes and significantly accelerated the process of target identification of drugs[153-154]. For example, green tea has proven to be an effective chemopreventive agent for lung cancer. RNA-seq revealed that the possible involvement of Activator Protein 1(AP-1) in tea polyphenol-induced chemoprevention[155]. Furthermore, drug resistance is a growing concern for cancer patients undergoing chemotherapy. Substantial evidences have shown that miRNA significantly influence the regulation of drug resistance[156]. RNA-seq is able to estimate miRNA expression profile in cells. Xu et al. applied RNA-seq to compare the expression level of 1 032 mature miRNAs in human leukemia K-562 cell line to multidrug resistant (MDR) K562/ADM cells induced by adriamycin treatment. The results show miR-381 and miR-495 might have the potential to reduce drug resistance in leukemia cells and provide a benefit to chemotherapy for cancer patients[157]. RNA-seq is becoming an indispensable tool for drug discovery and development.
2.3Application to bacterial transcriptome
RNA-seq technology has enabled tremendous leaps forward in understanding bacterial transcriptome. One important advantage of RNA-Seq is that it does not need prior knowledge of sequence information and is thus able to find novel transcripts. As most of bacteria still have no available reference genome or have only incomplete genome annotations, RAN-seq is very useful for bacterial transcriptome analysis. For example, an open source software system, Rockhopper, supports various stages of bacterial RNA-seq data analysis, including aligning sequencing reads to the refenence genome sequences by Bowtie2, quantifying transcript abundance by rSeq, testing for differential gene expression by DESeq and visualizing results by Integrated Genomics Viewer. It also allows the discovery of novel genetic features, as well as permitting the delineation of operons and untranslated regions, allowing the improvement and extension of sequence annotation[158-159]. Some researchers also successfully applied RNA-seq to the study of Mycoplasma pneumoniae[160], Pseudomonas syringae[161], Helicobacter pylori[162]and Salmonella enterica[163], etc. RNA-Seq data analysis has played an important role in the discovery of the related biological knowledge.
3 Conclusions
We comprehensively reviewed the RNA-seq data analysis, including genome annotation, quality control and pre-processing, read alignment, transcriptome assembly, gene and isoform expression quantification, differential expression analysis and data visualization, and introduced other analyses in brief, such as gene set analysis and co-expression network construction. For each research field, we select some representative methods, which are usually most classic or relatively new, to introduce the goals, problems and solutions.
A large number of available software tools can be chosen in the RNA-seq data analysis. Choosing suitable software to carry out interested studies and selecting the optimal parameters for the corresponding software are both crucial. They both directly influence the final results and the interpretation of the biological process. A suitable software tool largely depends on the research goals and reference genome sequences. Optimal parameters need to be selected according to RAN-seq data properties, such as single-end or paired-end, the insert length, stranded or non-strand, and etc. With a clear research goal, the appropriate software and suitable parameters can help to obtain better results and more meaningful biological inference. For example, if the DE analysis of known isoforms in the human brain is concerned, an unspliced aligner with reference transcriptome sequences and two-step software for DE analysis are sensible choices. However, since these tools adopt various strategies and usually present different performance on the same dataset, there is no benchmark to claim which software is the best or the most appropriate. In addition, many factors, such as computational efficiency, memory usage and user-friendliness, can also help for the software selection. Ultimately, an optimal route needs to be found for the selected software in order to gain better results before inferring the final biological decision. From the raw RNA-seq data to the final biological decision, a series of software for various studies are in need. For users, it is inconvenient to compile and install each tool. Therefore, the analysis pipeline containing a large number of tools for various studies is the most convenient choice[164-167].
Beside the analysis methods, the genome annotations and sequencing technologies can also affect the final results. Up to now, only a few organisms have relatively well-annotated information. The genomes of most of species are still not sequenced or well-annotated. However, even for those well-annotated organisms, such as human, rat and mouse, their genome annotations are still incomplete and lose a lot of alternative splicing events. In some RNA-seq studies, the genome annotation is very important prior biological knowledge. But the current methods are difficult to remedy the incompleteness of the genome annotation, even for the de novo transcriptome assembly. Although the next-generation sequencing technologies are undergoing fast development and have remarkably improved the transcriptome analysis, they still have some limitations. For example, the library construction step with PCR amplification generates the inevitable biases and the sequencing step brings the missing bases. These drawbacks can increase the data noise and result in incomplete information, which influences the accuracy of RNA-seq analysis. Currently, the third-generation sequencing technology is emerging, such as Pacific Bioscience and Nanopore Technologies[168]. Compared with the next-generation sequencing technology, the third-generation sequencing has two major characteristics. First, PCR is not needed before sequencing, which shortens DNA preparation time for sequencing. Second, the signal is captured in real time, which means that the signal is monitored during the enzymatic reaction of adding nucleotide in the complementary strand. The third-generation sequencing technology offers many advantages, such as dramatically longer read lengths, short time and lower overall cost. For the newest product of Pacific Bioscience, the average read length is 10 000~15 000 bp, which is longer than that of any next-generation sequencing technology. But the sequencing depth is lower than next-generation sequencers[169]. In data analysis, aligning and assembling single molecule reads is more difficult and requires more biological knowledge. However, current aligners and assemblers are developed to deal with short reads. Thus, new methods are urgently needed for processing the longer reads obtained from third-generation sequencing technology.
In the future, with the development of high-throughput sequencing technologies and bioinformatics methods, the researchers are able to investigate various species more easily and comprehensively. Furthermore, the discoveries of the investigations will enrich the genome databases and give more insights to understand the biological processes. While the cost of sequencing technologies rapidly decreases, it will become a reality that people can quickly and cheaply complete their whole-genome sequencing. The sequencing information for each person can help researchers to understand the mechanism of complex diseases and facilitate doctors to give more pertinent therapy.
[1]MORTAZAVI A, WILLIAMS B A, MCCUE K, et al. Mapping and quantifying mammalian transcriptomes by RNA-Seq[J]. Nature Methods, 2008, 5(7):621-628.
[2]WANG Z, GERSTEIN M, SNYDER M. RNA-Seq: a revolutionary tool for transcriptomics[J]. Nature Reviews Genetics, 2009, 10(1):57-63.
[3]METZKER M L. Sequencing technologies—the next generation[J]. Nature Reviews Genetics, 2010, 11(1):31-46.
[4]MARIONI J C, MASON C E, MANE S M, et al. RNA-seq: an assessment of technical reproducibility and comparison with gene expression arrays[J]. Genome Research, 2008, 18(9):1509-1517.
[5]OZSOLAK F, MILOS P M. RNA sequencing: advances, challenges and opportunities[J]. Nature Reviews Genetics, 2011, 12(2):87-98.
[6]MARGUERAT S, HLER B J. RNA-seq: from technology to biology[J]. Cellular and Molecular Life Sciences, 2010, 67(4):569-579.
[7]PACHTER L. Models for transcript quantification from RNA-Seq[J]. arXiv Preprint arXiv:1104.3889, 2011.
[8]RAPAPORT F, KHANIN R, LIANG Y, et al. Comprehensive evaluation of differential gene expression analysis methods for RNA-seq data[J]. Genome Biol, 2013, 14(9):R95.
[9]SEYEDNASROLLAH F, LAIHO A, ELO L L. Comparison of software packages for detecting differential expression in RNA-seq studies[J]. Briefings in Bioinformatics, 2015, 16(1):59-70.
[10]MAHER C A, KUMAR-SINHA C, CAO X, et al. Transcriptome sequencing to detect gene fusions in cancer[J]. Nature, 2009, 458(7234):97-101.
[11]SHI Y, CHINNAIYAN A M, JIANG H. rSeqNP: a non-parametric approach for detecting differential expression and splicing from RNA-Seq data[J]. Bioinformatics, 2015:btv119.
[12]SHEN S, PARK J W, LU Z-X, et al. rMATS: Robust and flexible detection of differential alternative splicing from replicate RNA-Seq data[J]. Proceedings of the National Academy of Sciences, 2014, 111(51):E5593-E5601.
[13]STEIJGER T, ABRIL J F, ENGSTR M P G, et al. Assessment of transcript reconstruction methods for RNA-seq[J]. Nature Methods, 2013, 10(12):1177-1184.
[14]GUTTMAN M, GARBER M, LEVIN J Z, et al. Ab initio reconstruction of cell type-specific transcriptomes in mouse reveals the conserved multi-exonic structure of lincRNAs[J]. Nature Biotechnology, 2010, 28(5):503-510.
[15]J NES J, HU F, LEWIN A, et al. A comparative study of RNA-seq analysis strategies[J]. Briefings in Bioinformatics, 2015:bbv007.
[16]HANSEN K D, BRENNER S E, DUDOIT S. Biases in Illumina transcriptome sequencing caused by random hexamer priming[J]. Nucleic Acids Research, 2010, 38(12):e131-e131.
[17]LI B, FILLMORE N, BAI Y, et al. Evaluation of de novo transcriptome assemblies from RNA-Seq data[J]. Genome Biol, 2014, 15(12):553.
[18]SIMS D, SUDBERY I, ILOTT N E, et al. Sequencing depth and coverage: key considerations in genomic analyses[J]. Nature Reviews Genetics, 2014, 15(2):121-132.
[19]CHEN G, WANG C, SHI T. Overview of available methods for diverse RNA-Seq data analyses[J]. Science China Life Sciences, 2011, 54(12):1121-1128.
[20]ALAMANCOS G P, AGIRRE E, EYRAS E. Spliceosomal pre-mRNA Splicing: Methods to study splicing from high-throughput RNA sequencing data[M]. [S.l.]:Springer, 2014:357-397.
[21]GARBER M, GRABHERR M G, GUTTMAN M, et al. Computational methods for transcriptome annotation and quantification using RNA-seq[J]. Nature Methods, 2011, 8(6):469-477.
[22]PRUITT K D, TATUSOVA T, BROWN G R, et al. NCBI reference sequences (RefSeq): current status, new features and genome annotation policy[J]. Nucleic Acids Research, 2012, 40(D1):D130-D135.
[23]KAROLCHIK D, BAERTSCH R, DIEKHANS M, et al. The UCSC genome browser database[J]. Nucleic Acids Research, 2003, 31(1):51-54.
[24]WILMING L G, GILBERT J G, HOWE K, et al. The vertebrate genome annotation (Vega) database[J]. Nucleic Acids Research, 2008, 36(suppl 1):D753-D760.
[25]HUBBARD T, BARKER D, BIRNEY E, et al. The ensembl genome database project[J]. Nucleic Acids Research, 2002, 30(1):38-41.
[26]HARROW J, FRANKISH A, GONZALEZ J M, et al. GENCODE: the reference human genome annotation for the ENCODE Project[J]. Genome Research, 2012, 22(9):1760-1774.
[27]YAMASAKI C, MURAKAMI K, FUJII Y, et al. The H-Invitational Database (H-InvDB), a comprehensive annotation resource for human genes and transcripts[J]. Nucleic Acids Research, 2008, 36(Suppl. 1):D793-D799.
[28]PRUITT K D, HARROW J, HARTE R A, et al. The consensus coding sequence (CCDS) project: identifying a common protein-coding gene set for the human and mouse genomes[J]. Genome Research, 2009, 19(7):1316-1323.
[29]THIERRY-MIEG D, THIERRY-MIEG J. AceView: a comprehensive cDNA-supported gene and transcripts[J]. Genome Biol, 2006, 7(1):S12.
[30]ZHAO S, ZHANG B. A comprehensive evaluation of ensembl, RefSeq, and UCSC annotations in the context of RNA-seq read mapping and gene quantification[J]. BMC Genomics, 2015, 16(1):97.
[31]WU P-Y, PHAN J H, WANG M D. Assessing the impact of human genome annotation choice on RNA-seq expression estimates[J]. BMC Bioinformatics, 2013, 14(Suppl 11):S8.
[32]LI B, RUOTTI V, STEWART R M, et al. RNA-Seq gene expression estimation with read mapping uncertainty[J]. Bioinformatics, 2010, 26(4):493-500.
[33]ANDREWS S. FastQC: a quality control tool for high throughput sequence data[J]. Reference Source, 2010.
[34]SCHMIEDER R, EDWARDS R. Quality control and preprocessing of metagenomic datasets[J]. Bioinformatics, 2011, 27(6):863-864.
[35]YANG X, LIU D, LIU F, et al. HTQC: a fast quality control toolkit for Illumina sequencing data[J]. BMC Bioinformatics, 2013, 14(1):33.
[36]BOLGER A M, LOHSE M, USADEL B. Trimmomatic: a flexible trimmer for Illumina sequence data[J]. Bioinformatics, 2014:btu170.
[37]GORDON A, HANNON G. Fastx-toolkit: FASTQ/A short-reads preprocessing tools[EB/OL]. http://hannonlab.cshl.edu/fastx_toolkit/index.html. [2010-08-23].
[38]PATEL R K, JAIN M. NGS QC Toolkit: a toolkit for quality control of next generation sequencing data[J]. PLOS ONE, 2012, 7(2):e30619.
[39]ZHOU Q, SU X, JING G, et al. Meta-QC-chain: comprehensive and fast quality control method for metagenomic data[J]. Genomics, Proteomics &Bioinformatics, 2014, 12(1):52-56.
[40]DELUCA D S, LEVIN J Z, SIVACHENKO A, et al. RNA-SeQC: RNA-seq metrics for quality control and process optimization[J]. Bioinformatics, 2012, 28(11):1530-1532.
[41]GARC A-ALCALDE F, OKONECHNIKOV K, CARBONELL J, et al. Qualimap: evaluating next-generation sequencing alignment data[J]. Bioinformatics, 2012, 28(20):2678-2679.
[42]WANG L, WANG S, LI W. RSeQC: quality control of RNA-seq experiments[J]. Bioinformatics, 2012, 28(16):2184-2185.
[43]LINDNER R, FRIEDEL C C. A comprehensive evaluation of alignment algorithms in the context of RNA-seq[J]. PLOS ONE, 2012, 7(12):e52403.
[44]JIANG H, WONG W H. SeqMap: mapping massive amount of oligonucleotides to the genome[J]. Bioinformatics, 2008, 24(20):2395-2396.
[45]LI H, RUAN J, DURBIN R. Mapping short DNA sequencing reads and calling variants using mapping quality scores[J]. Genome Research, 2008, 18(11):1851-1858.
[46]LEE W-P, STROMBERG M P, WARD A, et al. MOSAIK: a hash-based algorithm for accurate next-generation sequencing short-read mapping[J]. PLOS ONE, 2014, 9(3):e90581.
[47]CLEMENT N L, SNELL Q, CLEMENT M J, et al. The GNUMAP algorithm: unbiased probabilistic mapping of oligonucleotides from next-generation sequencing[J]. Bioinformatics, 2010, 26(1):38-45.
[48]RUMBLE S M, LACROUTE P, DALCA A V, et al. SHRiMP: accurate mapping of short color-space reads[J]. PLoS Comput Biol, 2009, 5(5):e1000386.
[49]WEESE D, HOLTGREWE M, REINERT K. RazerS 3: faster, fully sensitive read mapping[J]. Bioinformatics, 2012, 28(20):2592-2599.
[50]LUNTER G, GOODSON M. Stampy: a statistical algorithm for sensitive and fast mapping of Illumina sequence reads[J]. Genome Research, 2011, 21(6):936-939.
[51]LANGMEAD B, SALZBERG S L. Fast gapped-read alignment with Bowtie 2[J]. Nature Methods, 2012, 9(4):357-359.
[52]LI H, DURBIN R. Fast and accurate short read alignment with Burrows-Wheeler transform[J]. Bioinformatics, 2009, 25(14):1754-1760.
[53]LI R, YU C, LI Y, et al. SOAP2: an improved ultrafast tool for short read alignment[J]. Bioinformatics, 2009, 25(15):1966-1967.
[54]FONSECA N A, RUNG J, BRAZMA A, et al. Tools for mapping high-throughput sequencing data[J]. Bioinformatics, 2012:bts605.
[55]GRANT G R, FARKAS M H, PIZARRO A D, et al. Comparative analysis of RNA-Seq alignment algorithms and the RNA-Seq unified mapper (RUM)[J]. Bioinformatics, 2011, 27(18):2518-2528.
[56]HU J, GE H, NEWMAN M, et al. OSA: a fast and accurate alignment tool for RNA-Seq[J]. Bioinformatics, 2012, 28(14):1933-1934.
[57]BUTTERFIELD Y S, KREITZMAN M, THIESSEN N, et al. JAGuaR: Junction alignments to genome for RNA-Seq reads[J]. PLOS ONE, 2014, 9(7):e102398.
[58]WU T D, NACU S. Fast and SNP-tolerant detection of complex variants and splicing in short reads[J]. Bioinformatics, 2010, 26(7):873-881.
[59]WU J, ANCZUK W O, KRAINER A R, et al. OLego: fast and sensitive mapping of spliced mRNA-Seq reads using small seeds[J]. Nucleic Acids Research, 2013, 41(10):5149-5163.
[60]AU K F, JIANG H, LIN L, et al. Detection of splice junctions from paired-end RNA-seq data by SpliceMap[J]. Nucleic Acids Research, 2010, 38(14):4570-4578.
[61]HUANG S, ZHANG J, LI R, et al. SOAPsplice: genome-wide ab initio detection of splice junctions from RNA-Seq data[J]. Frontiers in Genetics, 2011, 2.
[62]KIM D, PERTEA G, TRAPNELL C, et al. TopHat2: accurate alignment of transcriptomes in the presence of insertions, deletions and gene fusions[J]. Genome Biol, 2013, 14(4):R36.
[63]TRAPNELL C, PACHTER L, SALZBERG S L. TopHat: discovering splice junctions with RNA-Seq[J]. Bioinformatics, 2009, 25(9):1105-1111.
[64]DOBIN A, DAVIS C A, SCHLESINGER F, et al. STAR: ultrafast universal RNA-seq aligner[J]. Bioinformatics, 2013, 29(1):15-21.
[65]MARCO-SOLA S, SAMMETH M, GUIGR, et al. The GEM mapper: fast, accurate and versatile alignment by filtration[J]. Nature Methods, 2012, 9(12):1185-1188.
[66]ENGSTR M P G, STEIJGER T, SIPOS B, et al. Systematic evaluation of spliced alignment programs for RNA-seq data[J]. Nature Methods, 2013, 10(12):1185-1191.
[67]SHI L, REID L H, JONES W D, et al. The MicroArray Quality Control (MAQC) project shows inter-and intraplatform reproducibility of gene expression measurements[J]. Nature Biotechnology, 2006, 24(9):1151-1161.
[68]ANGELINI C, CANDITIIS D D, FEIS I D. Computational approaches for isoform detection and estimation: good and bad news[J]. BMC Bioinformatics, 2014, 15(1):135.
[69]LI W, FENG J, JIANG T. IsoLasso: a LASSO regression approach to RNA-Seq based transcriptome assembly[J]. Journal of Computational Biology, 2011, 18(11):1693-1707.
[70]MEZLINI A M, SMITH E J, FIUME M, et al. iReckon: Simultaneous isoform discovery and abundance estimation from RNA-seq data[J]. Genome Research, 2013, 23(3):519-529.
[71]ROBERTS A, PIMENTEL H, TRAPNELL C, et al. Identification of novel transcripts in annotated genomes using RNA-Seq[J]. Bioinformatics, 2011, 27(17):2325-2329.
[72]LI J J, JIANG C-R, BROWN J B, et al. Sparse linear modeling of next-generation mRNA sequencing (RNA-Seq) data for isoform discovery and abundance estimation[J]. Proceedings of the National Academy of Sciences, 2011, 108(50):19867-19872.
[73]SONG L, FLOREA L. CLASS: constrained transcript assembly of RNA-seq reads[J]. BMC Bioinformatics, 2013, 14(Suppl 5):S14.
[74]BEHR J, KAHLES A, ZHONG Y, et al. MITIE: Simultaneous RNA-Seq-based transcript identification and quantification in multiple samples[J]. Bioinformatics, 2013, 29(20):2529-2538.
[75]BERNARD E, JACOB L, MAIRAL J, et al. Efficient RNA isoform identification and quantification from RNA-Seq data with network flows[J]. Bioinformatics, 2014:btu317.
[76]GRABHERR M G, HAAS B J, YASSOUR M, et al. Full-length transcriptome assembly from RNA-Seq data without a reference genome[J]. Nature Biotechnology, 2011, 29(7):644-652.
[77]ROBERTSON G, SCHEIN J, CHIU R, et al. De novo assembly and analysis of RNA-seq data[J]. Nature Methods, 2010, 7(11):909-912.
[78]SCHULZ M H, ZERBINO D R, VINGRON M, et al. Oases: robust de novo RNA-seq assembly across the dynamic range of expression levels[J]. Bioinformatics, 2012, 28(8):1086-1092.
[79]ZERBINO D R, BIRNEY E. Velvet: algorithms for de novo short read assembly using de Bruijn graphs[J]. Genome Research, 2008, 18(5):821-829.
[80]MARTIN J, BRUNO V M, FANG Z, et al. Rnnotator: an automated de novo transcriptome assembly pipeline from stranded RNA-Seq reads[J]. BMC Genomics, 2010, 11(1):663.
[81]CHANG Z, LI G, LIU J, et al. Bridger: a new framework for de novo transcriptome assembly using RNA-seq data[J]. Genome Biol, 2015, 16(1):30.
[82]XIE Y, WU G, TANG J, et al. SOAPdenovo-Trans: de novo transcriptome assembly with short RNA-Seq reads[J]. Bioinformatics, 2014, 30(12):1660-1666.
[83]WU Z, WANG X, ZHANG X. Using non-uniform read distribution models to improve isoform expression inference in RNA-Seq[J]. Bioinformatics, 2011, 27(4):502-508.
[84]HU M, ZHU Y, TAYLOR J M, et al. Using Poisson mixed-effects model to quantify transcript-level gene expression in RNA-Seq[J]. Bioinformatics, 2012, 28(1):63-68.
[85]SUO C, CALZA S, SALIM A, et al. Joint estimation of isoform expression and isoform-specific read distribution using multi-sample RNA-Seq data[J]. Bioinformatics, 2013:btt704.
[86]LIU X, ZHANG L, CHEN S. Modeling exon-specific bias distribution improves the analysis of RNA-seq data[J]. PLOS ONE, 2015, 10(10):e0140032.
[87]ROBERTS A, TRAPNELL C, DONAGHEY J, et al. Improving RNA-Seq expression estimates by correcting for fragment bias[J]. Genome Biol, 2011, 12(3):R22.
[88]GLAUS P, HONKELA A, RATTRAY M. Identifying differentially expressed transcripts from RNA-seq data with biological variation[J]. Bioinformatics, 2012, 28(13):1721-1728.
[89]LI B, DEWEY C N. RSEM: accurate transcript quantification from RNA-Seq data with or without a reference genome[J]. BMC Bioinformatics, 2011, 12(1):323.
[90]TURRO E, SU S-Y, GON ALVES, et al. Haplotype and isoform specific expression estimation using multi-mapping RNA-seq reads[J]. Genome Biol, 2011, 12(2):R13.
[91]JIANG H, WONG W H. Statistical inferences for isoform expression in RNA-Seq[J]. Bioinformatics, 2009, 25(8):1026-1032.
[92]DU J, LENG J, HABEGGER L, et al. IQSeq: integrated isoform quantification analysis based on next-generation sequencing[J]. PLOS ONE, 2012, 7(1):e29175.
[93]TRAPNELL C, WILLIAMS B A, PERTEA G, et al. Transcript assembly and quantification by RNA-Seq reveals unannotated transcripts and isoform switching during cell differentiation[J]. Nature Biotechnology, 2010, 28(5):511-515.
[94]NICOLAE M, MANGUL S, MANDOIU I I, et al. Estimation of alternative splicing isoform frequencies from RNA-Seq data[J]. Algorithms for Molecular Biology, 2011, 6(1):9.
[95]NARIAI N, KOJIMA K, MIMORI T, et al. TIGAR2: sensitive and accurate estimation of transcript isoform expression with longer RNA-Seq reads[J]. BMC Genomics, 2014, 15(Suppl 10):S5.
[96]GU J, WANG X, HALAKIVI-CLARKE L, et al. BADGE: A novel Bayesian model for accurate abundance quantification and differential analysis of RNA-Seq data[J]. BMC Bioinformatics, 2014, 15(Suppl 9):S6.
[97]SONESON C, DELORENZI M. A comparison of methods for differential expression analysis of RNA-seq data[J]. BMC Bioinformatics, 2013, 14(1):91.
[98]ANDERS S, HUBER W. Differential expression analysis for sequence count data[J]. Genome Biol, 2010, 11(10):R106.
[99]HARDCASTLE T J, KELLY K A. baySeq: empirical Bayesian methods for identifying differential expression in sequence count data[J]. BMC Bioinformatics, 2010, 11(1):422.
[100]ROBINSON M D, MCCARTHY D J, SMYTH G K. edgeR: a Bioconductor package for differential expression analysis of digital gene expression data[J]. Bioinformatics, 2010, 26(1):139-140.
[101]LAW C W, CHEN Y, SHI W, et al. Voom: precision weights unlock linear model analysis tools for RNA-seq read counts[J]. Genome Biol, 2014, 15(2):R29.
[102]LI J, TIBSHIRANI R. Finding consistent patterns: a nonparametric approach for identifying differential expression in RNA-Seq data[J]. Statistical Methods in Medical Research, 2013, 22(5):519-536.
[103]TARAZONA S, GARC A-ALCALDE F, DOPAZO J, et al. Differential expression in RNA-seq: a matter of depth[J]. Genome Research, 2011, 21(12):2213-2223.
[104]ZHANG L, CHEN S, LIU X. Detecting differential expression from RNA-seq data with expression measurement uncertainty[J]. Frontiers of Computer Science, 2014:1-12.
[105]LI Z, XUE-JUN L. A Gamma-based method of RNA-seq analysis[J]. Journal of Nanjing University (Natural Sciences), 2013, 4: 8.
[106]TRAPNELL C, ROBERTS A, GOFF L, et al. Differential gene and transcript expression analysis of RNA-seq experiments with TopHat and Cufflinks[J]. Nature Protocols, 2012, 7(3):562-578.
[107]TURRO E, ASTLE W J, TAVAR S. Flexible analysis of RNA-seq data using mixed effects models[J]. Bioinformatics, 2014, 30(2):180-188.
[108]LENG N, DAWSON J A, THOMSON J A, et al. EBSeq: an empirical Bayes hierarchical model for inference in RNA-seq experiments[J]. Bioinformatics, 2013, 29(8):1035-1043.
[109]YU D, HUBER W, VITEK O. Shrinkage estimation of dispersion in Negative Binomial models for RNA-seq experiments with small sample size[J]. Bioinformatics, 2013, 29(10):1275-1282.
[110]SHI Y, JIANG H. rSeqDiff: Detecting differential isoform expression from RNA-Seq data using hierarchical likelihood ratio test[J]. PLOS ONE, 2013, 8(11):e79448.
[111]BULLARD J H, PURDOM E, HANSEN K D, et al. Evaluation of statistical methods for normalization and differential expression in mRNA-Seq experiments[J]. BMC Bioinformatics, 2010, 11(1):94.
[112]WANG J, KONG L, GAO G, et al. A brief introduction to web-based genome browsers[J]. Briefings in Bioinformatics, 2012:bbs029.
[113]DRYSDALE R A, CROSBY M A, CONSORTIUM F. FlyBase: genes and gene models[J]. Nucleic Acids Research, 2005, 33(Suppl 1):D390-D395.
[114]THORVALDSD TTIR H, ROBINSON J T, MESIROV J P. Integrative Genomics Viewer (IGV): high-performance genomics data visualization and exploration[J]. Briefings in Bioinformatics, 2012:bbs017.
[115]WOLFSBERG T G. Using the NCBI map viewer to browse genomic sequence data[J]. Current Protocols in Bioinformatics, 2010:1.5. 1-1.5. 25.
[116]NICOL J W, HELT G A, BLANCHARD S G, et al. The Integrated Genome Browser: free software for distribution and exploration of genome-scale datasets[J]. Bioinformatics, 2009, 25(20):2730-2731.
[117]ABEEL T, VAN PARYS T, SAEYS Y, et al. GenomeView: a next-generation genome browser[J]. Nucleic Acids Research, 2012, 40(2):e12-e12.
[118]ROGX, ZHANG X. RNAseqViewer: visualization tool for RNA-Seq data[J]. Bioinformatics, 2013:btt649.
[119]LAWRENCE M, HUBER W, PAGES H, et al. Software for computing and annotating genomic ranges[J]. PLoS Comput Biol, 2013, 9(8):e1003118.
[120]STEMPOR P. seqplots: an interactive tool for visualizing NGS signals and sequence motif densities along genomic features using average plots and heatmaps[EB/OL]. Bioconductor http://github.com/przemol/seqplots.[ 2014-09-15].
[121]PHANSTIEL D H, BOYLE A P, ARAYA C L, et al. Sushi: An R/Bioconductor package for visualizing genomic data[EB/OL]. http://bioconductor.org/packages/devel/bioc/vignettes/Sushi/inst/doc/Sushi.pdf. [2014-08-11].
[122]CUI X, CHURCHILL G A. Statistical tests for differential expression in cDNA microarray experiments[J]. Genome Biol, 2003, 4(4):210.
[123]ZHANG Z H, JHAVERI D J, MARSHALL V M, et al. A comparative study of techniques for differential expression analysis on RNA-Seq data[J]. PLOS ONE, 2014, 9(8):e103207.
[124]GOFF L, TRAPNELL C, KELLEY D, et al. Analysis, exploration, manipulation, and visualization of Cufflinks high-throughput sequencing data[J]. R Package Version, 2012, 2(1):119-130.
[125]KHATRI P, SIROTA M, BUTTE A J. Ten years of pathway analysis: current approaches and outstanding challenges[J]. PLoS Comput Biol, 2012, 8(2):e1002375.
[126]ASHBURNER M, BALL C A, BLAKE J A, et al. Gene ontology: tool for the unification of biology[J]. Nature Genetics, 2000, 25(1):25-29.
[127]KANEHISA M, GOTO S. KEGG: kyoto encyclopedia of genes and genomes[J]. Nucleic Acids Research, 2000, 28(1):27-30.
[128]SUBRAMANIAN A, TAMAYO P, MOOTHA V K, et al. Gene set enrichment analysis: a knowledge-based approach for interpreting genome-wide expression profiles[J]. Proceedings of the National Academy of Sciences, 2005, 102(43):15545-15550.
[129]LUO W, FRIEDMAN M S, SHEDDEN K, et al. GAGE: generally applicable gene set enrichment for pathway analysis[J]. BMC Bioinformatics, 2009, 10(1):161.
[130]LUO W, BROUWER C. Pathview: an R/Bioconductor package for pathway-based data integration and visualization[J]. Bioinformatics, 2013, 29(14):1830-1831.
[131]YOUNG M D, WAKEFIELD M J, SMYTH G K, et al. Method gene ontology analysis for RNA-seq: accounting for selection bias[J]. Genome Biol, 2010, 11:R14.
[132]GAO L, FANG Z, ZHANG K, et al. Length bias correction for RNA-seq data in gene set analyses[J]. Bioinformatics, 2011, 27(5):662-669.
[133]WANG X, CAIRNS M J. SeqGSEA: a Bioconductor package for gene set enrichment analysis of RNA-Seq data integrating differential expression and splicing[J]. Bioinformatics, 2014:btu090.
[134]XIONG Q, MUKHERJEE S, FUREY T S. GSAASeqSP: A toolset for gene set association analysis of RNA-Seq data[J]. Scientific Reports, 2014, 4.
[135]SALES G, CALURA E, MARTINI P, et al. Graphite web: web tool for gene set analysis exploiting pathway topology[J]. Nucleic Acids Research, 2013, 41(W1):W89-W97.
[136]KUGLER K G, MUELLER L, GRABER A, et al. Integrative network biology: graph prototyping for co-expression cancer networks[J]. PLOS ONE, 2011, 6(7):e22843.
[137]IANCU O D, KAWANE S, BOTTOMLY D, et al. Utilizing RNA-Seq data for de novo coexpression network inference[J]. Bioinformatics, 2012, 28(12):1592-1597.
[138]HONG S, CHEN X, JIN L, et al. Canonical correlation analysis for RNA-seq co-expression networks[J]. Nucleic Acids Research, 2013, 41(8):e95-e95.
[139]SBONER A, HABEGGER L, PFLUEGER D, et al. FusionSeq: a modular framework for finding gene fusions by analyzing paired-end RNA-sequencing data[J]. Genome Biol, 2010, 11(10):R104.
[140]SKELLY D A, JOHANSSON M, MADEOY J, et al. A powerful and flexible statistical framework for testing hypotheses of allele-specific gene expression from RNA-seq data[J]. Genome Research, 2011, 21(10):1728-1737.
[141]FRIEDL NDER M R, MACKOWIAK S D, LI N, et al. miRDeep2 accurately identifies known and hundreds of novel microRNA genes in seven animal clades[J]. Nucleic Acids Research, 2012, 40(1):37-52.
[142]COSTA V, APRILE M, ESPOSITO R, et al. RNA-Seq and human complex diseases: recent accomplishments and future perspectives[J]. European Journal of Human Genetics, 2013, 21(2):134-142.
[143]EDGREN H, MURUMAGI A, KANGASPESKA S, et al. Identification of fusion genes in breast cancer by paired-end RNA-sequencing[J]. Genome Biol, 2011, 12(1):R6.
[144]NACU S, YUAN W, KAN Z, et al. Deep RNA sequencing analysis of readthrough gene fusions in human prostate adenocarcinoma and reference samples[J]. BMC Medical Genomics, 2011, 4(1):11.
[145]BERGER M F, LEVIN J Z, VIJAYENDRAN K, et al. Integrative analysis of the melanoma transcriptome[J]. Genome Research, 2010, 20(4):413-427.
[146]STEIDL C, SHAH S P, WOOLCOCK B W, et al. MHC class II transactivator CIITA is a recurrent gene fusion partner in lymphoid cancers[J]. Nature, 2011, 471(7338):377-381.
[147]TWINE N A, JANITZ K, WILKINS M R, et al. Whole transcriptome sequencing reveals gene expression and splicing differences in brain regions affected by Alzheimer’s disease[J]. PLOS ONE, 2011, 6(1):e16266.
[148]SOREQ L, GUFFANTI A, SALOMONIS N, et al. Long non-coding RNA and alternative splicing modulations in Parkinson’s leukocytes identified by RNA sequencing[J]. PLoS Comput. Biol, 2014, 10:e1003517.
[149]COSTA V, ANGELINI C, D’APICE L, et al. Massive-scale RNA-Seq analysis of non ribosomal transcriptome in human trisomy 21[J]. PLOS ONE, 2011, 6(4):e18493.
[150]POLLER W, TANK J, SKURK C, et al. Cardiovascular RNA interference therapy the broadening tool and target spectrum[J]. Circulation Research, 2013, 113(5):588-602.
[151]KHATOON Z, FIGLER B, ZHANG H, et al. Introduction to RNA‐Seq and its applications to drug discovery and development[J]. Drug Development Research, 2014, 75(5):324-330.
[152]BERG E L. Systems biology in drug discovery and development[J]. Drug Discovery Today, 2014, 19(2):113-125.
[153]DHAMGAYE S, BERNARD M, LELANDAIS G, et al. RNA sequencing revealed novel actors of the acquisition of drug resistance in Candida albicans[J]. BMC Genomics, 2012, 13(1):396.
[154]KIM J S, PARK W J. Insight into norfloxacin resistance of Acinetobacter oleivorans DR1: target gene mutation, persister, and RNA-Seq analyses[J]. Journal of Microbiology and Biotechnology, 2013, 23(9):1293-1303.
[155]PAN J, ZHANG Q, XIONG D, et al. Transcriptomic analysis by RNA‐seq reveals AP‐1 pathway as key regulator that green tea may rely on to inhibit lung tumorigenesis[J]. Molecular Carcinogenesis, 2014, 53(1):19-29.
[156]KUTANZI K R, YURCHENKO O V, BELAND F A, et al. MicroRNA-mediated drug resistance in breast cancer[J]. Clinical Epigenetics, 2011, 2(2):171-185.
[157]XU Y, OHMS S J, LI Z, et al. Changes in the expression of miR-381 and miR-495 are inversely associated with the expression of the MDR1 gene and development of multi-drug resistance[J]. PLoS ONE, 2013, 8(11):e82062.
[158]MCCLURE R, BALASUBRAMANIAN D, SUN Y, et al. Computational analysis of bacterial RNA-Seq data[J]. Nucleic Acids Research, 2013, 41(14):e140-e140.
[159]CROUCHER N J, THOMSON N R. Studying bacterial transcriptomes using RNA-seq[J]. Current Opinion in Microbiology, 2010, 13(5):619-624.
[160]G ELL M, VAN NOORT V, YUS E, et al. Transcriptome complexity in a genome-reduced bacterium[J]. Science, 2009, 326(5957):1268-1271.
[161]FILIATRAULT M J, STODGHILL P V, BRONSTEIN P A, et al. Transcriptome analysis of Pseudomonas syringae identifies new genes, noncoding RNAs, and antisense activity[J]. Journal of Bacteriology, 2010, 192(9):2359-2372.
[162]SHARMA C M, HOFFMANN S, DARFEUILLE F, et al. The primary transcriptome of the major human pathogen Helicobacter pylori[J]. Nature, 2010, 464(7286):250-255.
[163]SITTKA A, LUCCHINI S, PAPENFORT K, et al. Deep sequencing analysis of small noncoding RNA and mRNA targets of the global post-transcriptional regulator, Hfq[J]. PLoS Genet, 2008, 4(8):e1000163.
[164]GOECKS J, NEKRUTENKO A, TAYLOR J. Galaxy: a comprehensive approach for supporting accessible, reproducible, and transparent computational research in the life sciences[J]. Genome Biol, 2010, 11(8):R86.
[165]KALLIO M A, TUIMALA J T, HUPPONEN T, et al. Chipster: user-friendly analysis software for microarray and other high-throughput data[J]. BMC Genomics, 2011, 12(1):507.
[166]TORRES-GARC A W, ZHENG S, SIVACHENKO A, et al. PRADA: pipeline for RNA sequencing data analysis[J]. Bioinformatics, 2014, 30(15):2224-2226.
[167]ANDERS S, PYL P T, HUBER W. HTSeq-A Python framework to work with high-throughput sequencing data[J]. Bioinformatics, 2014:btu638.
[168]SCHADT E E, TURNER S, KASARSKIS A. A window into third-generation sequencing[J]. Human Molecular Genetics, 2010, 19(R2):R227-R240.
[169]LIU L, LI Y, LI S, et al. Comparison of next-generation sequencing systems[J]. BioMed Research International, 2012,.
Dr. Zhang Li is an associate lecturer of Nanjing Forestry University. Currently, he is working on the RNA-Seq data analysis.
Dr. Liu Xuejun is a professor and doctoral supervisor in the PARNEC Group of the College of Computer Science & Technology at Nanjing University of Aeronautics & Astronautics. Her research interests cover RNA-Seq data analysis, microarray data analysis, multidisciplinary optimization, and probabilistic modeling.
(Executive Editor: Zhang Tong)
, E-mail address: xuejun.liu@nuaa.edu.cn.
How to cite this article: Zhang Li, Liu Xuejun. A comprehensive review on RNA-seq data analysis[J]. Trans. Nanjing Univ. Aero. Astro., 2016, 33(3):339-361.
http://dx.doi.org/10.16356/j.1005-1120.2016.03.339
Q987Document code:AArticle ID:1005-1120(2016)03-0339-23
杂志排行

Transactions of Nanjing University of Aeronautics and Astronautics的其它文章
- Advances in Technologies of Piezoelectric Pumping with Valves
- Numerical Optimization on Aerodynamic/Stealth Characteristics of Airfoil Based on CFD/CEM Coupling Method
- Kinematic Calibration of Asymmetricly Actuated 6-DOF 3-PPPS Parallel Mechanism
- Kinematic Optimization of Bionic Shoulder Driven by PneumaticMuscle Actuators Based on Particle Swarm Optimization
- Dynamic Modeling and Adaptive Fast Nonsingular Terminal SlidingMode Control for Satellite with Double Rotary Payloads
- Joining Force of Heterogeneous Titanium Alloy in Linear Friction Welding Process