生态环境与农业气象研究进展
2016-07-31
生态环境与农业气象
生态环境与农业气象研究进展
1 农业气候资源与农业气象灾害监测预测
1.1 洪涝灾害监测预警与防控关键技术研究
揭示了全国及研究区域农业、玉米、水稻洪涝灾害的时空、风险分布特征,建立玉米、水稻洪涝灾害等级指标11套,分省农业洪涝灾害等级指标10套,玉米、水稻抗涝耐淹形态生理指标3套;研发防洪避灾种植模式3套,制定灾害防控技术规程3项。成果已在湖南、江西、浙江、安徽、广西、重庆、陕西7省(区、市)进行了气象业务应用,制作发布洪涝灾害农业气象专题服务产品、决策服务报告40多期,洪涝预警与减灾服务取得了显著的减灾增产效果。提出了基于灾害风险逆过程分析的等级指标构建方法,突破了基于降水过程的农业、玉米、水稻洪涝灾害等级阈值确定、分省指标可比性等关键技术,为农业灾害实时监测预警评估的业务发展提供了指标支撑。(霍治国)
1.2 重大农业气象灾害立体监测与动态评估技术研究
通过对西南玉米和水稻干旱、南方双季稻低温、黄淮海小麦干热风不同灾害的立体监测与动态评估技术的研究,提出不同农业气象灾害的致灾气象指标和灾害分级指标体系,研发了可在气象业务中应用的基于地面观测、卫星遥感和作物模式相结合的不同灾害的立体监测技术和动态评估的技术方法。上述工作在以下几个方面有所创新:在信息耦合上,集成了地面气象、农业气象、田间小气候观测以及农情、灾情和地理信息等多源信息,向多源信息方向发展;在立体监测和动态评估技术研发上,向模型化、动态化和精细化方向发展;在多源观测资料信息的使用过程中,注重了尺度转换技术。该项目研究解决的农业气象灾害监测与评估中的关键技术是完全针对我国农业生产模式和灾害对象,具有明显的地域性和现实性等特点;同时该研究也是针对气象和农业部门的业务需求和决策服务需求而展开的。因此,本项目的实施可显著地提高我国农业气象灾害的监测和评估能力。(赵艳霞)
1.3 重大农业气象灾害预测预警关键技术研究
揭示了气候变暖背景下南方双季稻低温灾害突变、发生趋势、等级风险、综合风险的地理分布特征,提出了预测预警的风险分区方法;建立了南方双季稻低温灾害预测预警指标与技术体系,≥5天预警、≥1个月预测的准确率在80%以上;开发了精细化土壤墒情预报系统,实现了自动调用资料、自动运行、自动生成产品等功能;利用改进后的作物模拟模型对区域农业干旱进行模拟验证,将模型分别采用链接遥感技术和不链接遥感技术2种方式模拟区域农业干旱,并将其模拟结果与基准值进行对比。结果表明,引入遥感信息后,作物干旱模型对区域农业干旱的模拟能力明显提高。研究成果已在相关省级农业气象业务服务中推广应用,提升了农业气象灾害预测预警的时效性、准确率。(刘建栋)
1.4 重大农业气象灾害风险评价与管理关键技术研究
针对我国典型地区农业干旱、洪涝、低温冷害等农业气象灾害发生频繁、影响严重且目前尚无有效风险评价技术的状况,选择东北、华北和长江中下游地区主要粮食产区的主要农作物为研究对象,基于多种技术集成的风险分析方法,从农业气象灾害风险研究入手,以农作物为中心,从土壤-作物-大气连续体出发,提出了基于灾害形成机理的农业气象灾害风险综合评价理论;构建了农业气象灾害静态和动态风险相耦合的评价与风险图绘制技术、多种农业气象灾害风险综合评价与区划技术及农业气象灾害风险预警技术;编制了主要粮食产区的农业气象灾害风险图谱;研制了农业气象灾害风险分析与评价系统;提出了农业气象灾害综合风险管理技术对策体系。主要研究成果在吉林、河北等省的气象、农业等相关部门推广应用,取得了良好效果,为农业防灾减灾提供了必要的理论依据和技术支撑。(王春乙)
1.5 基于遥感信息与气温的夏玉米土壤水分估算模型
土壤水分是土壤-植被-大气连续体的一个重要组分,是决定陆地生态系统水分状况的关键因子,也是作物的水分供应库。为估算站点尺度不同深度的土壤水分,基于能量平衡方程和水分亏缺指数(WDI),提出了基于地面遥感信息(植被指数NDVI和下垫面温度)和气温估算土壤相对湿度(WR)方法。利用2014年中国气象局固城生态与农业气象试验站夏玉米水分控制试验资料验证表明,该方法可以有效估算不同深度的土壤相对湿度,其中对0~10 cm土壤水分估算精度最高,决定系数达90%;对0~20 cm到0~50 cm土壤水分估算的平均相对误差均在15%以内,相对均方根误差均在20%以内。(周广胜)
1.6 玉米干旱致灾临界气象条件及其监测预警技术
基于试验资料和相关研究资料的综合分析,初步阐明了作物在干旱和其他气候变化关键因子相互作用下,叶片气孔导度、水分利用率和生长相互协调的响应和适应机制。基于项目观测试验资料分析了在不同生育期干旱发生发展过程中玉米的光合生理和叶绿素荧光参数变化特征以及复水的影响。拔节期开始水分控制的玉米,控水2周后SPAD、gs、E显著下降,但叶绿素荧光参数(ΦPSII、Fv'/Fm')无显著下降;抽雄期开始水分控制的玉米,控水1周后光合特征参数就发生显著下降,且抽雄期干旱导致的光合速率下降速度大于拔节期;在复水干旱解除后,光合能力虽有一定程度的恢复,但仍没有达到其对照的水平。对同一叶片全生育期的观测资料分析表明,Asat、gs、E随着生育期(即叶片的叶龄)的进展呈下降趋势、SPAD呈先升后降趋势,且干旱处理的玉米各参数的下降比对照大;而同一叶片的叶绿素荧光参数(ΦPSII、Fv'/Fm')在水分充分条件(对照)下呈现较为平稳的波动,4种干旱处理没有导致荧光参数的显著下降,并在干旱后复水的情况下比对照有明显升高。这表明,随着叶片生长发育的进程,其光合系统II(PSII)的耐旱性可能有所增加。
利用土壤湿度观测资料对气象干旱指标等级重新划分。首先采用线性内插法得到站点逐日土壤相对湿度序列(1992—2010年);分别分析玉米生长季内水分胁迫下(各发育阶段土壤相对湿度低于对应阶段玉米发生干旱时的土壤相对湿度上限值)的逐日平均土壤相对湿度与平均MCI指数之间的关系,建立MCI指数与土壤相对湿度的关系模型;根据观测资料确定了玉米不同生育期气象干旱指数的上限。将以上结果初步在业务系统中实现,在气象灾害风险管理系统中建设了玉米影响评估模块,该系统可以实时计算玉米干旱累计指数:同一发育阶段期间各干旱过程逐日值的累加,即当MCI小于上限时,干旱指数开始累加;不同发育阶段及全生育期干旱累积指数计算方法为各发育阶段累加值与历史上该时段干旱对产量影响的影响系数乘积之和。该系统2016年9月30日全国玉米干旱累积指数的分析结果显示,玉米气象干旱主要分布在东北的西部、内蒙古东部以及湖北、安徽、江苏、四川等地(图1)。(周莉)
1.7 植物适应未来气候变化的自我防御机制
对贝加尔针茅进行相对长期(42 d)的增温(正常、增温4 ℃)和水分变化(降水增加15%、正常、降水减少15%)模拟试验结果表明,在相对长的暖干气候条件下,贝加尔针茅的光合作用主要受非气孔限制调控,尽管光能利用效率和光合作用速率减弱,但自我防御机制使贝加尔针茅有能力维持正常的生长活动。(周广胜)
1.8 北方冬小麦精细化土壤墒情和灌溉预报技术及其应用
完善了农田土壤水分和灌溉预报数据集,其中北方冬小麦区的逐日气象资料和自动土壤水分资料扩展到2016年7月31日。进一步深入研究了遥感作物水分亏缺指数反演方法。分析了ÅngstrÖm-Prescott公式中a、b系数的年代际变化,确定了研究区域以及中国各大区域1961—2010年各年代逐月a、b系数参考值。以冬小麦生长机理、农田土壤水分平衡方程为根据,以本项目各种试验资料为依托,在前期冬小麦农田水量平衡简化模型和精细化逐日多层土壤墒情和灌溉预报模型研究和3个省级冬小麦精细化土壤墒情和灌溉预报系统本地化试用基础上,初步构建了国家级冬小麦精细化土壤墒情和灌溉预报系统程序。利用项目科研成果和3个省级冬小麦精细化土壤墒情和灌溉预报系统业务平台,分别在河北、山东、河南省发布了一些服务产品,为农业等部门灌溉决策提供了有价值的参考信息(图2)。(毛飞)
1.9 海南冬季瓜菜气象灾害风险区划
基于海南省各市县1971—2010年3—5月不同持续少雨日数的发生频率及其过程降水量,开展了辣椒春季干旱人工控制试验。试验采用均匀组合设计,设置持续干旱日数(10、15、20、25、30、35、40、45、50d)和补水量(0、2、4、6、8、10、12、14、16 mm)2因素9水平处理,测定不同处理下的不同深度(10、20、30、50、100 cm)土壤湿度,分析不同处理对辣椒死苗率、生理特性和产量的影响。试验结果表明,辣椒死苗率与20 cm土壤相对湿度和持续干旱日数显著相关,与补水量相关性不大。随着持续干旱日数的增加,辣椒净光合速率、蒸腾速率和气孔导度均呈下降趋势,辣椒相对产量损失呈明显加重趋势。构建了基于持续干旱日数的辣椒春季干旱等级指标,经历史灾情验证,与实际发生情况相吻合。为开展辣椒春季干旱监测预警业务服务提供了指标和方法支持。(霍治国)
1.10 1961—2015年中国潜在蒸散时空变化特征与成因
基于全国552个气象站点1961—2015年逐日气象数据,利用Penman-Monteith公式得到各站点逐日蒸散量(ET0),以全国和各干湿气候区为研究单元,从年、季节和年代际尺度分析ET0的时空分布特征及其变化成因。结果表明:我国年平均ET0为621~1733 mm,在年、年代际尺度表现为干旱区ET0最高、半干旱区和湿润区次之、半湿润区最低;季节尺度上,ET0的空间分布存在明显差异,且夏季ET0最高、春秋季次之、冬季最低。我国年平均ET0以-0.52 mm/a的速率递减,该下降趋势在1972年存在突变现象;干旱区和湿润区大部分站点ET0呈减小趋势,且干旱区减小速率较大;而在半干旱区和半湿润区,ET0呈增加和减小趋势的站点数大致相当。研究表明,近55年我国ET0呈减少趋势主要是由风速减小、日照时数降低和水汽压微弱增加共同导致的。(王培娟)
1.11 基于冬小麦水分胁迫试验的干旱监测指数构建
借助中国气象科学研究院大型人工水分控制试验场,于2013—2014年和2014—2015年的冬小麦生长期内,分别种植当地冬小麦主栽品种“河农6425”和“郯麦98”,对其进行3个水分胁迫处理,同时设置1个对照,研究不同水分胁迫条件对冬小麦生长发育的影响。根据水量平衡方程,计算不同水分胁迫和对照条件下冬小麦全生育期的实际蒸散量(ETa),以对照条件下的实际蒸散作为作物标准蒸散(ETc),构建冬小麦全生育期干旱监测指数(CDMI=1-ETa/ETc),并结合不同水分胁迫条件下冬小麦减产率和CDMI的关系,划分干旱等级。本研究建立的干旱监测指数以标准蒸散为参照,与基于潜在蒸散的干旱监测指数相比,能够真正地反映农作物的干旱程度,可为我国华北冬麦区干旱监测提供客观依据。(王培娟)
1.12 西南地区水稻洪涝等级指标构建及风险分析
为全面评估水稻洪涝的综合风险,基于自然灾害系统理论和农业气象灾害风险评估方法,利用西南地区(重庆、四川、贵州和云南)193个气象站1961—2012年逐日降水资料、396个县(市)1981—2012年水稻产量、面积资料和17个农气站点水稻生育期数据,以及西南地区数字高程(DEM)数据,构建区域水稻洪涝灾害致灾因子危险性、承灾体暴露性、孕灾环境敏感性和区域抗灾能力指数,以及综合风险评价模型,对西南地区水稻洪涝进行风险分析与区划。结果表明:(1)水稻不同生育阶段洪涝等级风险概率分布存在明显的地区差异,洪涝危险性表现为移栽分蘖期>拔节孕穗期>抽穗成熟期;全生育期高、次高危险区主要分布于云南南部和东北部、贵州南部,以及四川的成都、眉山和德阳地区。(2)基于不同时间序列的水稻相对暴露率明显波动,水稻生产承灾体高、次高暴露区主要集中在四川东北部和重庆地区;孕灾环境高、次高敏感区主要位于云南北部、四川南部和贵州东南部地区;水稻洪涝低抗灾能力区主要位于贵州。(3)西南地区水稻洪涝综合风险呈由中部向四周递增的趋势,高、次高风险区主要位于贵州南部、云南南部和四川东北部地区,低风险区位于重庆南部和云南北部地区(图3)。(杨建莹)
1.13 冬前和春季灌溉对华北冬小麦影响的研究
通过在灌溉越冬水(80/150 mm)和不灌溉越冬水条件下,春季气温分别稳定通过0 ℃、3 ℃、7 ℃和10 ℃时进行春季第1水灌溉的多年田间模拟试验,探讨了冬前和春季灌溉对华北冬小麦生长发育和籽粒产量的影响,以揭示华北冬小麦适宜的灌溉方式和灌溉时间。结果表明,无越冬水灌溉条件下,冬后气温稳定通过0 ℃时进行春季第1水灌溉能够缓解冬季干旱,使冬小麦春季有效茎数增加,对有效穗数和产量增加作用显著;越冬水灌溉条件下,春季气温稳定通过7 ℃时进行春季第1水灌溉能够减少关键生育期的连续干旱时间,有利于冬小麦产量增加。越冬水量的大小(80 mm和150 mm)对冬小麦产量的影响不显著。春季第1水对冬小麦的生长发育至关重要,无春季第1水灌溉条件下,冬小麦减产平均达32.2%。因此,为达到冬小麦的稳产高产和节水灌溉目的,无越冬水灌溉条件时,应选择在春季气温稳定通过0 ℃时进行春季第1水灌溉;有越冬水灌溉条件时应适量灌溉,并选择春季第1水在气温稳定通过7 ℃时灌溉。(刘涛)
1.14 荒漠草原土壤呼吸对水热变化的响应机制
利用开路式土壤碳通量测量系统,基于2011—2012年野外观测资料,针对陆地碳源汇评估中的土壤呼吸,在荒漠草原开展不同水热条件下土壤呼吸的变化研究及其控制机制研究。结果发现,荒漠草原生长季的土壤呼吸显著大于非生长季。非生长季,土壤呼吸的差异主要是由增温处理引起的,土壤呼吸与土壤温度呈显著的指数相关(R2= 0.74,p< 0.01)。在生长季,根系呼吸(21.9%)对荒漠草原土壤呼吸的贡献率远低于异氧呼吸(78.1%),土壤有机碳、土壤含水量、根系生物量、微生物量是影响土壤呼吸的主要因素,其中,0~10 cm土壤有机碳是土壤呼吸最重要的影响因子,土壤含水量对土壤呼吸的间接贡献率最高。基于生长季不同水热条件下荒漠草原土壤呼吸对其影响最大的4个因子的响应关系,建立了土壤呼吸的响应模型(R2= 0.67,p< 0.01)。(刘涛)
1.15 基于遥感方法的黄淮海平原冬小麦耗水特征及用水结构研究
利用2011—2012年气象数据、遥感影像(MODIS)、地表能量平衡方程模型 (SEBA)和地面农作物信息,结合农田水分平衡方程,对2011—2012年冬小麦生长季内有效降水量、农田灌溉量、实际耗水量和农田水分损失进行了估算,并采用调研的灌溉量数据对估算结果进行对比验证。结果表明,灌溉量估算值与实际值间有较好的相关性(R2= 0.79);冬小麦生长前期,降水能满足70%以上的农田耗水;>90%冬小麦灌浆期耗水依靠灌溉;黄淮海区域灌溉量高值区域位于西部山前平原水浇地区,灌溉均值为412.76 mm;区域冬小麦耗水量与灌溉量成正相关(R2= 0.68,p< 0.01) 。(杨建莹)
2 农业对气候变化的响应与适应
2.1 1961年以来中国农业气象灾害演变规律及其灾损评估
气候变暖背景下中国极端气候事件呈增加趋势,气候将变得暖时更暖、旱时更旱、涝时更涝。农业干旱灾害发展呈面积增大和频率加快趋势,且北方旱灾影响明显高于南方;冬小麦涝渍呈增加趋势且生育后期灾害强度增加更明显;水稻高温热害增加趋势明显且重度灾害显著增加,低温冷害总体呈减少态势,但近30年低温阴雨呈增加趋势;霜冻害总体呈减少趋势但局部地区有加重趋势。农业气象灾害的演变趋势、强度和类型已经发生显著变化,使得当前针对农业气象灾害开展种植制度调整的避灾农业面临二次避灾风险,严重威胁到国家粮食安全、生态文明建设和精准扶贫。(周广胜)
2.2 中国草地生态系统固碳现状、速率、机制和潜力研究
基于野外4000多个调查点和TEM模型,利用气候、海拔、土壤和植被数据,以月为时间步长对中国草地生态系统的碳密度、储量空间分布及动态变化进行了模拟;估算了全国草地生态系统的碳储量;绘制了中国草地土壤和植被碳密度的空间分布图,揭示了其空间分布特征;定量描述了气候和人类共同作用下,1960年代以来中国草地碳密度的时空变化幅度及区域差异;模拟了未来气候情景下中国草地碳收支动态。主要创新点是针对一套参数TEM模型空间模拟精度不高的问题,提出了基于草地生态型的“分区域参数化率定方案”,建立了适合中国草地的TEM模型参数系列,为准确监测和评估全国草地生态系统碳收支、NPP、GPP等提供了基础。(汲玉河)
2.3 气候变化背景下青稞安全气象保障关键技术研究
在A2和B2气候情景下,西藏太阳能资源虽然有略微降低的趋势,但其仍为世界上太阳能资源最丰富的地区之一。无论A2还是B2气候情景下,西藏地区的太阳能资源总体的时间分布格局没有发生明显改变,均表现为冬季最小、夏季最大;但是其变化幅度在各月份上差异明显,总体表现为夏季增加,而其他季节则相对降低。气候变化背景下西藏全年降水总体上表现为增加趋势,但其仍为世界上降水量较少的地区之一。降水的年内分布仍相当不均,冬季最小、夏季最大,且夏季降水增加明显;空间上自东向西逐渐减小的分布格局亦没有发生改变,但西部降水较东部降水增加更为明显。气候变化背景下的增温效应有益于青稞产量提高,但产量的空间分布特征基本保持不变。目前青稞产量高值区在未来气候变化背景下增值更大,换言之,目前适宜区更加适宜青稞产量提高。(刘建栋)
2.4 基于APSIM模型识别气候变化对北方地区主要旱地作物产量的影响
通过优化常用的农作物模拟模型(APSIM),识别北方春小麦和春玉米关键发育期和产量对气候变化的响应。研究表明,APSIM模型在内蒙古、甘肃、黑龙江、吉林、辽宁等北方地区有较好的适用性。1961—2010年内蒙古春小麦潜在产量总体呈降低的变化趋势,平均值为3561 kg/hm2,其中20世纪80年代潜在产量最高,达3681 kg/hm2,21世纪初最低,为3433 kg/hm2。区域间差异明显:近50年内蒙春小麦潜在产量分布由中间向东部和西部呈条带状逐渐增加,且在3个区域中,西部麦区潜在产量最大,中部麦区最小。影响内蒙春玉米生育期的主要气象因子是最高温度,其次是最低温度,太阳辐射、降水和潜在蒸散对春玉米生育期的影响效果一样。影响春玉米产量的主要气象因子依次为最高温度、最低温度、降水、太阳辐射和潜在蒸散(图4)。(赵俊芳)
2.5 不同积温模型对东北春玉米不同阶段积温的稳定性评价
基于东北地区春玉米品种“丹玉13”“龙单13”“东农248”和“四单19”生长发育资料和气象观测资料,分别拟合了沈国权、高亮之和殷新佑非线性积温模型参数,对3种积温模型模拟结果进行比较和稳定性评价,并与常用积温法计算的结果对比。对常用积温法、沈国权非线性积温模型、高亮之非线性积温模型、殷新佑非线性积温模型4种方法进行稳定性分析的结果表明,自出苗到成熟的全生育期,3种非线性积温模型均优于常用积温法,表现出更好的稳定性。在出苗-拔节阶段,4种方法在“丹玉13”品种的稳定性一致,而“龙单13”“东农248”和“四单19”3个品种的常用积温法略逊于3种非线性积温模型;拔节-抽雄阶段是稳定性最差的阶段,无论哪个品种,在此阶段的变异系数均最大;在抽雄-成熟阶段,4种方法的稳定性差别不大。研究结果可为东北春玉米发育期预报和产量预报等工作提供理论依据和技术支持。(郭建平)
2.6 气候变化对东北区农业气候资源的影响
系统分析了气候变化情景下东北主要农业气候资源的时空特征。1961—2099年期间,热量资源整体为南高北低,未来热量资源明显增加,东北地区年均温度呈升高趋势,中排放情景(RCP4.5)和高排放情景(RCP8.5)下分别升温约2 ℃和3 ℃,≥10 ℃初日提早3~4 d,初霜日推迟2~6 d,导致可能生长季延长4~10 d;温度的升高与生长季的延长使得积温大幅增加,截至21世纪末,增幅分别达400 ℃·d和700 ℃·d。水资源呈增加趋势,但变化较少。热量资源变化速率有明显变化,高排放情景下增温速率更快,东北地区未来有暖湿趋势。以温度升高为代表的气候变化在东北地区对农业生产具有一定的积极影响,生长季的延长和积温的增加使得农作物可利用热量资源更加丰富,原有因受到热量资源限制的不可种植区域将会减少,可种植区域扩大;种植品种得到改善,原来种植早熟品种区域可由中晚熟品种代替,晚熟品种种植面积进一步扩大,如晚熟玉米积温需要达到3000 ℃·d,由原有松嫩平原北扩至大兴安岭附近,甚至在辽宁的部分地区可种植一年两熟制作物。(郭建平)
2.7 大气CO2浓度升高和增温影响作物需水量变化机理研究
在2013—2015年试验基础上,2016年分析了增温和CO2浓度升高环境下小麦水分利用效率变化及其与需水量和产量的耦合变化机理。分析结果表明,增温和CO2浓度升高对于项目需水量变化具有叠加复合影响效应。增温提高了小麦群落和冠层温度,促进能量流动和水分循环,增加了小麦植株蒸腾和株间蒸发量,增加了小麦日需水量。CO2浓度升高导致叶片气孔导度降低、减少叶片蒸腾速率,有助于提高水分利用效率。另外,CO2浓度升高的肥效作用有利于提高小麦产量。综合来看,增温和CO2浓度升高增加了小麦需水量,提高了水分利用效率。需水量增加有助于提高小麦产量。在未来增温和CO2浓度升高环境下,通过热量资源和CO2的不断增加和转入,小麦需水量、水分利用效率和产量三者是处于正反馈耦合机制中。(俄有浩)
2.8 北方农牧交错区退耕地植被演替调控机制研究
以空间代替时间的样带调查方法,研究北方农牧交错区退耕地植被演替过程,从相对宏观的角度揭示自然环境因子对退耕地植被演替的调控机制。针对项目设定的研究目标,在山西-宁夏农牧交错带进行了野外样带调查工作。重点收集了农牧交错区典型生态系统0~500 cm土壤深度的土壤湿度、质地、养分含量,以及植被盖度、生物量、物种等信息。鉴于降水、气温等气象因素具有较大的时空波动性,拟从更稳定的土壤干层、土壤质地、地貌等环境信息,结合气候因素识别出制约中国北方生态系统空间分布、群落演替的关键因素,研究生态系统的环境适应性及耐受气候变化的弹性。此外,采集了树木年轮数据,以配合研究北方生态系统对气候变化响应与适应。(汲玉河)
2.9 增温与CO2浓度升高对冬小麦处理和品质的影响
2015/2016年生长季试验观测到的发育期、株高、单株生物量和密度的影响结果与前2年基本一致,穗粒数减少仍然是导致减产的根本原因,不同的是该试验季复合处理的小穗数减少达到显著水平,穗粒数减少主要归因于小穗数下降。对连续3年试验的籽粒粗蛋白、粗脂肪、粗纤维和粗淀粉测定结果进行了统计分析,在复合处理条件下,冬小麦籽粒的蛋白质含量均有增加,其中2年表现为显著增加,而淀粉、脂肪和纤维含量均没有规律性的变化。冬小麦叶片全氮含量从拔节期至开花期有逐渐减少的趋势,但在各发育阶段对照与复合处理的叶片全氮含量没有显示出显著性差异,在各发育阶段对照与复合处理的叶片有机碳含量也没有显著性的差异。(谭凯炎)
2.10 我国小麦品种改良对物候的影响
利用农业气象观测数据分析了我国小麦品种改良对物候的影响。结果表明,春小麦品种变化造成不同发育阶段间的热量单位有所增加,出苗-成熟期每年增加3.5 ℃的热量单位。对不同地区的比较发现,西藏、内蒙古和新疆地区春小麦品种变化对物候的影响较大,对不同发育期间的热量单位多为正效应。我国冬小麦品种变化对播种到出苗、出苗到停止生长、停止生长到返青、拔节到抽穗、乳熟到成熟期间热量单位的影响趋势不明显,而对返青到拔节、抽穗到乳熟期间热量单位有正效应。其中,青海、西藏、福建和新疆地区冬小麦品种变化对物候的影响仍较大,对不同发育阶段的热量单位多为正效应(图5)。(马玉平)
2.11 冬小麦发育期主要影响因子作用的量化及对产量影响的模拟
收集了华北平原47个农业气象观测站1986—2010年冬小麦的发育期资料和同期的逐日平均气温数据,利用基于3基点温度(Tb为0 ℃,Topt为22 ℃,Tmax为32 ℃)的双线性发育期模型,以1986—1988年的平均品种状态对发育期模型进行参数化,随后模拟1986—2010年间的返青-抽穗期与抽穗-成熟期,并计算模拟误差随时间的变化趋势。品种更替使冬小麦返青-抽穗日数总体呈增加趋势,但趋势不明显,且存在显著的区域差异,其中平原南部、北部日数略有缩短,而中部及山东东部增加较明显。品种变化使抽穗-成熟期日数呈显著增加趋势,平原南部增加尤其明显,平原中部和东西北部增加不明显,有些区域甚至还略有缩短。本研究表明,品种变化对发育期的影响,随发育期的不同而不同,在不同的区域也有不同的表现。在研究未来气候变化对发育期的影响时,如果能考虑到这种区域差异,将有助于降低模拟的不确定性(图6)。(邬定荣)
2.12 应用统计模型模拟气候变化对玉米产量的影响及不确定性研究
多模式的集合是处理不确定性的有效方法。研究考虑由IPCC第5次评估报告的8个全球气候模式和3个排放情景(RCP2.6/4.5/8.5)组成的24个气候模式数据代表气候输出不确定性,与应用Bootstrap方法产生100组参数的2个统计模型代表的作物模型内部参数不确定性相结合,以辽宁省本溪、吉林省长岭、黑龙江省海伦农气站为研究地点,量化评估了2个未来时段(2010—2039年和2040—2069年)相对于1976—2005年基准时段玉米产量的影响及不确定性。研究结果表明,未来2个时段玉米产量降低均不足5%。应用方差分析法,量化了单一不确定性来源对最终集合产量综合不确定性结果的影响,如气候模式结构和排放情景的不确定性、作物模型参数的不确定性。研究结果表明,气候情景的不确定性对最终结果的不确定性影响,要大于作物模型参数不确定性所带来的影响;增加的集合产量方差表明未来气候变化背景下产量模拟的不确定性增加。(张祎)
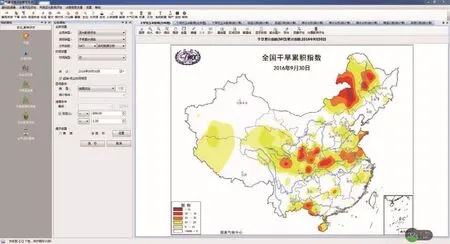
图1 玉米气象干旱业务系统界面Fig. 1 The operational system of maize meteorological drought
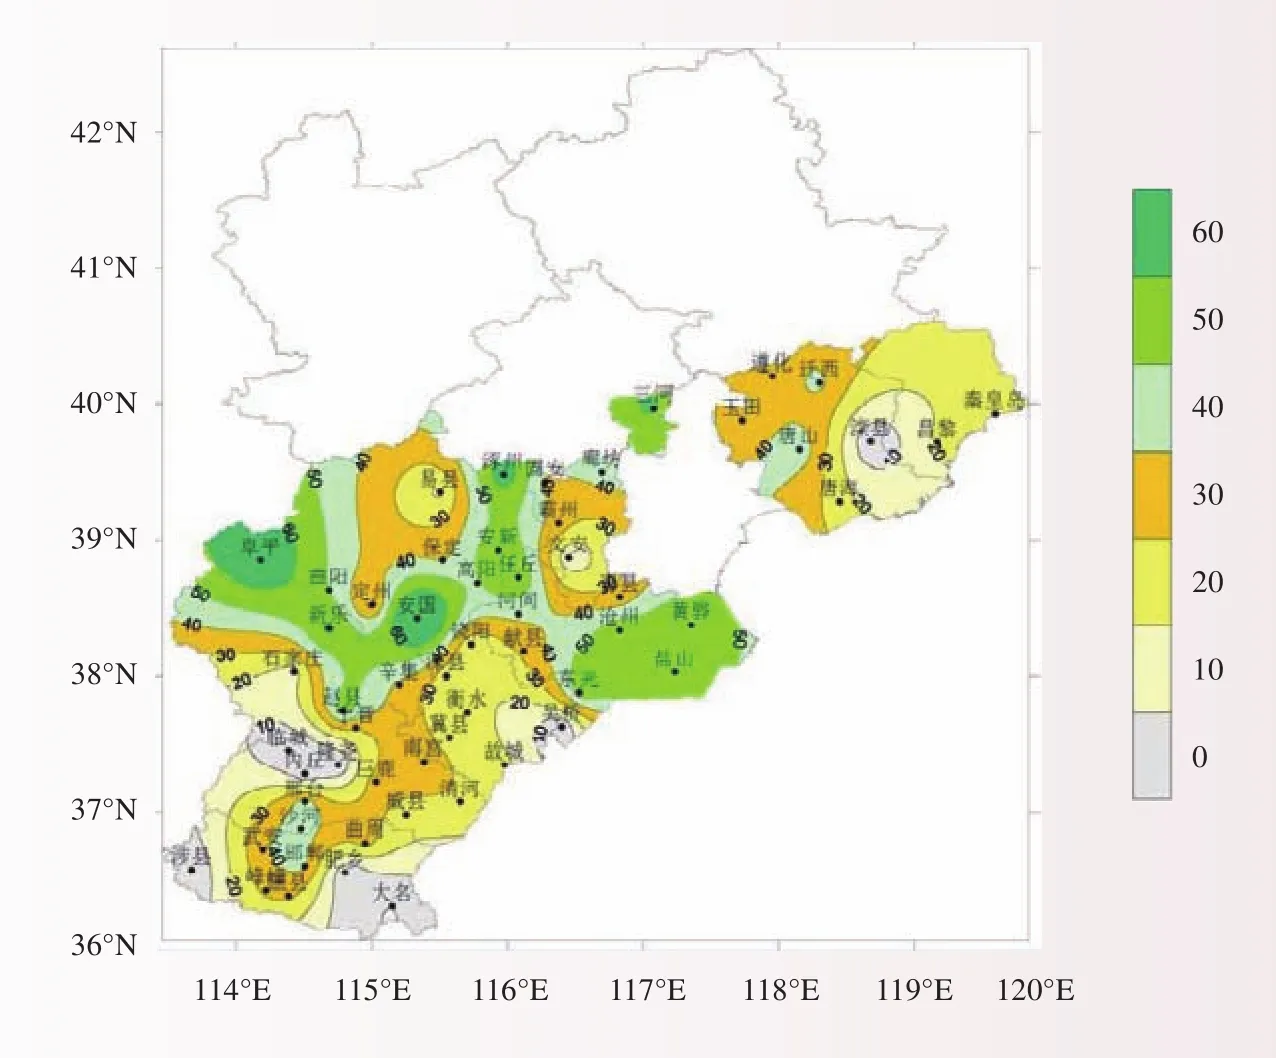
图2 2016年河北省冬小麦开花、灌浆期灌溉量(m3/亩,1亩 = 0.0667 hm2)预报Fig. 2 Irrigation forecast of winter wheat flowering and f lling stage in Hebei Province in 2016
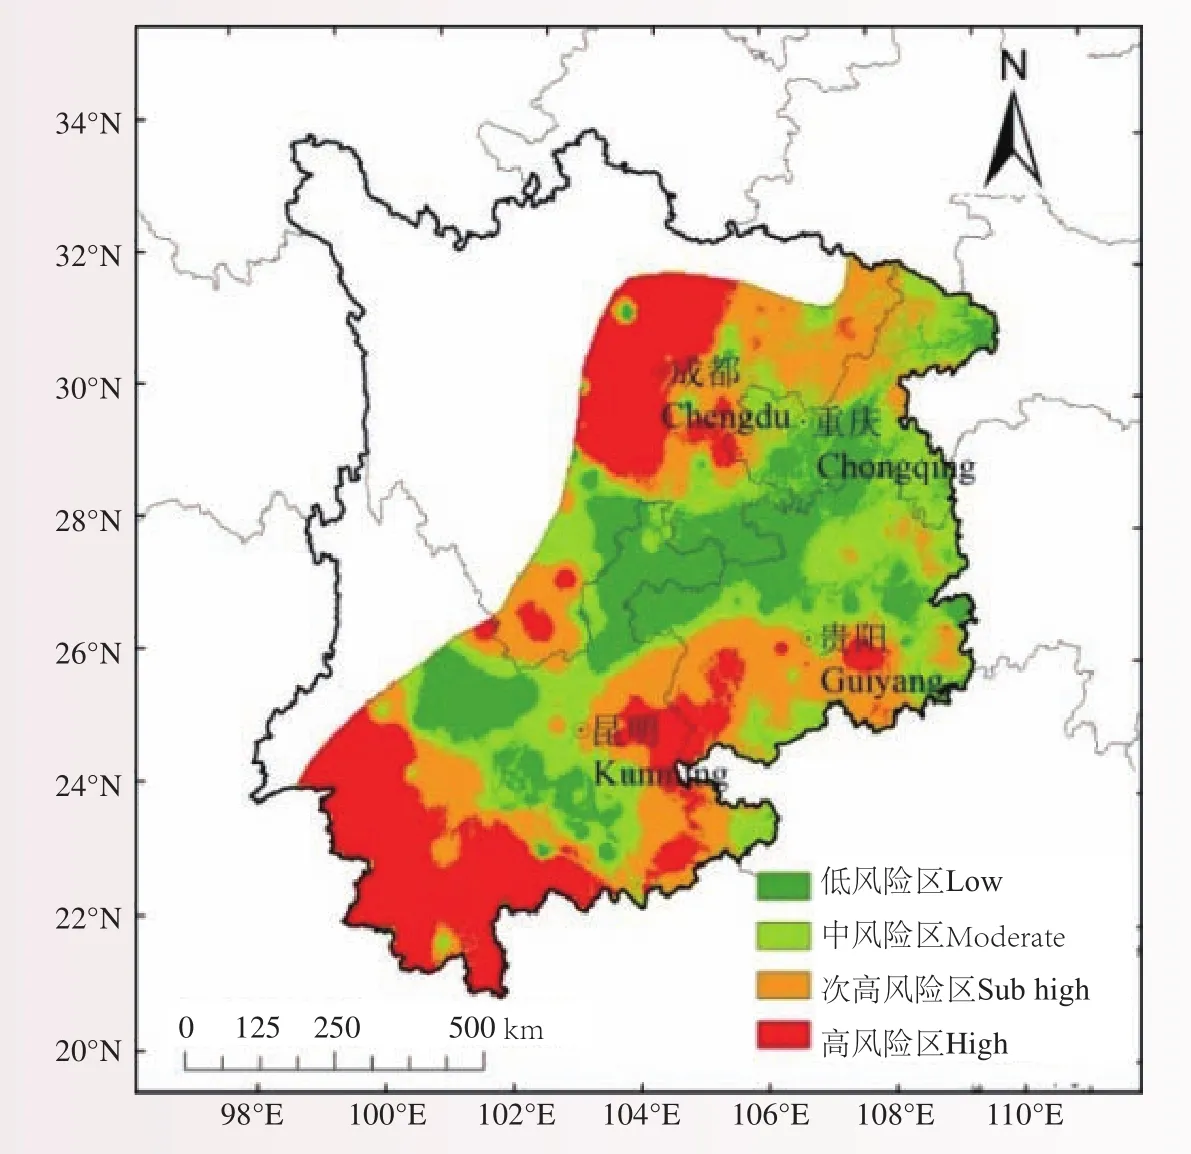
图3 西南地区水稻洪涝综合风险等级空间分布Fig. 3 Spatial distribution of integrative risk of rice flood in Southwest China
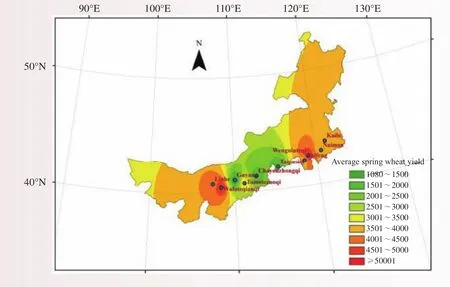
图4 1961—2010年内蒙古春小麦产量平均分布Fig. 4 Average distribution of spring wheat yield in Inner Mongolia from 1961 to 2010
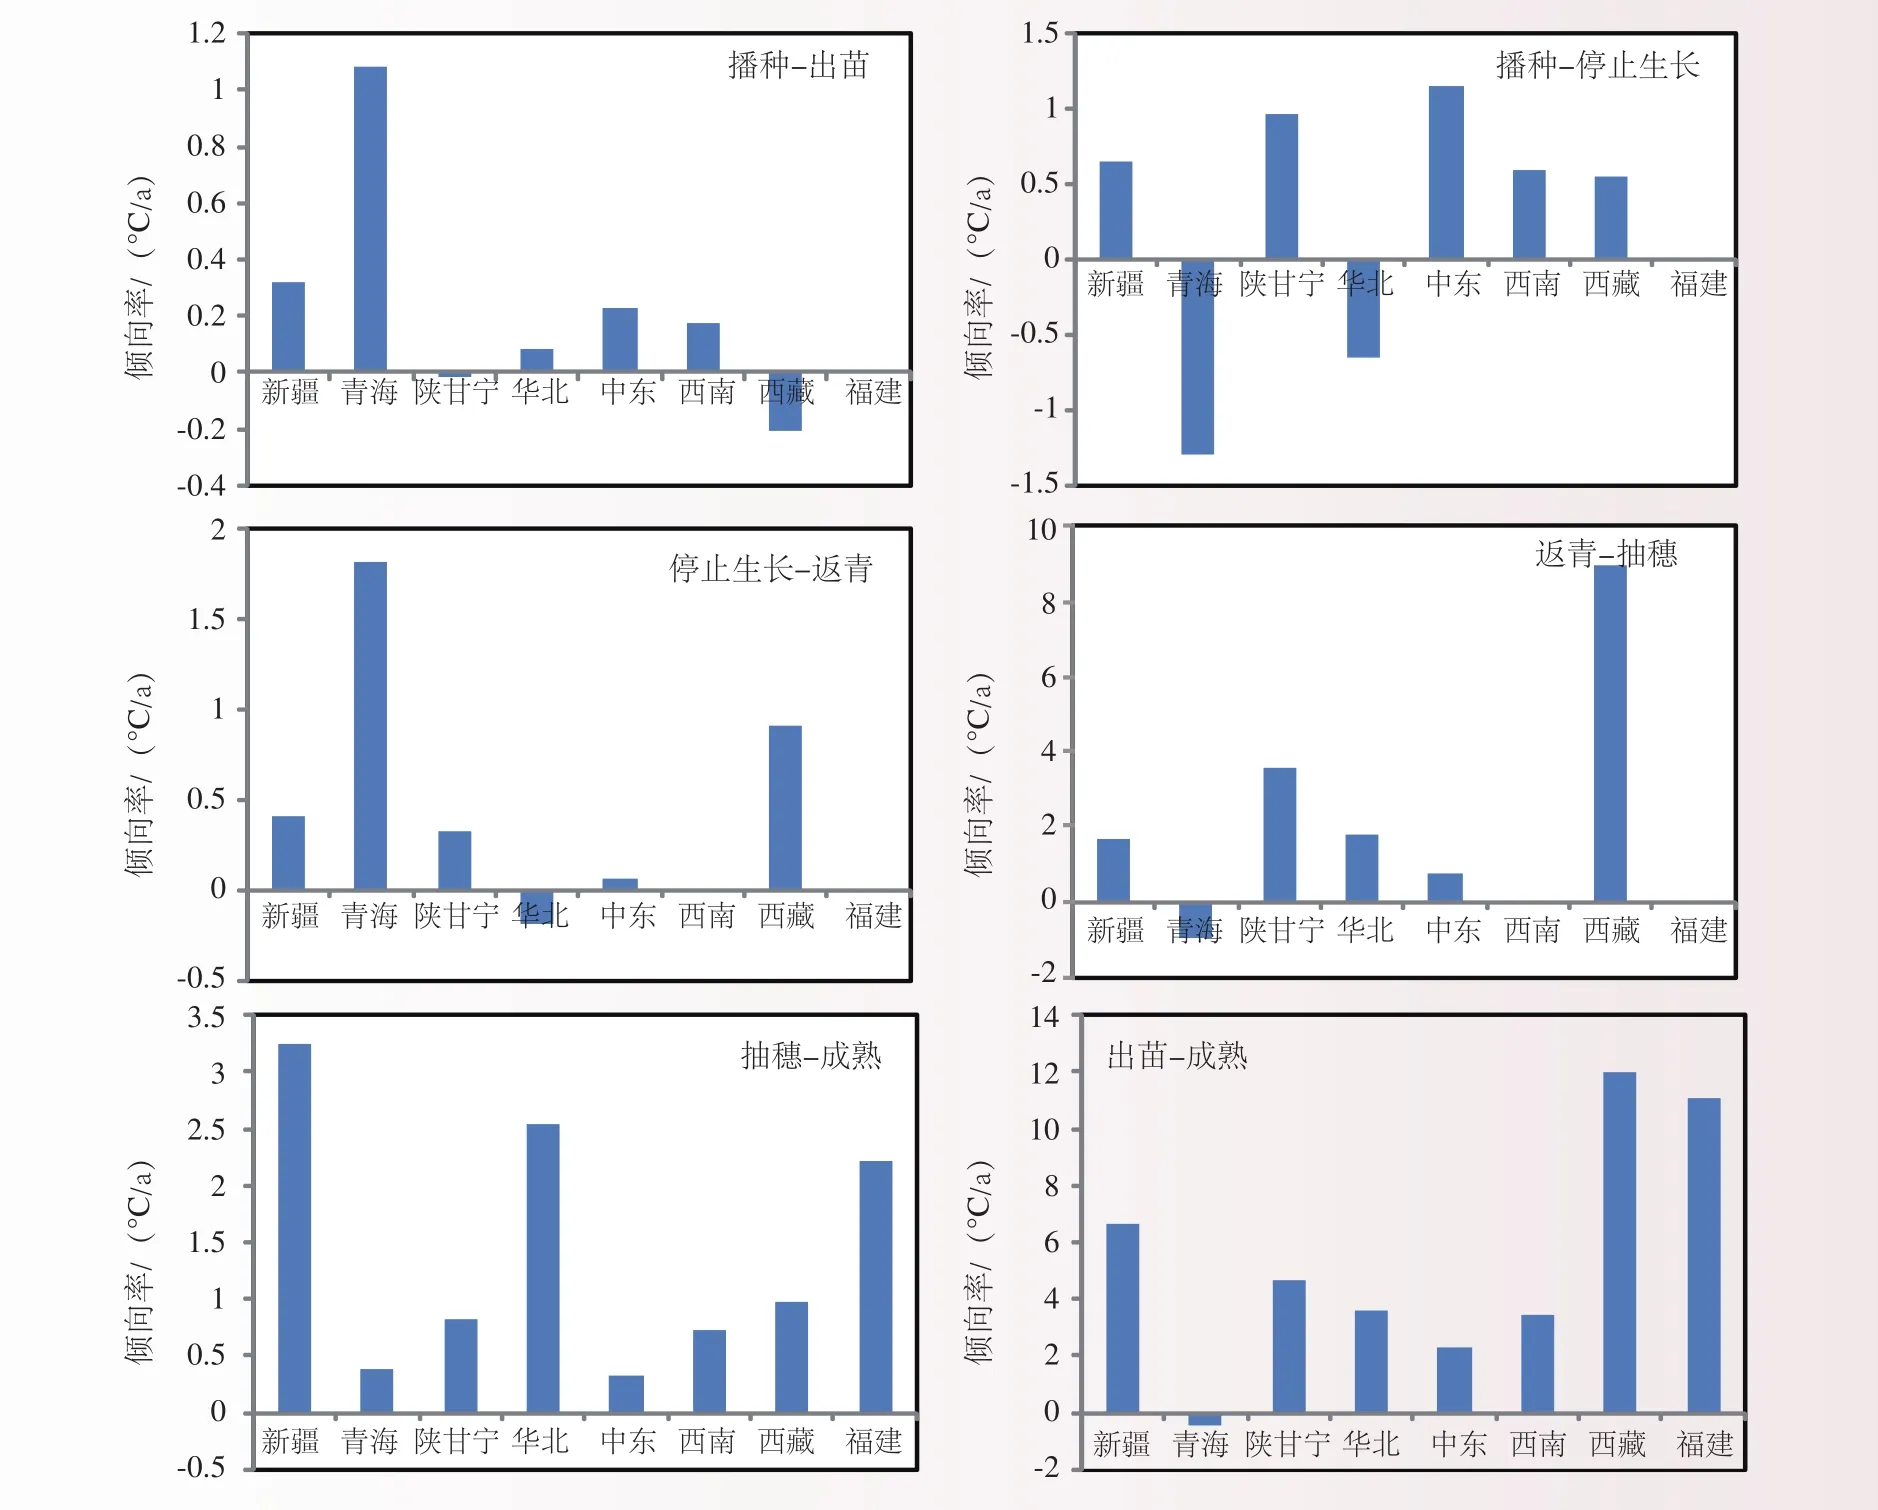
图5 我国不同地区冬小麦品种变化影响不同发育阶段间热量单位的倾向率Fig. 5 The tendency rate of the heat unit in different developmental periods affected by the variation of winter wheat varieties in different regions (Xinjiang, Qinghai, Shanganning, North China, Central and East China, Southwest China, Xizang and Fujian) in China
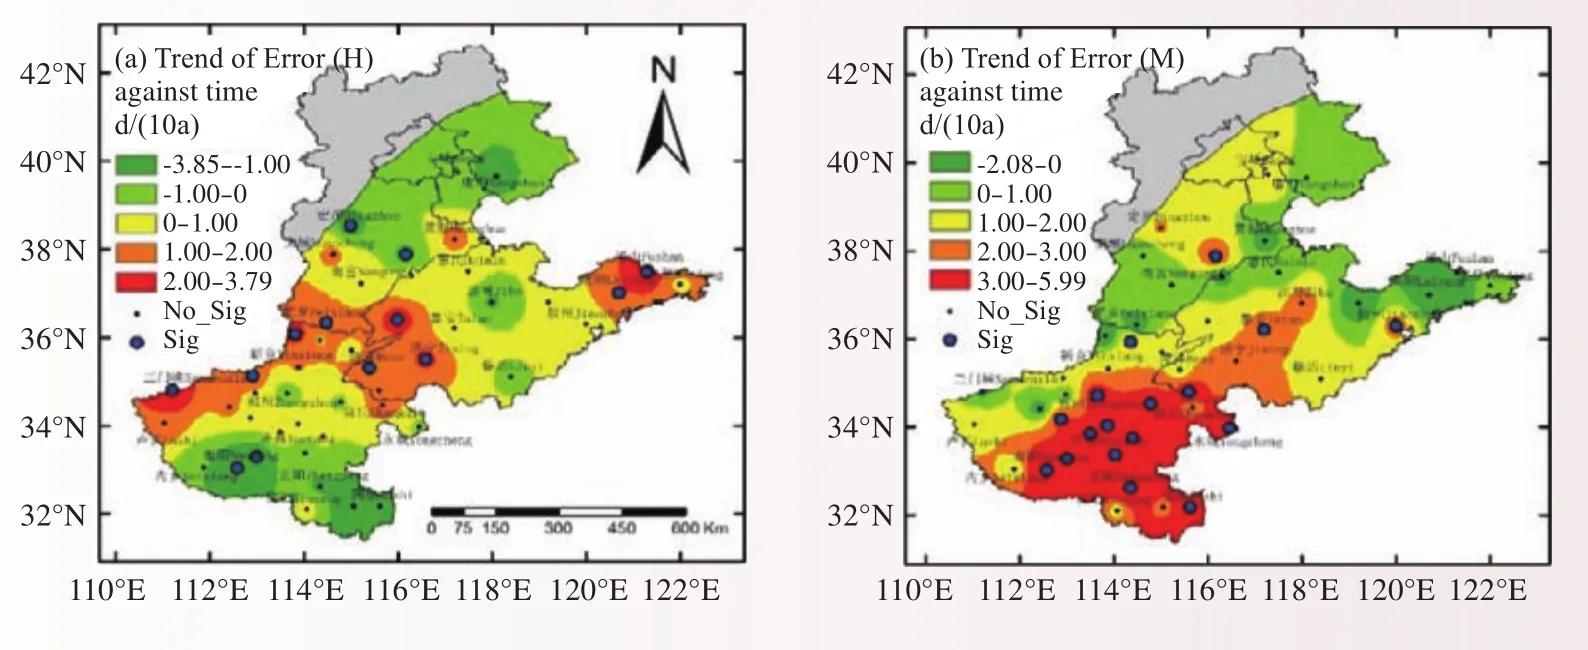
图6 1986—2010年冬小麦抽穗期、成熟期模拟误差趋势空间分布(Error(H)为抽穗期模拟误差;Error(M)为成熟期模拟误差;Sig表示在0.05水平上差异显著;No_Sig表示在0.05水平上差异不显著)Fig. 6 The spatial distribution of the simulation error trends in heading (H) and maturity (M) stages during 1986–2010. Sig denotes significant at 0.05 significance level and No_Sig means not significant at 0.05 significance level
Progress in Ecological Environment and Agrometeorology Research
1 Agroclimatic resources and agrometeorological disasters forecasting and early warning
1.1 Research on flood disaster monitoring and early warning and prevention and control key technology
The results of this project revealed the temporal and spatial distribution characteristics of agriculture,corn, and rice flood disasters in the whole country and in the study area. Eleven sets of corn and rice flood disaster level indicators and ten sets of provincial agricultureflood disaster level indicators were built. Three sets of waterlogging and flood tolerance physiological indicators were established. Three sets of flood control and disaster prevention in cropping model farming and cultivation integrated technology were developed.Three sets of disaster prevention and control of technological processes were constructed. The results have been used for meteorological business applications in Hunan, Jiangxi, Zhejiang, Anhui, Guangxi, Chongqing,Shaanxi seven provinces (district and city). It made and published more than forty special service products and decision-making service reports of floods and agricultural weather. Flood warning and disaster reduction service achieved a significant efficiency of disaster reduction and production increase. This project put forward the construction method of level indicators based on the inverse risk analysis of disaster risk, resolved the key technologies of the flooding level threshold of agricultural flooding, maize and rice flooding, and the comparability of provincial indicators which are based on precipitation process, and provided indicators to support the development of real-time monitoring and forecasting of agricultural disaster. (Huo Zhiguo)
1.2 Techniques of the 3D monitoring and the dynamic assessment of key agrometeorological disasters
To study the 3D monitoring and the dynamic assessment of the dry-hot wind for winter wheat in Huanghuai-hai areas, cold damage for double cropping rice in southern China and agricultural drought in Southwest China, we established meteorological indicators and a grading system for the above agrometeorological disasters, and developed the 3D monitoring and the dynamic assessment techniques which are based on ground observations, remote sensing and crop models and are applied to meteorological operation. The work has some innovations in the following aspects: (1) information coupling is developed into a diversif ed development,which integrated ground meteorological, agrometeorological, farmland small-scale, agricultural situation and disasters, and geographic data; (2) the 3D monitoring and the dynamic assessment have been oriented to modeling, dynamic and refined analysis; (3) the transformation technology of spatial scale is emphasized in the process of multi-source information use. The key monitoring and assessment techniques, which are totally tailored to Chinese agricultural production and disasters, are highly regional and practical, taking into account the operational service needs of the meteorological and agricultural sectors. The implementation of the research findings can significantly improve the monitoring and assessment of agrometeorological disasters in China.(Zhao Yanxia)
1.3 Prediction of the key agro meteorological disasters in China
Impacts of the low temperature stress on double-rice growth in southern China, including its abruptchange, trends, grade risk and the characteristics of the spatial distribution of the integrated risk, were revealed in the study, based on which methods on the risk zoning for prediction was presented. Prediction index and systematic technology were also established to forecast low temperature impacts on double rice growth in southern China, with the prediction accuracy as high as 80% at the temporal scales of either 5 days or one month. Detailed soil moisture can also be obtained by a successfully established prediction system,with functions such as automatic data input, operation and product-generation. The improved crop growth model was used to simulate the regional agro-drought in North China Plain. Coupled with the remote sensing technology, the calibrated crop model showed obvious advantage in regional agro-drought prediction, which was identif ed by the comparison between the simulation results and the base line values. All of the relevant achievements have been applied in the provincial agrometeorological services, leading to an improved prediction of the agrometeorological disaster with higher accuracy. (Liu Jiandong)
1.4 Risk assessment and management technology for major agrometeorological disasters
According to the situation of the frequent agrometeorological disasters such as drought, flood and chilling disasters happened in typical areas in China with severe effects, and the lacks of effective risk assessment technology, the main crops of the major agricultural regions in Northeast China, North China, and the Middle and Lower Reaches of the Yangtze River were selected, based on multi-technology integrated risk analysis methods and the risk study of agrometeorological disasters, centered on crops and started from the continuum of the soil-plant-atmosphere, finally the integrated assessment theory of agrometeorological disaster risk based on the formation mechanism of disaster was proposed. The technologies of assessment coupling static and dynamic risk of agrometeorology disasters, risk mapping, integrated assessment and regional assessment of multi-disasters and early warning were formed. Besides, risk maps of agrometeorological disasters in major crops producing area were made. Agrometeorological disaster risk analysis and evaluation system was developed. Moreover, a countermeasure system of agrometeorological disasters integrated risk management technology was proposed. The extension and application of our main research achievements had good effects on relevant departments of Jilin, Hebei and other provinces which provided the necessary theoretical basis and technical supports for agricultural disaster prevention and mitigation. (Wang Chunyi)
1.5 Soil moisture estimation method based on both remote sensing and air temperature in a summer maize ecosystem
Soil moisture is an important component of the soil-vegetation-atmosphere continuum (SPAC), which is a key factor determining the water status of terrestrial ecosystems, and is also the main sources of water supply for crops. In order to estimate soil moisture at different soil depths at a station level, based on the energy balance equation on the earth and the water deficit index (WDI), a soil moisture estimation model was established on the hypothesis that evapotranspiration deficit ratio (i.e., WDI) depends linearly on soil relative humidity. Thus, the soil moisture could be estimated in terms of the remote sensing data (the normalized difference vegetation index (NDVI) and surface temperature (Ts)) and the ground observations (air temperatureTa). The soil water estimation model was validated based on the data from the drought process experiment on summer maize (Zea maysL.) in response to different irrigation treatments carried out during 2014 at Gucheng Eco-agrometeorological experimental station (39°08'N, 115°40'E) of China Meteorological Administration.The model was used to estimate soil relative humidity at different soil depths (0–50 cm) in terms of the parameters from the genetic algorithm and nonlinear programming algorithm. The results indicate that the soil water estimation model developed in this study is able to evaluate soil relative humidity at different soil depths in the summer maize, and the hypothesis is reasonable that evapotranspiration deficit ratio (i.e., WDI) depends linearly on soil relative humidity. It was shown that the estimation accuracy of 0–10 cm surface soil moisturewas the highest (R2= 0.90). The correlation of the estimated and measured soil relative humidity in deeper soil layers (up to 50 cm) could pass the significance test at the level of 0.0001 with the RMAEs less than 15%and the PRMSEs less than 20%. Results from this study could provide a reference for drought monitoring and irrigation management. (Zhou Guangsheng)
1.6 Critical meteorological conditions in maize response to drought disaster and the monitoring and pre-warning technology
Based on the integrations on the experimental data and relevant studies, the response and adaptive mechanism under the combinations of drought and other key factors oficlimatic change were elucidated preliminarily in terms of the coordinative changes between leaf stomatal conductance (gs), water use efficiency(WUE), and plant/leaf growth. Based on the measurement and experimental data of the present project,the changes in photosynthetically physiological process and chlorophyll fluorescence and their responses to drought and rewatering were examined in maize plants subjected to drought at different growth and development stages. Leaf relative chlorophyll concentration (SPAD meter readings),gs, and transpiration rate(E) significantly decreased in two weeks after withholding water at jointing, but the chlorophyll fluorescence parameters including actual quantum yield of PSII primary photochemistry in the light-adapted state (ΦPSII),maximum quantum yield of PSII primary photochemistry in the light-adapted state (Fv′/Fm′) remained stable.The photosynthetic capacity traits significantly decreased in one week after withholding water at tasseling,and the leafinet photosynthetic rate decreased more due to drought stress during tasseling than during jointing.Based on the measurements on the same leaves during their entire growth periods, the photosynthetic capacity was restored to some extent, but not reaching the level of the control treatment. Light-saturated photosynthetic rate (Asat),gs, andEtrended to decrease; SPAD values increased first, then decreased. In addition, there were greater declines in various parameters under drought relative to the control treatment. The changes in chlorophyll fluorescence parameters (ΦPSII,Fv′/Fm′) of the same leaves remained relatively stable with the leaf growth at amply watering condition. Meanwhile the chlorophyll fluorescence parameters did not decrease significantly under the four drought treatments, even obvious increases in the corresponding parameters occurred after rewatering when the maize plants experienced the drought stress. It is indicated that the drought tolerance of the photosystem II (PSII) may be enhanced with maize leaf growth and development.
Based on the soil moisture observational data, a new criterion of drought intensity for Drought Index,MCI, was given. Firstly, the daily relative humidity time-series (1992–2010) at a certain site was obtained by linear interpolation. Secondly, a statistic model was established based on the relationship between MCI index and soil relative humidity. Then, based on the observed data, the upper limit of meteorological drought index of maize at different growth stages was determined. A “drought impact on maize assessment module”was constructed in the operational system of “meteorological disaster risk management system” based on the above results. The system can be used to evaluate the drought effects on maize. Figure 1 shows the results of the maize drought accumulation index on September 30, 2016. The maize meteorological drought was mainly distributed in the western part of Northeast China, eastern Inner Mongolia and Hubei, Anhui, Jiangsu and Sichuan (Fig.1). (Zhou Li)
1.7 New finding on self-photoprotection mechanism of plant adapting to future climate change
We examined the photosynthetic responses ofStipa baicalensisto relatively long-term exposure (42 days) to the predicted elevated temperature and water availability changes to determine the mechanisms through which the plant would acclimate to future climate change. Two thermal regimes (ambient and +4 °C)and three irrigation levels (partial, normal and excess) were used in environmental control chambers. The gas exchange parameters, light response curves andA/Cicurves were determined. The elevated temperatureand partial irrigation reduced the net photosynthetic rate due to a limitation in the photosynthetic capacity instead of the intercellular CO2concentration. Partial irrigation decreased Rubisco activation and limited RuBP regeneration. The reduction inVcmaxincreased with increasing temperature. Excess irrigation offset the negative effect of drought and led to a partial recovery of the photosynthetic capacity. Although its light use efficiency was restricted, the use of light and dark respiration byStipa baicalensiswas unchanged. We concluded that nonstomatal limitation was the primary reason for photosynthesis regulation inStipa baicalensisunder relatively long-term climate change conditions. Although climate change caused reductions in the light use efficiency and photosynthetic rate, a self-photoprotection mechanism inStipa baicalensisresulted in its high ability to maintain normal live activities. (Zhou Guangsheng)
1.8 Fine soil moisture and irrigation forecasting technologies for winter wheat in northern China and their application
The data set of soil moisture and irrigation forecast was improved. The daily meteorological data and automatic soil moisture data in northern winter wheat region in the data set extended to July 31, 2016. The remote sensing inversion methods of crop water deficit indices were studied further. The decadal changes of theaandbcoefficients in ÅngstrÖm-Prescott formula were analyzed. Theaandbcoefficients of month by month for different ages from 1961 to 2010 in the study area and major regions of China were given. Based on growth mechanism of winter wheat, soil water balance equation, various test data, the previous research of the simplif ed models of water balance in winter wheat field and the fine daily multi-layer soil moisture and irrigation forecast models and the localization trial of three provincial fine soil moisture and irrigation forecasting systems of winter wheat, a national fine soil moisture and irrigation forecasting system software was constructed initially. Using the project research results and three provincial fine soil moisture and irrigation forecasting system service platforms, a number of service products were released and provided valuable reference information for agriculture and other departments in Hebei, Shandong and Henan provinces (Fig. 2).(Mao Fei)
1.9 Meteorological disaster risk zoning of melon & vegetables in Hainan Province
Based on the occurrence frequency and process precipitation of different dry or less rainy days in March to May from 1971 to 2010 in Hainan cities and counties, the spring drought artificial control experiment was carried out. The experiment was conducted with uniform combination design of continuous drought days (10,15, 20, 25, 30, 35, 40, 45, 50 days) and the amount of water supply (0, 2, 4, 6, 8, 10, 12, 14, 16 mm): 2 factors 9 level treatments, the determination of different treatments under different depth of soil (10, 20, 30, 50, 100 cm), the effects of different treatments on the seedling death rate, physiological characteristics and yield of pepper were analyzed. The results show that the rate of dead paprika seedlings was significantly correlated with soil relative moisture at depth 20 cm and continuous drought days, and little correlated with irrigations.With the increase oficontinuous drought day duration, net photosynthetic rate, transpiration rate and stomatal conductance of paprika decreased and relative yield loss increased significantly. Grades index of spring drought disaster for paprika was constructed, the drought disaster index for paprika fitted well the actual drought disaster situation and could help provide strategies for monitoring and precaution against drought disaster for paprika. (Huo Zhiguo)
1.10 Temporal and spatial variation characteristics of potential evapotranspiration in China during 1961—2015
The spatio-temporal distribution characteristics of evapotranspiration (ETo) on the national and four climatic regional scales were analyzed at annual, seasonal and decadal scales, respectively, and the reasons ofthe spatio-temporal pattern for ETowere analyzed based on Penman-Monteith method and daily meteorological data at 552 meteorological station in China from 1961 to 2015. Results show that the average annual ETois about 621–1733 mm in China. The regions with the highest ETomainly distribute in the arid region, while the areas with lower EToconcentrate in the semi-arid, humid and semi-humid regions at both 55-year average and different decadal scales. The spatial distributions of EToare different in the seasonal scale. ETois the highest in summer, followed by spring and autumn, and the lowest in winter. Temporally, the average annual ETodecreases at a rate of – 0.52 mm/a from 1961 to 2015, and the decreasing trend has a mutation phenomenon in 1972. Although there is an increasing trend since the last decade of the twentieth, the mutation year was not detected with the M-K method. The change trend of ETois different in different climate regions. EToin most sites showed a decreasing trend in arid region and humid region, and the number of meteorological stations with decreasing rate in arid region is more than that in humid region. In semi-arid and semi-humid regions, the number of sites is roughly equivalent to the increasing or decreasing trend for ETo. EToat more than 85% of the sites in China was mainly affected by wind speed and sunshine time. Studies have shown that the decreasing trend of EToin nearly 55 years was mainly caused by the decrease of the wind speed, the reduction of sunshine time and the slight increase of vapor pressure. (Wang Peijuan)
1.11 Construction of drought monitoring index based on the winter wheat water stress experiment
Aiming to study the effects of different irrigation treatments on the growth and development of winter wheat, the field experiment was conducted with local predominant variety to simulate three water stresses,i.e., persistent severe drought, moderate drought, and mild drought, during the whole growth period of winter wheat over 2013–2014 (variety: Henong 6425) and 2014–2015 (variety: Yanmai 98) using the large-scale artificial water control field at the Gucheng ecological-meteorological experimental station in North China Plain. Based on water balance equation, the actual evapotranspiration of winter wheat under different water stresses (ETa) and CK conditions (ETc) were computed. Furthermore, a crop drought monitoring index (CDMI)which can reflect the degrees of water demands and deficits was built based on ETaand ETc. The thresholds of CDMI were determined referring to the yield reduction of winter wheat under different persistent water stresses, and further constructed a drought monitoring index system of winter wheat during the whole growth period. Compared to the traditional drought monitoring index based on potential evapotranspiration, the CDMI based on ETccan reflect drought degree more objectively and reasonably, which can be served as a method to monitor the drought of winter wheat in North China Plain. (Wang Peijuan)
1.12 Flood risk assessment and zoning for rice in Southwest China
As the main crop in Southwest China (Sichuan, Chongqing, Guizhou and Yunnan provinces), rice is widely accepted to be seriously threatened by the flood disaster. Agro-flood risk analysis is helpful for improving the ability of regional disaster management and reducing potential flood risk. In this study, the rice flood risk was analyzed and zoned using the integrated rice flood risk assessment model including hazard, exposure, sensitivity, and flood prevention and mitigation, and based on the daily rainfall data in 193 meteorological stations from 1961 to 2012, rice production data in 396 counties including plant and yield data from 1981 to 2012, the phenophase data of rice from 17 agrometeorological stations and geographic data in Southwest China. The results indicate that flood hazard risk probabilities variated with phenophase and hazard level. High flood hazard risk happened in transplanting-tillering stage, followed by jointing-booting and tasselling-maturity stages. High-risk areas of flood hazard in the whole rice growth stage was detected to be located in southern and northeastern Yunnan, southern Guizhou, and Chengdu, Meishan and Deyang in Sichuan Province. High and sub-high exposure zones were mainly located in the northeastern part of Sichuan Province and Chongqing. Subsequently, high and sub-high sensitive zones were mainly found in the northernYunnan Province, southern Sichuan Province and southeastern Guizhou Province. Low flood prevention and mitigation zones were located in parts of Guizhou. Finally, the high and sub-high zones for the integrated rice flood risk were detected in the northeastern Sichuan Province, southern Guizhou Province and southern part of Yunnan Province, while southern Chongqing and northern Yunnan were recognized with low rice flood risk (Fig. 3). (Yang Jianying)
1.13 Effects of winter and spring irrigation on winter wheat in North China
A field simulation experiment about irrigation of the first springing water (FSW) at different air temperatures (0, 3, 7, and 10 °C) in 3 years was designed under the preconditions of the irrigation of overwintering water (OWW) (80/150 mm) and no OWW. We explored the effects of OWW and FSW irrigation on growth and grain yield, and tried to find appropriate irrigation patterns and schemes of winter wheat in the North China Plan (NCP). The results show that FSW irrigation could relieve winter drought in air temperature stability through 0 °C under no OWW irrigation, which increased effective stalk number in spring, effective panicle number and grain yield significantly. The time of continuous drought in key growth stages could be reduced by FSW irrigation in air temperature stability through 7 °C under OWW irrigation, which increased grain yield significantly. We found no significant relationship between the amount (80 mm and 150 mm) of OWW irrigation and grain yield. Meanwhile, FSW was essential to the growth of winter wheat: there was an average reduction of 32.2% on grain yield under no FSW irrigation. Therefore, in order to ensure a stable and high yield of winter wheat and water-saving irrigation in the NCP, we should irrigate FSW in air temperature stability through 0 °C under no OWW irrigation and irrigate FSW in air temperature stability through 7 °C under proper amount of OWW irrigation. (Liu Tao)
1.14 The response mechanism of soil respiration on grassland desert hydrothermal change
A warming treatment and a control, and three watering levels were applied using a free air temperature increase facility with open soil carbon flux measurement system.Rswas measured throughout the year, and soil nutrition properties and microbial biomass carbon were determined over the growing season.Rsrates were significantly higher during the growing season than during the non-growing season. However, the warming treatment led to a marked increase inRsin winter. Soil temperature andRswere described by an exponential function with aQ10of 1.92 (R2= 0.74,p< 0.01); and root respiration (21.9%) was lower than heterotrophic respiration (78.1%). Soil organic carbon, soil moisture, root biomass, and soil ammonium-N were determined to be drivingRsduring the growing season. The most important factor was soil organic carbon content in the 0–10 cm soil layer, with soil moisture showing little direct effect onRs. Using the four most critical factors of soil respiration under hydrothermal conditions in the growing season, we established a model describing the responses ofRsto environmental change (R2= 0.67,p< 0.01). Soil environmental variables including temperature, moisture, nutrition status, root growth, and soil microbial activity might co-regulate soil carbon emission, which would be considered critical in assessing the carbon balance under climatic change in arid areas. (Liu Tao)
1.15 Estimating water use patterns in winter wheat using remote sensing in Huang-Huai-Hai Plain
Each water use component of winter wheat in Huang-Huai-Hai (3H) Plain from 2011 to 2012, including effective precipitation (PPeff), irrigation water applied (IWA), actual evapotranspiration (ETa) and on-farm water losses (F), was calculated at both temporal and spatial scales, integrating meteorological data, MODIS,SEBAL (Surface Energy Balance Algorithm for Land) model and the water balance equation. There was a clear relationship between survey- and model-values of IWA (R2= 0.79), indicating the applicability of the model-based method in IWA estimation.Precipitation in the 3H Plain provided >70% of total water use at theearly stage of winter wheat. However, over 90% of crop water use depended on IWA at the grain f lling stage.A high-IWA belt for the whole growing stage in winter wheat was mainly observed in basin-irrigable land and dry land, with average IWA = 412.76 mm. Water consumption in the winter wheat period represented a significant relationship with irrigation (p< 0.01) in 3H Plain, withR2of 0.68. (Yang Jianying)
2 Response and adaptation of agriculture to climate change
2.1 Assessment of agrometeorological disasters and yield losses in China since 1961
Since 1961, the extreme climate events in the whole nation showed an increasing trend. China,s climate exhibited warm becomes warmer and dry becomes drier, together with more floods under the climate change. Both the area and occurrence frequency of the national agricultural drought disaster also showed an increasing trend, and the drought showed an increasing trend from south to north. The occurrence frequency of waterlogging in winter wheat showed an increasing trend, and the intensity of the disaster increased more obviously in the late growth stage. The high temperature heat damage of paddy rice showed a significant increasing trend, and the severe disasters increased significantly. The chilling damage showed a decreasing trend, but in the recent 30 years, low temperature and rainy injury showed an increasing trend. The frost damage generally decreased, but the local area has aggravated the trend. The changes in evolution trend,intensity and types of agro meteorological disasters have taken place. As a result, the agricultural layout at present, together with the countermeasures for the food security and the ecological civilization construction as well as poverty alleviation, should be adjusted in order to adapt to the changing agrometeorological disasters.(Zhou Guangsheng)
2.2 Research on status quo, rate, mechanism and potential of carbon sequestration in grassland ecosystem in China
Based on more than 4 thousand survey points and TEM model, the carbon density, spatial distribution and dynamic change of grassland ecosystem in China were simulated with monthly time step, using climate,elevation, soil and vegetation data. The carbon storage of grassland ecosystem in China was estimated. The spatial distribution pattern of soil carbon density in Chinese grassland was drawn, and its spatial distribution characteristics were revealed. The spatial and temporal variation of carbon density of grassland in China and its regional differences since 1960s were quantitatively described. Carbon budget in China under the future climate scenarios was simulated. The main innovation is to solve the problem that the spatial precision of TEM is not high based on a set of parameters. A parameterization scheme was presented according to grassland ecology zone, and a series of TEM model parameters suitable for Chinese grassland were established, which could provide a basis for monitoring and evaluating carbon budget, NPP, GPP, etc. (Ji Yuhe)
2.3 Key technology on the agrometeorological service for highland barley production under climate change scenarios
The solar radiation resource will reduce slightly under both A2 and B2 climate change scenarios over the Tibetan Plateau, while it would still be/retain the region with the most abundant solar resource in the world. Temporal distribution pattern of the solar radiation will have no obvious change under both A2 and B2 scenarios, with the minimum in winter and maximum in summer. However, the monthly variation in the solar radiation will change clearly, increasing in summer and decreasing in other seasons. Trends in the total annual precipitation will increase under climate change scenarios, yet it will still be referred to as the lessprecipitation area in the world. Seasonal precipitation will become even more inhomogeneous, with minimumin winter and maximum in summer, revealing an increase in precipitation simultaneously. The general spatial distribution pattern of precipitation, with precipitation decreasing from east to west spatially, will witness no marked change under climate change scenarios, but increase in precipitation will become more obvious in the western than in the eastern part of the Tibetan Plateau. Increase in temperature will have positive impacts on the enhancement of highland barley yields under climate change scenarios, but the main features in the spatial distribution of highland barley yields will basically remain unchanged. Higher enhancement of the highland barley yield will occur in the current high-yield regions. In other words, under climate change conditions in the future, the greater enhancement of the highland barley can be expected/envisaged in the current optimum regions for highland barley growth. (Liu Jiandong)
2.4 Identifying the effects of climate change on the yield of main dryland crops in the northern China based on APSIM crop model
The responses of key growth stages and yield of spring wheat and spring maize to climate change in the northern China were identif ed based on the optimized APSIM crop simulation model. The results show that the APSIM model had a good applicability in Inner Mongolia, Gansu, Heilongjiang, Jilin, Liaoning and other northern regions. The potential yield of spring wheat in Inner Mongolia decreased from 1961 to 2010, with an average of 3561 kg/hm2. In particular, the potential yield of spring wheat was the highest in the 1980s (3681 kg/hm2) and the lowest in the 2010s (3433 kg/hm2). There were significant differences among regions. Over the past 50 years, the potential yield of spring wheat in Inner Mongolia increased gradually from the middle region to the east and the west regions. Among the three regions, the potential yield of spring wheat was the highest in the western region and was the smallest in the middle wheat region.
The main meteorological factors in fluencing the key growth stages of spring maize in Inner Mongolia were the maximum temperature, followed by the minimum temperature. The effects of solar radiation,precipitation and potential evapotranspiration on the growth stages of spring maize were the same. The key meteorological factors affecting the spring maize yield were the maximum temperature, the minimum temperature, precipitation, solar radiation and potential evapotranspiration (Fig. 4). (Zhao Junfang)
2.5 The stability assessment of different accumulated temperature model on accumulated temperature in different stages of spring maize in Northeast China
Based on the growth data of 4 spring maize varieties “Danyu 13” “Longdan 13” “Dongnong 248” “Sidan 19” and the meteorological data in Northeast China, the model parameters of Shen Guoquan’s, Gao Liangzhi’s and Yin Xinyou’s nonlinear accumulated temperature models were fitted, respectively. The stability of accumulated temperature of simulated results from different nonlinear models were compared and evaluated.They were also compared with the results of the commonly accumulated temperature model. The results of Shen Guoquan’s, Yin Xinyou’s, Gao Liangzhi’s nonlinear accumulated models and the commonly accumulated temperature model showed that the stability of accumulated temperature from the three nonlinear models are better than the commonly accumulated temperature model from emergence to maturity. From seedling to jointing stage, the stability of accumulated temperature from the four models are uniform for “Danyu 13”, but the three nonlinear models are slightly better than the commonly accumulated temperature model for “Longdan 13” “Dongnong 248” “Sidan 19”. The stability of the accumulated temperature from the jointing to tasseling stage is the worst stage, because the coefficient of variation in this stage is the biggest for each of varieties.From the tasseling to maturity stage, the stability of the accumulated temperature is almost not different in the four models. The results provide a theoretical basis and technical support for the development of spring maize in Northeast China. ( Guo Jianping)
2.6 Effects oficlimate change on agricultural climate resources in the northeast region of China
The temporal and spatial characteristics of major agroclimatic resources in the northeast region of China were systematically analyzed. During the period of 1961–2099, the heat resource is more abundant in the southern region than in the northern region, and the heat resource shows a significant increasing trend in the future. The average annual temperature in the northeast region of China will rise by about 2 °C and 3 °C in median emission scenarios (RCP4.5) and high emission scenarios (RCP8.5), respectively. The first day of over 10 °C will appear 3–4 days earlier. The first frost date will delay by 2–6 days. Therefore, the potential growth season may increase by 4–10 days. The accumulated temperature will be enriched because of temperature rising and growth season extending. By the end of this century, the accumulated temperature will increase by 400 °C.d and 700 °C.d in median emission scenarios and high emission scenarios, respectively. Water resource shows a weaker increasing trend. There are significant changes in the heat resource change rate,and high emission scenario corresponds to a faster warming. There is a warming trend in the future in the northeast region of China. The temperature rising in the northeast region of China has a positive impact on agricultural production. The heat resource that can be used by crop will be more abundant because of growth season extending and accumulated temperature increasing. The original no-planting area due to heat resource restrictions will be reduced, and the planting area will be expanded. The planting varieties will be improved,the region planting early maturing varieties can be replaced by late maturing varieties, and the late maturing varieties planting area will be further expanded. As such, the late maturing maize needs the accumulated temperature to reach 3000 °C.d, the planting area will extend from the original Songnen Plain to the Greater Khingan Range. Even double crops a year may occur in some areas in Liaoning. (Guo Jianping)
2.7 On the effects of CO2concentration elevation and temperature rising on crop water requirement
Based on the experiments during 2013–2015, the changes in wheat water use efficiency and the coupling mechanism correlation with water requirement and yield under the background of elevation in atmospheric carbon dioxide concentration and increase in air temperature in future were analyzed. The results show that the individual effects of increase in air temperature and elevation in atmospheric carbon dioxide concentration on wheat water requirement and wheat growth are additive. The increased air temperature lifted the temperature in wheat canopy and communities, eventually accelerated energy flow and hydrological cycle within the wheat field. As a result, the daily water requirement has rose through increase in transpiration from wheat plant and evaporation between plants. The elevated CO2also led to reduced leaf stomatal conductance and net photosynthetic rate, resulting in higher water use efficiency. In addition, the CO2fertilization effect has promoted wheat yield increase. On the integrative view, the elevation in atmospheric carbon dioxide concentration and increase in air temperature have increased the wheat water requirement, resulting in higher water use efficiency. The increased water requirement in turn has contributed to wheat yield increase. In the future, the more agricultural thermal resources and atmospheric CO2imported in the wheat eco-system will induce increased wheat water requirement, and further the higher yield and WUE, leading to a positive feedback circulatory eco-system. (E Youhao)
2.8 Study on the regulation mechanism of vegetation succession of abandoned farmland in farming pastoral zone in northern China
In this work, the vegetation succession process of abandoned farmland in farming-pastoral zone in northern China was studied using a space-for-time substitution method by transect sampling. The regulation mechanism of natural environmental factors on vegetation succession in abandoned farmland was revealed from a relatively macro perspective.
According to the research objectives of the project, the field transect survey was carried out in Shanxi-Ningxia agro-pastoral ecotone. Soil moisture content, soil texture and nutrient content at soil depth of 0–500 cm, as well as vegetation coverage, biomass, species and other information in the typical ecosystem of agropastoral ecotone were collected. In view of the greater temporal and spatial variability of rainfall, temperature and other meteorological factors, the more stable environmental information such as soil dry layer, soil texture, geomorphology as well as climatic factors will be used to select the key factors restricting the spatial distribution and community succession of ecosystem to explore the environmental adaptability and tolerance to climate change in northern China. In addition, tree ring data were also collected and will be used to study the response and adaptation to climate change of the northern ecosystem. (Ji Yuhe)
2.9 The impact of elevated temperature and CO2concentration on winter wheat yield and grain quality
During 2015–2016 winter wheat growing season, the third year of the manipulative experiment under elevated temperature and CO2concentration using OTC and infrared heaters was conducted. The data for phenology, plant height, stem density and dry biomass per plant obtained in this year produced results essentially in agreement with those in previous two years. The root cause of yield decline was still the reduction of grain number per ear, which was mainly attributed to the significant reduction of spikelet number in this year. Meanwhile the data of grain quality and leaficarbon and nitrogen contents measured in the 3 consecutive years were analyzed. The results show that crude protein in winter wheat grain under the combined treatment slightly increased, but the contents of fat, f ber and starch in grain were not significantly in fluenced.No significant differences in nitrogen and organic carbon contents in winter wheat leaves were found between the combined treatment and control over growing stages, although a tendency of decline of nitrogen content in winter wheat leaves from jointing stage to flowering stage likely existed. (Tan Kaiyan)
2.10 Effects of wheat varieties improvement on phenology in China
The effects of wheat varieties improvement on phenology were analyzed using the agrometeorological observation data in China. The results show that there is an increase in heat units at different developmental stages caused by varieties change. The heat unit from emergence to maturity increased by 3.5 °C/a. A comparison of different regions indicates that the variation of spring wheat varieties in Tibet, Inner Mongolia and Xinjiang has a great in fluence on the phenology. Most of them are positive effects on heat unit in different developmental periods. The change of winter wheat varieties has no obvious effect on heat unit during sowing to emergence, emergence to stop growth, stop growth to turn green, jointing to heading and milk to maturity while positive effect on heat unit during turning green to jointing and heading to milky. The effect of winter wheat variety on phenology is still large in Qinghai, Tibet, Fujian and Xinjiang. The effects are mostly positive on heat unit in different developmental periods (Fig. 5). (Ma Yuping)
2.11 Quanti fication of impacts of the main in fluencing factors in the growing period of winter wheat and simulation of the impact on production
Winter wheat phenological observation and daily average temperature data were collected from 47 agricultural meteorological observation stations in the North China Plain (NCP) during 1986–2010. A bilinear phenology model, which is based on three-base-point temperature (Tbwas set to 0 °C;Topt, 22 °C;Tmax, 32 °C), was used to detect the impact of cultivar shift on phenology. Parameters of the phenology model were calculated and validated by the state of average varieties during 1986–1988. The durations from turning green to heading(T-H) and heading to maturity (H-M) during 1986 to 2010 were simulated and the trends of the simulation errors over years were calculated. Generally, duration of T-H increased by cultivar shift, but few of the trendsare statistically significant. The trends are varied substantially at different stations. The days of T-H in the southern and northern plain were slightly shortened, while in central area and eastern Shandong, it increased significantly. Cultivar shift increased the duration of H-M significantly, especially in the southern plain, but no so obvious in the other areas, though it was slightly shortened in some areas. This study shows that the effects of cultivar shift on phenology were different in different development stages and regions. In the studies regarding the effects of future climate change on phenology, the uncertainties of the results will be reduced if this spatio-temporal difference of the impacts was considered (Fig. 6). (Wu Dingrong)
2.12 Using statistical model to simulate the impact of climate change on maize yield with uncertainties
The multi-model ensemble method is an effective way to deal with uncertainties. 24 climate projections consisting of the combinations of eight GCMs and three emission scenarios representing the climate projections uncertainty, and two crop statistical models with 100 sets of parameters in each model representing parameter uncertainty within the crop models, were employed to evaluate the impact of climate change on maize yield at three locations (Benxi, Changling, and Hailun) across Northeast China (NEC) in the periods 2010–2039 and 2040–2069, taking 1976–2005 as the baseline period. The results of ensemble simulations showed that maize yield reductions were less than 5% in both future periods relative to the baseline. To further understand the contributions of individual sources of uncertainty, such as climate projections and crop model parameters in ensemble yield simulations, variance decomposition was performed. The results indicate that the uncertainty from climate projections was much larger than that contributed by crop model parameters. The increased ensemble yield variance revealed the increasing uncertainty in the yield simulation in the future periods.(Zhang Yi)